In recent years, the growing concern for air quality has led to the development of sustainable vehicles to replace conventional internal combustion engine (ICE) vehicles. Currently, the most widespread technology in Europe and Portugal is that of Battery Electric Vehicles (BEV) or plug-in HEV (PHEV) electric cars, but hydrogen-based transport has also shown significant growth in the commercialization of Fuel Cell Electric Vehicles (FCEV) and in the development of new infrastructural schemes. In the current panorama of EV, particular attention should be paid to hydrogen technology, i.e., FCEVs, which is potentially a valid alternative to BEVs and can also be hybrid (FCHEV) and plug-in hybrid (FCPHEV). Several sources cited show a positive trend of hydrogen in the transport sector, identifying a growing trend in the expansion of hydrogen infrastructure, although at this time, it is still at an early stage of development
1. Introduction
Growing concerns about environmental issues have led to the evaluation of alternative solutions to the current mobility situation. In fact, in the last two decades, energy and the environment have become increasingly important in Europe, with a steadily increasing demand and consumption of energy. With the launch of the European Green Deal
[1], the European Commission has decided to reach the decarbonization goal by 2050. Currently, the transport sector alone accounts for almost one-third of the EU’s CO
2 emissions
[2]. Thus, sustainable mobility can play an important role in the decarbonization of the mobility in Europe, which is why it is receiving great attention in the old continent. In recent years, the spread of sustainable vehicles has been strongly driven by the governments of many countries as an alternative to the use of traditional internal combustion engine (ICE) vehicles. Currently, the most widely accepted and used sustainable transport technology is based on battery electric vehicles (BEV) or plug-in hybrid EVs (PHEV), which use the energy stored in an on-board battery pack to provide an electric motor for propulsion. There are policies in place at the global and in particular at the European level to allow this transition; economic, technological and industrial developments have certainly favored the EV market in recent years, with great expectations of future expansion. Currently, however, there are still obstacles to overcome, such as prices that are still too high, and some technical aspects, such as the charging infrastructure; this still makes the attractiveness of the EV market lower than conventional ones. One of the most promising alternative options to support BEV mobilities in parallel may be the introduction of Fuel Cell Vehicles (FCEV), which were marketed by Toyota as early as 2014. There is still a technology gap in the success of FCEV due to the problem in hydrogen management, high cost of battery and Fuel Cell components, water management, etc. It turns out that the use of Fuel Cell has a much higher energy density than other types of energy storage devices. The energy density of the Fuel Cell is higher than that of other energy storage devices, and therefore, it can be used for long-term applications. In this way, the so-called “reload anxiety” that conditions people to purchase BEVs is overcome
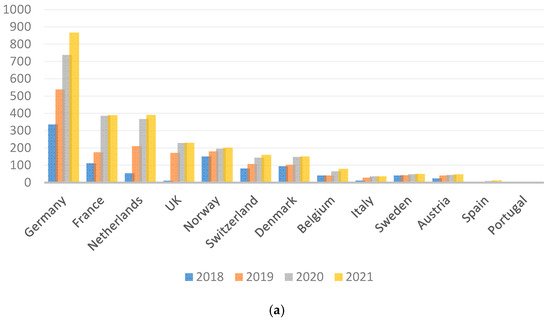
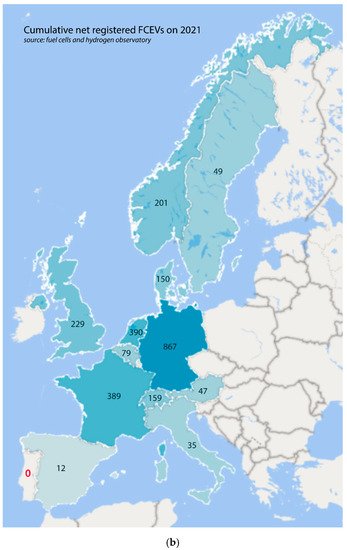
[3]. As can be seen from
Figure 1a,b, Fuel Cell Vehicle data in Portugal show that as yet, no private FCEVs have been sold over the years
[4].
Figure 1. (
a,
b) Cumulative Net registration FCEVs in Europe (data source: fchobservatory)
[4].
McNichol et al.
[5] compared the advantages and disadvantages of Fuel Cell vehicles. repurchased to vehicles with IC engine, battery-powered vehicles and hybrid vehicles. Their study found that the Fuel Cell using hydrogen or methanol is the best solution for transportation applications.
Offer et al.
[6] conducted a comparative study on hydrogen Fuel Cell plug-in Hybrid Electric Vehicles (FCHEV), Battery Electric Vehicles (BEV), hydrogen FCEV and IC engines for the current circumstances and for 2030. A comprehensive sensitivity analysis shows that in 2030, the FCEVs achieve cost parity with life gasoline vehicles. In the 2030 scenario, the life cycle costs of the FCEV’s powertrain range from $7360 to $22,580, while those for BEVs range from $6460 to $11,420 and FCHEVs from $4310 to $12,540.
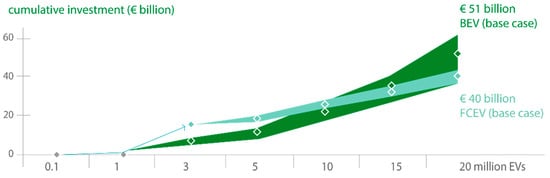
At the moment, it is still unclear how the hydrogen infrastructure will develop, and as regards the greater market penetration, the studies found in the literature have proved insufficient to provide such data or contain non-transparent data. The scenario analysis conducted by Robinius et al.
[7] show that, for low levels of market penetration of a few hundred thousand vehicles, the infrastructure construction costs are substantially the same for both technological paths. It turns out that hydrogen is more expensive during the transition period to electricity-based generation by electrolysis and geological storage, both of which are required to access renewable hydrogen from excess electricity. In the scenario it appears that if vehicle penetration increases to 20 million vehicles in the baseline scenario, a battery charging infrastructure would cost around 51 billion euros, making it more expensive than the 40 billion euros of hydrogen infrastructure (
Figure 2).
Figure 2. Comparison of the investment for the charging/supply infrastructures BEV and FCEV
[7].
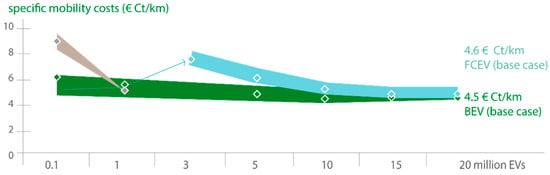
The authors use data on investments in electric vehicle charging and hydrogen refueling infrastructure to estimate the specific cost of mobility in terms of fuel economy. All energy costs and the annualized cost of the infrastructure are considered, leaving out margins and taxes, commissions and the cost of the vehicle. The results show that in the case of very small vehicle fleets, i.e., 0.1 million cars, BEV fuel costs are significantly lower than FCEVs but mobility costs become comparable when the number of vehicles exceeds 10 million (Figure 3).
Figure 3. Comparison of specific mobility costs
[7].
Thus, when there are more cars on the market, investments in the infrastructure of hydrogen refueling currently show better results. However, there are advantages for a scenario with high market penetration, i.e., 15 and 20 million vehicles. Furthermore, the hydrogen infrastructure shows some obvious advantages thanks to the use of its market infrastructure, which is comparable to today’s conventional system. An important aspect to take into consideration is related to the policies adopted by countries to encourage the use of sustainable vehicles in favor of users
[8]. At the moment, the data available on Fuel Cells do not allow us to fully study this technology, as it is still under development and little commercialized. Therefore, in this introductory part we concentrated on the study of real data regarding Electric Vehicles, to understand which policies would be useful to implement in the future, which includes policies on Fuel Cells.
There are several studies in the literature that address this issue. For example, in Denmark, Noel et al.
[9] examined the social costs and benefits of potential deployment configurations of EVs, and reported that differences in the cost of capital of the vehicle, the absence of the availability to pay for EVs and discount rates for users are still obstacles to the spread of EVs in the country. Kumar et al.
[10] used a nomological network to demonstrate the structure of EV adoption. This way, it was possible to have a clear overview of the adoption of EVs through a visual representation as concept maps. From this study, it emerged that the possible future actions for the adoption of EVs include the application of adequate regional and national policies, the improvement of the functionality of the network, financial incentives, the optimization of charging infrastructures, convenience policies, improved performance, reduced range anxiety, improved information sharing, availability of electric vehicle models at dealerships and improved environmental awareness. As for Portugal, Nunes et al.
[11] estimated the impacts of promoting transport policies in favor of the environment based on the market and control on mobility, the environment and the economy. In addition, different series of policies up to 2050 are hypothesized through a “what-if” policy analysis, using the ASTRA-EC model. Yong et al.
[12] used the fuzzy-set qualitative benchmarking methodology, fsQCA (Fuzzy Sets Qualitative Comparative Analysis), to compare the factors that influence the adoption of electric vehicles and to draw political implications to promote the uptake of electric vehicles. It determines the most effective policies in order to promote the spread of EV, taking into account the circumstances of the countries concerned. In this current scenario, it is interesting to observe what the growth trends of this technology have been in the various countries so far. There are studies in the literature that mainly use disaggregated or aggregated sales volumes or modeled sales data to make future predictions
[13]. However, most of these studies, such as Bass and Gompertz
[14], among others, have not used diffusion models to predict the spread of electric vehicles. Martino et al.
[15] ranked four main models of technological forecasting, which can be applied in the automotive context. Similarly, it is possible to use these forecasting models to predict the spread of other technologies, such as Fuel Cell technology (FCEV). Some studies have been conducted in the literature on the rapid expansion of Fuel Cell Vehicles (FCEV) and on the production of hydrogen. Yazdanie et al.
[16] compared the energy demand and greenhouse gas (GHG) emissions for the operation of conventional and alternative vehicles, including light commercial vehicles, in Switzerland. In this research, nine hydrogen production processes were analyzed. Wang et al.
[17] conducted a study on the energy, environmental and economic impacts of FCEV from a life cycle perspective (LCA) to conduct a comprehensive study of the energy, environmental and economic impacts of FCEV from well to wheel. In addition, many studies have compared the energy consumption or greenhouse gas emissions of FCVs with those of other types of vehicles. Elgowainy et al.
[18] carried out cradle-to-grave light vehicle life cycle research, which included both fuel and vehicle cycles, GHG and costing in the United States, including FCEVs.
2. The Early Adopters and the Diffusion of Innovations
In order to understand who will be the “early adopters” of FCEV, this research is based on Everett Rogers’ Innovation Diffusion Model, a theory that illustrates how innovation is adopted and disseminated among members of society, through different channels, over time. The theory in question focuses on the speed with which different individuals, within a social system, adopt an innovation. The different users are, thus, divided into categories (innovators, early adopters, early and late majority and laggards), illustrated in the well-known Rogers curve
[19]. No new technology other than existing solutions will be successfully brought to the market without first being purchased by these early consumers. According to the theory of diffusion of innovations, these users are highly educated, high-income consumers who have a positive attitude towards change. The most recent research on the adoption of alternative fuel vehicles has reported the same trend. Much of the literature studies and real data available concern BEVs and PHEVs, being the technologies currently most widespread on the market. Several research studies on the differences between BEVs and FCEVs show that Fuel Cell Vehicles have significant advantages, such as attracting range anxiety consumers or those who cannot charge a vehicle from home, making this technology attractive to consumers
[20]. Assuming that the first BEV users can be attracted to a more advantageous technology and guide the adoption of FCEV, the research aims to make a forecast of adoption of the FCEV technology. The research uses data on the market introduction of BEV technology to understand the market entry of FCV. Then, after an initial survey on the BEV market in Europe with a focus on Portugal, the researchers investigated who are the first users of these technologies and what has been the spread in the last decade, believing these data to be reliable to make a forecast of the adoption of FCEV technology. This research is used to guide FCEV market entry.
3. Current Scenario of the Electric Mobility in Europe with a Focus on Portugal
The penetration rate of electric vehicles is different in every European country. Recent conclusions from the Leaseplan EV Readiness Index 2020
[21] indicate that the Netherlands, Norway and the UK are currently best prepared for the transition to EVs (
Table 1). This research, focused on the level of preparedness of 22 European countries in view of the revolution introduced by electric vehicles, is based on several factors: registrations of electric vehicles, maturity of the infrastructure for the use of electric vehicles and government incentives. According to the data provided, it can be seen how all the countries considered by the study have in all cases shown an increase in performance compared to the previous year. Across Europe, the registrations of EVs have increased by an average of 60%.
Table 1. LeasePlan’s EV Readiness Index 2020—max. score is 40 points (Source: Leaseplan)
[21].
| Country |
Total Scoring |
EV
Maturity |
Charging Maturity |
CountryGovernment
Incentives |
Lease Plan Orders |
| EV per Inhabitant |
(×1000) |
Scoring EV
per Population |
EV Market Share %
2019 |
Scoring EV Market Share |
| Netherlands |
34 |
11 |
| Austria |
0.98 |
4 | 8 |
7 |
8 |
| 3.35 |
2 |
Norway |
34 |
12 |
9 |
6 |
7 |
| Belgium |
1.10 |
Table 5. The twelve most registered brands in Portugal, first 8 months of 2020
[25].
| Position |
Brand |
2020 |
2019 |
Variation % |
| 1 |
Renault |
11.437 |
21.263 |
−46.20% |
| 4 |
2.88 |
2 |
| 2 |
Peugeot |
10.162 |
UK |
30 |
7 |
| 16.843 |
Czech Republic |
0.08 | 7 |
10 |
6 |
| 1 |
0.43 |
1 |
Ireland |
| −39.70% |
| 3 |
Mercedes-Benz |
9.066 |
11.383 |
−20.40% |
Denmark | 29 |
8 |
5 |
9 |
1.15 | 7 |
| 4 |
3.85 |
2 |
Sweden |
28 |
| Finland |
0.93 | 19 |
5 |
8 |
4 |
5.84 | 5 |
| 3 |
Austria |
27 |
8 |
4 |
10 |
5 |
| France |
0.63 |
2 |
2.57 |
1 |
Luxembourg |
26 |
9 |
6 |
5 |
6 |
| Germany |
0.90 |
4 |
2.72 |
2 |
Finland |
24 |
8 |
6 |
6 |
4 |
| Greece |
0.03 |
1 |
0.37 |
1 |
Germany |
24 |
8 |
5 |
7 |
| 2 |
1.78 |
1 |
| Ireland |
0.86 |
4 |
3.71 |
2 |
| Italy |
0.19 |
2 |
0.80 |
1 |
| Luxembourg |
2.50 |
5 |
3.56 |
2 |
| 2 |
Already in 2009, as part of the electric mobility program in Portugal, an electric mobility network (MOBI-E) was set up. According to the available data,
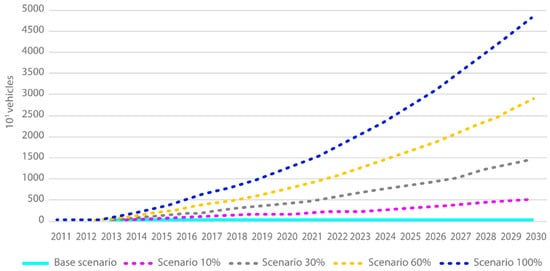
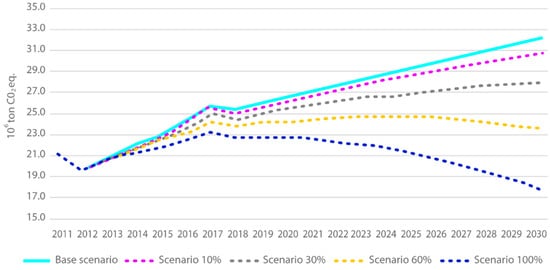
Figure 4 shows that in the country, the electric mobility market has evolved especially in the last 5 years, with an estimated growth of up to 170,000 vehicles by 2030; based on these estimates, the electric car fleet could be large enough to significantly reduce GHG emissions
[23] (
Figure 5). Lisbon is the national territory with the highest concentration of EVs, as it concentrates 23% of registrations of light electric vehicles until June 2018 and 33% of the charging stations installed in the country
[24].
Figure 4. Prediction of the fleet of BEVs, HEVs and PHEVs.
Figure 5. Evaluation of GHG emissions in the scenarios.
Between 2016 and 2017, there was a decline in the share of the diesel market across Europe, which decreased from 49.9% to 44.8% of total passenger car registrations in the EU-15 compared to previous years. Nevertheless, this decline was offset by an increase in sales of petrol cars. Petrol vehicles were the best-selling in the EU-15 in 2018, almost half of the total number of passenger cars. In total, 5.8% of the automotive market in 2017 was represented by alternative propulsion vehicles (APV), while only 1.8% was for electric recharging vehicles (PEV-Plug-in vehicles). During the year the share of diesel sales decreased in almost of Western European countries, especially in Luxembourg and Greece, where there was a loss of more than 10%. The market share of diesel cars, on the other hand, remained stable in Italy and Denmark, with reductions of around 1%. Ireland remains the country with the highest percentage (65.2%), followed by Portugal (61.5%) and Italy (56.3%)
[25] (
Figure 6).
Figure 6. New passenger cars in Portugal by fuel type, 2017, from the European Automobile Manufacturers’ Association (ACEA).
As for 2020, in Portugal, there is a small change of course as BEVs account for 5% of car registrations across the country (compared to 1.8 in 2018). Tesla Model 3 was the most registered electric car in the first eight months (
Table 4). National car registrations fell by only 0.1% in August. Data from the ACAP (Associação Automóvel de Portugal) reveal a growing in the number of registrations of light vehicles in the country, which in July recorded a drop of 17.8%. Between January and August, the national light vehicle market recorded a decline of 42.0%
[26] (
Table 5).
Table 4. Sales ranking of light passenger electric vehicles in Portugal
[25].
| Position |
Brand |
Model |
| 1 |
Tesla |
Model 3 |
| 2 |
Renault |
ZOE |
| 3 |
Nissan |
LEAF |
| 4 |
Peugeot |
208 |
| 4 |
BMW |
6.344 |
9.409 |
−32.60% |
5 |
Hyundai |
Kauai |
| 5 |
Citroën |
5.387 |
10.702 |
−49.70% |
6 |
smart |
Fortwo |
| 6 |
Nissan |
| 4.99 |
7 |
Jaguar |
i-PACE |
| Netherlands |
| 2.21 |
5 |
11.52 |
4 |
| 8 |
BMW |
4 |
| Belgium |
23 |
8 |
5 |
5 |
5 |
| Portugal |
23 |
7 |
4 |
7 |
5 |
| 7.271 |
−31.40% |
| 7 |
SEAT |
4.491 |
7.871 |
−42.90% |
| 8 |
Volkswagen |
4.263 |
7.524 |
−43.30% |
| 9 |
Toyota |
4.232 |
6.805 |
−37.80% |
| 10 |
Ford |
4.106 |
6.424 |
−36.10% |
| 11 |
Fiat |
3.952 |
10.728 |
−63.20% |
Denmark |
22 |
8 |
5 |
4 |
5 |
| France |
22 |
5 |
5 |
7 |
5 |
| Hungary |
22 |
5 |
4 |
8 |
Norway |
11.62 | 5 |
| 5 |
55.64 |
5 |
Switzerland |
21 |
9 |
6 |
2 |
4 |
| Poland |
0.05 |
1 |
0.47 |
1 |
Spain |
20 |
5 |
5 |
6 |
| Portugal | 4 |
| 0.85 |
3 |
5.00 |
2 |
Italy |
| i3 |
Hungary |
0.21 | 17 |
Romania |
0.05 |
1 |
| 9 |
MINI |
5 |
5 |
4 |
3 |
| 0.81 |
1 |
| Cooper SE |
| 12 |
Hyundai |
3.468 |
4.34 |
−20.10% |
Czech Republic |
16 |
4 |
5 |
4 |
3 |
| Slovakia |
0.05 |
1 |
0.35 |
1 |
Greece |
15 |
3 |
2 |
8 |
2 |
| Romania |
| Spain |
0.27 |
2 |
1.29 |
1 |
12 |
4 |
3 |
2 |
3 |
| Poland |
11 |
3 |
2 |
5 |
1 |
| Slovakia |
11 |
3 |
4 |
3 |
1 |
The most mature electric vehicle markets are the Netherlands (nr. 1) and Norway (nr. 2), and thanks to the progress in EV registrations and the growing availability of charging infrastructure, government incentives are steadying. The biggest improvements in the availability of electric vehicles have been achieved by Ireland (up to 6 places) and the UK (up to 5 places) thanks to a more extensive charging infrastructure, a higher number of electric vehicle sales and greater incentives from the government. The number of public charging stations across Europe increased by 73%.
3.1. Portuguese Car Market
Portugal is one of the European countries that has invested most in the creation of incentives for the development of EVs, conceiving purchase subsidies, ensuring benefits for the users of these vehicles, proceeding with the development of infrastructures and creating local incentives
[22]. Looking at Leaseplan data on the maturity of the market and the charging infrastructure that take into account various factors such as population, registrations etc., it is clear that Portugal is still far from the indices of countries such as Norway, Sweden and the Netherlands, which have the three highest indices, but despite this, looking at the total European context, it is positioned in a medium range with respect to all the countries taken into consideration
[21] (
Table 2 and
Table 3).
Table 2. EV market maturity in 2019 (Source: Leaseplan)
[21].
| Sweden |
| 2.72 |
| 5 |
| 11.22 |
| 4 |
| Switzerland |
| 1.31 |
| 4 |
| 4.96 |
| 3 |
| United Kingdom |
0.72 |
3 |
2.58 |
| Country |
Charging Locations per
Inhabits (×1000) 2019 |
Scoring Charging Points
per Population |
Stations per
EV Registered 2019 |
Scoring Charge
Station per EV |
| Austria |
0.47 |
2 |
0.48 |
1 |
| Belgium |
0.51 |
3 |
0.46 |
1 |
| Czech Republic |
0.06 |
1 |
0.74 |
2 |
| Denmark |
0.46 |
2 |
0.40 |
1 |
| Finland |
0.17 |
2 |
0.18 |
1 |
| France |
0.44 |
2 |
0.70 |
2 |
| Germany |
0.39 |
2 |
0.44 |
1 |
| Greece |
0.00 |
0 |
0.15 |
1 |
| Hungary |
0.07 |
1 |
0.33 |
1 |
| Ireland |
0.21 |
2 |
0.25 |
1 |
| Italy |
0.07 |
1 |
0.37 |
1 |
| Luxembourg |
1.55 |
4 |
0.62 |
2 |
| Netherlands |
2.53 |
5 |
1.15 |
2 |
| Norway |
2.33 |
5 |
0.20 |
1 |
| Poland |
0.02 |
0 |
0.44 |
1 |
| Portugal |
0.28 |
2 |
0.33 |
1 |
| Romania |
0.02 |
0 |
0.38 |
1 |
| Slovakia |
0.10 |
1 |
1.95 |
2 |
| Spain |
0.17 |
2 |
0.64 |
2 |
| Sweden |
0.49 |
2 |
0.18 |
1 |
| Switzerland |
0.67 |
3 |
0.51 |
2 |
| United Kingdom |
0.37 |
2 |
0.51 |
2 |
Table 3. Charging infrastructure maturity in 2019 (Source: Leaseplan)
[21].
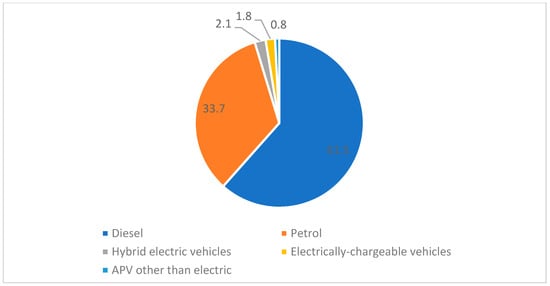
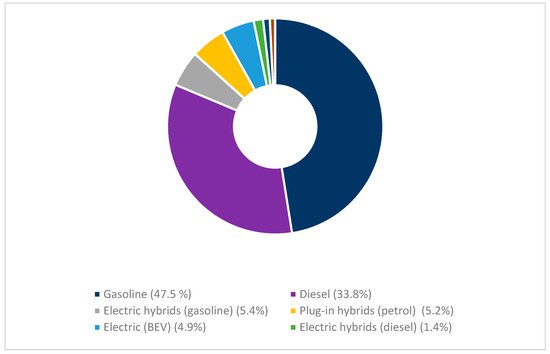
Currently, 100% electric vehicles (BEVs) already represent almost 5% of new national car registrations (4.9%). In 2020, there was an increase in registrations of electric vehicles, reaching registrations of hybrid cars (which in the first months of the year represented 5.4% of total car registrations). Petrol remains dominant, with 47.5% of registrations, followed by diesel with 33.8% of registrations. In August, BEVs accounted for 3.5% of new car registrations in Portugal; 48.2% of new passenger cars registered in the eighth month of the year were petrol-powered units. Diesel is in second place, with 33.9% of new registrations. The podium is, therefore, completed by electrified plug-in hybrid solutions (petrol), with 6.0% of new national car registrations
[27] (
Figure 7).
Figure 7. Vehicle market by type of energy in Portugal, 2020 (Source: ACAP Statistics)
[27].
To get an idea of the distribution of EV in the Portuguese territory, in
Figure 8 the distribution of the number of light electric vehicles (BEVs) is represented according to the registration location of the respective vehicles, up to June 2018
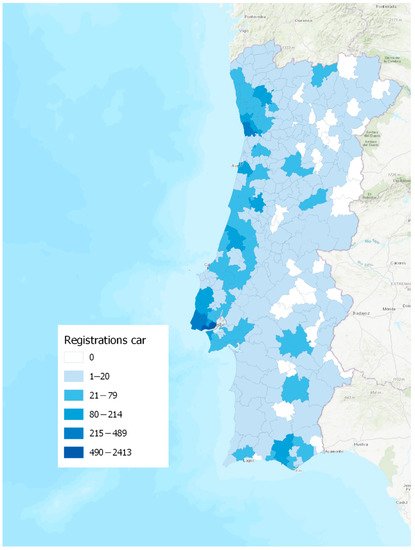
[28]. In total, 9975 BEVs were registered, most of them registered in Lisbon (24%) and Oeiras (14%). There is clearly a greater number of BEVs recorded on the coast of the Portuguese territory (except in the municipalities of the Alentejo Litoral) with some municipalities in more continental regions, namely Viseu, Mangualde, Covilhã, Évora, Beja and Chaves, although together, they represent only 2% of the total number of registered BEVs. Considering the segmentation of the territory of the Portuguese territory based on the percentage of registered BEVs, it appears that 50% of the vehicles are registered in Lisbon, Oeiras, Cascais (5%), Sintra (3%), Porto (3%) and Vila Nova de Gaia (2%). In other words, 50% of BEVs are recorded in only around 1% of the total area of the Portuguese territory.
Figure 8. BEVs registered until June 2018 in Portugal (Map elaborated with QGIS).
3.2. Electric Recharging Points in the Area
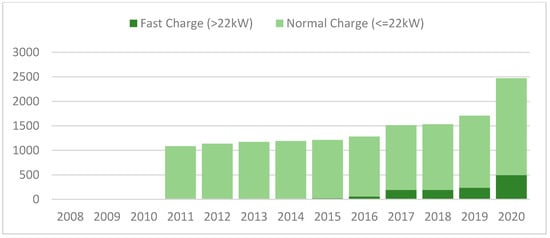
Based on data provided by the European Alternative Fuels Observatory
[29], an evolution of the installation of public charging points in the Portuguese territory can be seen, from 2011 to 2020. As regards the Normal Charge stations (<=22 kW), a rather uniform trend is noted until 2016, which sees between 1100 and 1300 charging points installed, then a slight increase for the following three years to reach 2020, with an increase notable that almost doubled. On the other hand, the numbers of Fast Charge stations (>22 kW) are lower (
Figure 9).
Figure 9. Total number of Normal and Fast public Charging points (2020)
[29].
3.3. EV Policies and Plans in Portugal
To reduce emissions caused by the transport sector, the Portuguese government has introduced regulations aimed at energy efficiency, which are part of the third updated National Action Plan for Energy Efficiency (NEEAP, 2017–2020), drafted according to communication from the European Commission pursuant to Article 24 (2) and Annex XIV of the Energy Efficiency Directive (EED, 2012/27/EU)
[30]. Regarding EVs, several green taxes have been introduced to promote the market introduction of low-carbon EVs and HVs. These, in fact, have a tax differentiation that translates into exemption from total road tax (Imposto Único de Circulação, i.e., IUC), under the environmental component, and exemption from vehicle tax (Imposto sobre Veículos or ISV), while hybrid vehicles pay only 25% of the registration tax; these are currently the main policy instruments influencing the price of new cars in Portugal. Furthermore, the document introduces the Eco-car program, which also incorporates MOBI.E, the electric vehicles program, which provides the upgrading of existing charging infrastructures for EV
[31]. Between 2000 and 2010, to promote the substitution of old vehicles with new ones, the Portuguese government released an automobile scrapping program. Subsequently, this program was replaced in 2014 by the incentive of the scrapping program for end-of-life vehicles (Incentivo ao abate de veículos em fim de vida—VFV) through Law 82-D/2014, also called “The Green Taxation Reform”. The main difference between these two programs is that the latter only covered so-called environmentally friendly cars. The idea was to remove from circulation the vehicles over 10 years old and reward the consumers who buy less polluting cars. More recently, Legislative Decree 42-A/2016 included an incentive of €2250 for the purchase of low-emission vehicles (EV). That incentive was financed by the Environmental Fund. That fund applied the incentive for EV purchase, without the need to return a vehicle older than ten years, and this was valid throughout the year 2017. Portugal currently adopts a variable incentive scheme depending on the buyer: if it is a private individual, the bonus for the purchase of an electric car is €3000. In the case of company purchases, it goes down to €2000 for cars and €3000 for battery-powered vans. In addition, a reduced VAT is applied on the purchase and an exemption from the ownership tax is also offered.