Currently, a variety of sensing methods based on optics, acoustics, and electromagnetics are widely applied for ocean observation and exploration. Acoustic sensing contains various sonar devices for seafloor mapping, submersible navigation, and underwater object. Optical sensing technologies applied to ocean exploration include underwater imaging for objects inspection, spectrophotometry, and fluorophotometry for environmental parameters monitoring. Technologies of electromagnetics are used for underwater metal detection such as mines and mineral resources, and for underwater inspections of cables and pipelines.
- submersible
- sensors
1. Geological Survey
2. Navigation and Communication
Underwater navigation and communication are the key technologies to locate and control submersibles. Due to the high attenuation in seawater, the Global Navigation Satellite System (GNSS) cannot be used underwater [5][45]. For long-term tasks, submersibles must be equipped with high-precision navigation systems. Inertial/dead reckoning (DR), acoustic and geophysical navigation are introduced for underwater navigation. In addition, different technologies are developed for underwater communications. However, there is still no high bandwidth, long-distance, and low power consumption communication solution until now.2.1. Location and Navigation
| Classifications | Principles | Methods | Characteristics |
|---|---|---|---|
| Inertial/dead reckoning | uses accelerometers and gyroscopes to estimate the current state | Magnetic compass, barometer or pressure sensor, DVL, INS | Increasing and unbounded position error |
| Acoustic Navigation | measuring the time of flight (TOF) of signals from acoustic beacons to perform navigate | LBL, UBL, USBL | Depending on beacons |
| Geophysical Navigation | use external environmental information as references for navigation | Magnetic field maps, visual-based seabed images, identify feature acoustically | Depending on sensors to identify environmental features |
2.2. Underwater Communication
3. Essential Ocean Variables
Human activities in coastal areas are increasing because the exploration and exploitation of the ocean are becoming more and more intensive. Most of the pollution in the ocean comes from human activities, including oil spills, garbage dumping, and domestic and industrial wastewater discharge [9][10][72,73]. The ocean has a vast area, so the source of pollution can be anywhere in any country, which makes it challenging to prevent. In addition, once the ocean is polluted, it will spread globally through ocean currents. Ocean has a considerable influence on the global climate and ecosystem. Although the ocean has a robust self-healing ecosystem, it takes a long time to recover. Therefore, it is vital to have overwhelming monitoring of the ocean environmental conditions, significantly how human activities impact the marine ecosystem. The Global Ocean Observing System (GOOS) has listed many ocean research and assessment variables, called essential ocean variables (EOVs) [11][74]. They are divided into four classes, physics, biochemistry, biology, and ecosystems, and cross-disciplinary. Most commercially used sensors can cover EOVs in physics and biochemistry.3.1. CTD—Conductivity, Temperature and Depth
CTD is an instrument applied to measure conductivity, temperature, and depth in the ocean, playing an essential role in submersible navigation and environmental monitoring. Among them, the measurement of salinity, namely conductivity, is the most complex. As early as 1901, Knudsen discovered that seawater salinity could be calculated using electrical conductivity, but it was not until the 1950s that people began to put this method into practice [12][75]. The first multifunctional salinity sensing instrument, salinity-temperature-depth (STD), was developed [13][76]. Three years later, to fix the fouling problem when used in seawater, an inductive cell was added to STD [14][77]. In the following decades, digitalization and microprocessor were added into the development of sensing instruments gradually, which solved salinity ’spiking’ issues caused by a mismatch of sensor response time between temperature and conductivity [15][78]. After that, the practical salinity scale was proposed, which leads to the generalization and standardization of the measurement [16][17][79,80]. In the following 30 years, the practical salinity scale of 1978 (PSS-78) [18][81] has made significant contributions to the research of the oceans. The most classic CTD of Seabird should be the SBE-41 series CTDs, which is designed for the Argo program to profiling 2000 m underwater. Over 15,000 SBE-41 CTDs have been equipped on Argo floats, which validated the stability of these products. In 2010, TEOS-10 was introduced and gradually replaced the practical salinity scale (EOS-80), which has also been accepted by various organizations worldwide [19][82]. This new standard calculates the properties of seawater by constructing a Gibbs function for seawater [20][83]. It considers the composition of seawater, its spatial distribution, and the influence of the central material on the density of seawater, which will significantly advance the development of marine science and related interdisciplinary disciplines. The temperature sensor used in CTD is usually a platinum thermistor because of its high accuracy and broader range. The depth measurement is still obtained by converting the pressure measurement. Their advantages and disadvantages of pressure sensors based on piezoresistive, capacitive, and resonant technologies are compared in Table 23.| Pressure Sensors | Advantages | Disadvantages |
|---|---|---|
| Piezoresistive | simple structure, small size, high precision | low robustness |
| Capacitive | simple structure, high precision, high robustness | large non-linear error |
| Resonant | stable construction, high precision, high stability | complex manufacturing and high cost |
3.2. Turbidity
3.3. Dissolved Oxygen
Dissolved oxygen (DO) refers to the molecular state of oxygen dissolved in water [22][85]. It can get continuous replenishment mainly by the dissolution of oxygen from the air and the photosynthesis of plants in the water. If seawater is polluted by organic matter, oxygen in the water will be seriously consumed. Moreover, when dissolved oxygen is not timely replenished, anaerobic bacteria in the water will get rapid reproduction, which leads to the corruption of organic matter and makes the water body more polluted and smelly. Therefore, the amount of dissolved oxygen in water is an indicator of the self-purification ability of the water. The commonly used methods for measuring DO include the Winkler method, electrochemical method, and optical method [23][24][86,87]. Winkler’s method uses chemical reaction for measurement, which is highly accurate but cumbersome and cannot be measured in-situ. The electrochemical method is based on the current generated by the redox reaction at the electrode to determine the measurement, the measurement efficiency is high, but the reaction electrode is accessible to age, which needs regular maintenance and replacement [24][87]. The optical method overcomes these disadvantages and is more durable but also more expensive.
4. Underwater Inspections
4.1. Underwater Detection
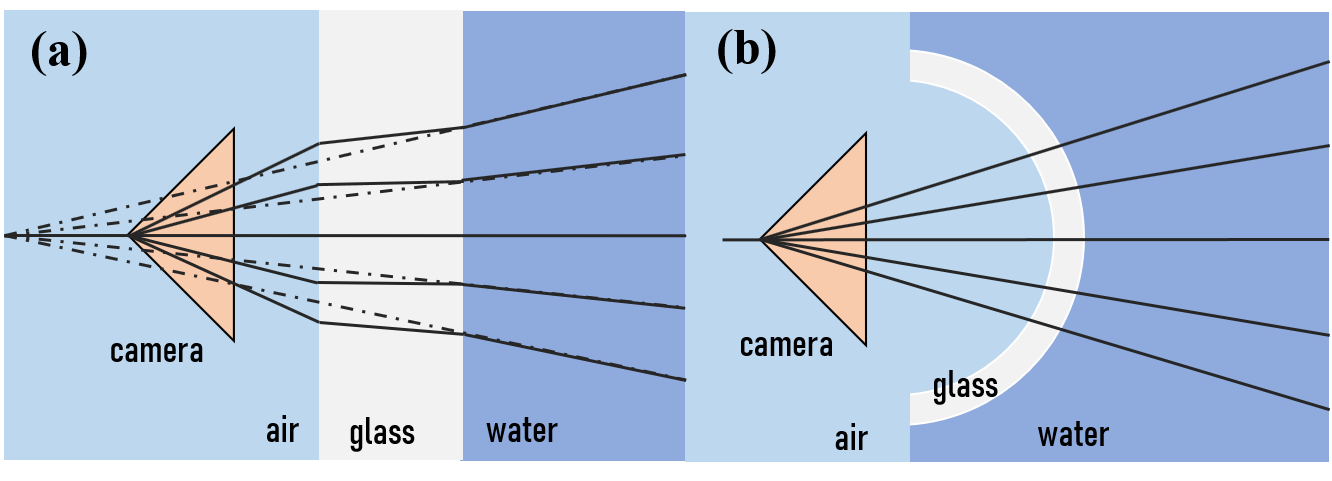
Usually, cultural heritages and wrecks are well preserved in low oxygen conditions underwater. However, human activities, including fishing nets, marine geohazards, and seabed geological change, can lead to damages to these monuments [27][28][128,129]. In order to help archaeologists better investigate and protect historical sites, it is necessary to do the surveys more efficiently. Currently, commonly used underwater archaeological surveys include visual methods and sonar images, which are used for object detection. In addition, in maritime security, underwater object detection technology is also used to identify moving intruders and ocean mines. Due to the absorptive and scattering characteristic of seawater, there are many challenges for underwater imaging [130]. As shown in Figure 8, absorption of visible light is better [29]than other wavelengths, especially green and blue light, which can travel hundreds of meters before being completely absorbed by water. In addition, light can further attenuate due to the suspended particulate matter, and substances in water [30][131]. For the vision system, light needs to travel in three different media (water, viewports, air) as shown in Figure 13. Transparent viewport housing is often made from transparent glass or acrylic, made in a domed shape. As Figure 13 shows, the refraction provokes a pin-cushion distortion, which makes that the most significant reconstruction errors appear at the edges of the target [31][32][132,133]. Domed shape viewport housing is designed to eliminate the problem, as Figure 13 shows. Furthermore, an image processing algorithm is another way to calibrate the system.