The CHYR (CHY ZINC-FINGER AND RING FINGER PROTEIN) proteins have been functionally characterized in iron regulation and stress response in Arabidopsis, rice and Populus. In soybean, 16 CHYR genes with conserved Zinc_ribbon, CHY zinc finger and Ring finger domains were obtained and divided into three groups. Moreover, additional 2–3 hemerythrin domains could be found in the N terminus of Group III. Phylogenetic and homology analysis of CHYRs in green plants indicated that three groups might originate from different ancestors. Expectedly, GmCHYR genes shared similar conserved domains/motifs distribution within the same group. Gene expression analysis uncovered their special expression patterns in different soybean tissues/organs and under various abiotic stresses. Group I and II members were mainly involved in salt and alkaline stresses. The expression of Group III members was induced/repressed by dehydration, salt and alkaline stresses, indicating their diverse roles in response to abiotic stress.
- CHYR
- soybean
- genome-wide identification
- expression analysis
- abiotic stress
1. Introduction
2. Identification and Phylogenetic Analysis of CHYR Genes from Soybean and Arabidopsis
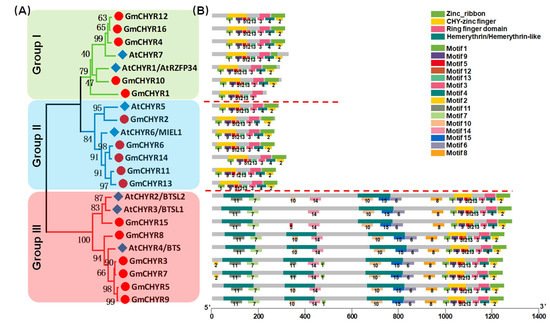
To identify soybean CHYR genes, protein sequences of published Arabidopsis CHYRs [8,9,11,12,19][8][9][11][12][19] were used to construct a Hidden Markov Model (HMM) [20]. Whole soybean and Arabidopsis protein sequences were downloaded from Phytozome to carry out the local search. Finally, 16 soybean and 7 Arabidopsis CHYR genes were identified. The 23 proteins were proven to contain at least three conserved domains, including CHY zinc-finger (PF05495), C3H2C3-type ring finger (PF13639), and zinc ribbon domain (PF14599) according to Pfam and SMART analysis. For convenience’s sake, soybean CHYR genes were renamed GmCHYR1 to GmCHYR16 based on their order on the chromosomes, and genes from Arabidopsis were relabeled as AtCHYR1 to AtCHYR7. Their involved information (including sequence length, hydropathicity, predicted protein location, classification, alternative name, and functions) were listed in Table S1. As we could see from Table S1, amino acid numbers of GmCHYRs and AtCHYRs ranged from 234 to 1262. Their grand average of hydropathicity was all negative, indicating that GmCHYRs and AtCHYRs are hydrophilic proteins. Furthermore, these CHYR proteins were predicted to localize in the cytoplasm, or nucleus, or chloroplast. The cytoplasm and nucleus distribution of AtCHYR6/MIEL1 in Arabidopsis cells could support this result [8]. To further investigate the phylogenetic relationship of GmCHYRs, their protein sequences were aligned with 7 AtCHYRs. All 23 CHYR proteins contained conserved CHY zinc-finger (PF05495), C3H2C3-type ring finger (PF13639), and zinc ribbon 6 domain (PF14599) (Figure S1). Then, a phylogenetic tree was generated based on this multiple alignment by using MEGA 7.0 with the Maximum-Likelihood (ML) method with 1000 bootstrap replications. As shown in Figure 1A, soybean and Arabidopsis CHYRs could be classified into three groups according to their topological analysis and bootstrap values. In detail, both Group I and Group II consisted of 5 GmCHYRs and 2 AtCHYRs. The rest, 6 GmCHYRs and 3 AtCHYRs were allocated to Group III.
3. Identification and Classification of CHYR Members in Green Plants
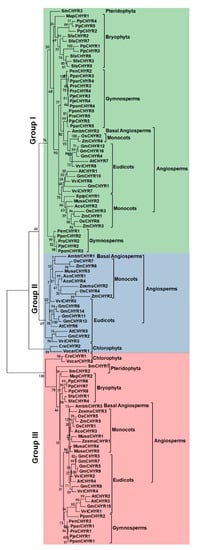
The above results showed that only Group III members contained 2–3 additional hemerythrin domains in the N terminus, which are of great importance in regulating iron homeostasis. We wondered whether Group III CHYR proteins gained these hemerythrin domains during evolution, or Group I and II lost these domains. Therefore, the local proteome sequences of 21 representative plant species, including Dicots, Monocots, Basal Angiosperms, Pteridophyta, Bryophyta, Chlorophyta, and Gymnosperm were searched to identify potential CHYR genes by using the former Arabidopsis HMM. At last, a total of 107 nonredundant sequences were obtained from 21 detected plant species (Table 1 and Table S2). Pfam and SMART were further used to detect the three conserved domains for CHYR proteins, including the CHY zinc-finger domain, C3H2C3-type ring finger domain, and zinc ribbon domain.| Major Lineage | Species | Group I | Group II | Group III |
|---|---|---|---|---|
| Dicots | Vitis vinifera | 3 | 2 | 3 |
| Arabidopsis thaliana | 2 | 2 | 3 | |
| Glycine max | 5 | 5 | 6 | |
| Monocots | Zea mays | 3 | 2 | 1 |
| Oryza sativa | 3 | 2 | 2 | |
| Ananas comosus | 1 | 2 | 1 | |
| Musa acuminata | 1 | 1 | 3 | |
| Spirodela polyrhiza | 1 | 0 | 0 | |
| Zostera marina | 0 | 1 | 2 | |
| Basal angiosperms | Amborella trichopoda | 1 | 1 | 1 |
| Gymnosperm | Pinus parviflora | 4 | 0 | 1 |
| Pinus radiata | 4 | 0 | 1 | |
| Pinus jeffreyi | 4 | 0 | 1 | |
| Pinus ponderosa | 4 | 0 | 1 | |
| Picea engelmanii | 3 | 0 | 0 | |
| Pteridophyta | Selaginella moellendorffii | 1 | 0 | 2 |
| Bryophyta | Marchantia polymorpha | 1 | 0 | 1 |
| Physcomitrella patens | 5 | 0 | 3 | |
| Sphagnum fallax | 5 | 0 | 2 | |
| Chlorophyta | Chlamydomonas reinhardtii | 0 | 1 | 1 |
| Volvox carteri | 0 | 1 | 1 |

4. Homology Analysis of CHYR Genes from Soybean and Arabidopsis

5. Expression Pattern of Soybean CHYR Genes in Different Tissues and Organs
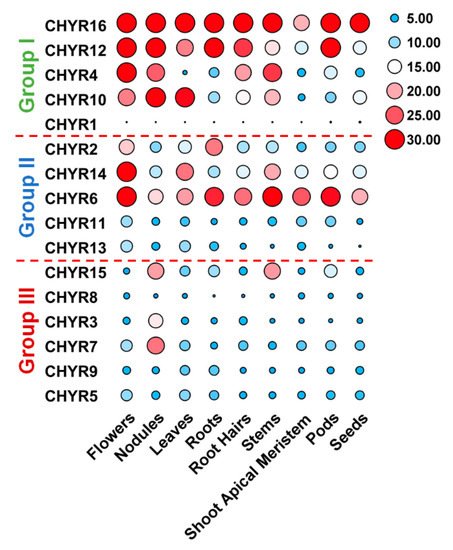
To further look into GmCHYRs roles in soybean development, their expression profiles were analyzed based on published data of nine tissues/organs collected in Phytozome, including flowers, nodules, leaves, roots, roots hairs, stems, shoot apical meristem, pods, and seeds [26]. As Figure 4 depicted, except that GmCHYR1 showed almost no expression, the rest 15 GmCHYRs displayed specific expression across nine detected tissues/organs. Compared with Group III, Group I and II members were more likely to be expressed in all detected tissues/organs and had much higher expression values. This suggested their potential roles in soybean growth and development. Group II genes showed relatively higher expression in the flowers, suggestive of their roles in reproduction. In particular, paralogous genes GmCHYR6 and GmCHYR14 were all highly expressed in nine detected tissues/organs. However, Group III members preferred to be expressed in nodules, indicating their roles in nitrogen fixation. In general, paralogous genes GmCHYR4/12/16, GmCHYR6/11/13/14, and GmCHYR3/7 shared similar expression patterns. GmCHYR5/8/9 were also paralogs of GmCHYR3/7, but they displayed opposite expression from GmCHYR3/7. This might result from some special regulatory elements, or modification in their promoters, or just functional segregation during evolution.
References
- Dallas, D.C.; Sanctuary, M.R.; Qu, Y.; Khajavi, S.H.; Van Zandt, A.E.; Dyandra, M.; Frese, S.A.; Barile, D.; German, J.B. Personalizing Protein Nourishment. Crit. Rev. Food Sci. Nutr. 2017, 57, 3313–3331.
- Li, M.-W.; Xin, D.; Gao, Y.; Li, K.-P.; Fan, K.; Muñoz, N.B.; Yung, W.-S.; Lam, H.-M. Using Genomic Information to Improve Soybean Adaptability to Climate Change. J. Exp. Bot. 2016.
- Leng, G.; Hall, J. Crop Yield Sensitivity of Global Major Agricultural Countries to Droughts and the Projected Changes in the Future. Sci. Total. Environ. 2018, 654, 811–821.
- Lesk, C.; Rowhani, P.; Ramankutty, N. Influence of Extreme Weather Disasters on Global Crop Production. Nature 2016, 529, 84–87.
- Hassani, A.; Azapagic, A.; Shokri, N. Predicting Long-Term Dynamics of Soil Salinity and Sodicity on a Global Scale. Proc. Natl. Acad. Sci. USA 2020, 117, 33017–33027.
- Smalle, J.; Vierstra, R.D. The Ubiquitin 26s Proteasome Proteolytic Pathway. Annu. Rev. Plant Biol. 2004, 55, 555–590.
- Sadanandom, A.; Bailey, M.; Ewan, R.; Lee, J.; Nelis, S. The Ubiquitin–Proteasome System: Central Modifier of Plant Signalling. New Phytol. 2012, 196, 13–28.
- Marino, D.; Froidure, S.; Canonne, J.; Ben Khaled, S.; Khafif, M.; Pouzet, C.; Jauneau, A.; Roby, D.; Rivas, S. Arabidopsis Ubiquitin Ligase MIEL1 Mediates Degradation of the Transcription Factor MYB30 Weakening Plant Defence. Nat. Commun. 2013, 4, 1476.
- Ding, S.; Zhang, B.; Qin, F. Arabidopsis RZFP34/CHYR1, a Ubiquitin E3 Ligase, Regulates Stomatal Movement and Drought Tolerance via SnRK2.6-Mediated Phosphorylation. Plant Cell 2015, 27, 3228–3244.
- Hsu, K.-H.; Liu, C.-C.; Wu, S.-J.; Kuo, Y.-Y.; Lu, C.-A.; Wu, C.-R.; Lian, P.-J.; Hong, C.-Y.; Ke, Y.-T.; Huang, J.-H.; et al. Expression of a Gene Encoding a Rice RING Zinc-Finger Protein, OsRZFP34, Enhances Stomata Opening. Plant Mol. Biol. 2014, 86, 125–137.
- Rodríguez-Celma, J.; Connorton, J.M.; Kruse, I.; Green, R.T.; Franceschetti, M.; Chen, Y.-T.; Cui, Y.; Ling, H.-Q.; Yeh, K.-C.; Balk, J. Arabidopsis BRUTUS-LIKE E3 Ligases Negatively Regulate Iron Uptake by Targeting Transcription Factor FIT for Recycling. Proc. Natl. Acad. Sci. USA 2019, 116, 17584–17591.
- Hindt, M.N.; Akmakjian, G.Z.; Pivarski, K.L.; Punshon, T.; Baxter, I.; Salt, D.E.; Guerinot, M.L. BRUTUS and its Paralogs, BTS LIKE1 and BTS LIKE2, encode Important Negative Regulators of the Iron Deficiency Response in Arabidopsis thaliana. Metallomics 2017, 9, 876–890.
- Matthiadis, A.; Long, T.A. Further Insight into BRUTUS Domain Composition and Functionality. Plant Signal. Behav. 2016, 11, e1204508.
- Kobayashi, T.; Ozu, A.; Kobayashi, S.; An, G.; Jeon, J.-S.; Nishizawa, N.K. OsbHLH058 and OsbHLH059 Transcription Factors Positively regulate Iron Deficiency Responses in Rice. Plant Mol. Biol. 2019, 101, 471–486.
- Lee, H.G.; Kim, J.; Suh, M.C.; Seo, P.J. The MIEL1 E3 Ubiquitin Ligase Negatively Regulates Cuticular Wax Biosynthesis in Arabidopsis Stems. Plant Cell Physiol. 2017, 58, 2040.
- Lee, H.G.; Seo, P.J. The Arabidopsis MIEL1 E3 Ligase Negatively regulates ABA signalling by Promoting Protein Turnover of MYB96. Nat. Commun. 2016, 7, 12525.
- He, F.; Wang, H.-L.; Li, H.-G.; Su, Y.; Li, S.; Yang, Y.; Feng, C.-H.; Yin, W.; Xia, X. PeCHYR1, a Ubiquitin E3 Ligase from Populus euphratica, enhances Drought Tolerance via ABA-Induced Stomatal Closure by ROS Production in Populus. Plant Biotechnol. J. 2018, 16, 1514–1528.
- Rodríguez-Celma, J.; Chou, H.; Kobayashi, T.; Long, T.; Balk, J. Hemerythrin E3 Ubiquitin Ligases as Negative Regulators of Iron Homeostasis in Plants. Front. Plant Sci. 2019, 10, 98.
- Li, W.; Lan, P. Genome-Wide Analysis of Overlapping Genes Regulated by Iron Deficiency and Phosphate Starvation reveals New Interactions in Arabidopsis Roots. BMC Res. Notes 2015, 8, 555.
- Potter, S.C.; Luciani, A.; Eddy, S.R.; Park, Y.M.; López, R.; Finn, R.D. HMMER Web Server: 2018 Update. Nucleic Acids Res. 2018, 46, W200–W204.
- Urzica, E.; Casero, D.; Yamasaki, H.; Hsieh, S.I.; Adler, L.N.; Karpowicz, S.J.; Blaby, C.; Clarke, S.G.; Loo, J.A.; Pellegrini, M.; et al. Systems and Trans-System Level Analysis Identifies Conserved Iron Deficiency Responses in the Plant Lineage. Plant Cell 2012, 24, 3921–3948.
- Moore, R.C.; Purugganan, M.D. The Early Stages of Duplicate Gene Evolution. Proc. Natl. Acad. Sci. USA 2003, 100, 15682–15687.
- Zhou, F.; Guo, Y.; Qiu, L.-J. Genome-Wide Identification and Evolutionary Analysis of Leucine-Rich Repeat Receptor-Like Protein Kinase Genes in Soybean. BMC Plant Biol. 2016, 16, 58.
- Xu, L.; Dong, Z.; Fang, L.; Luo, Y.; Wei, Z.; Guo, H.; Zhang, G.; Gu, Y.Q.; Coleman-Derr, D.; Xia, Q.; et al. OrthoVenn2: A Web Server for Whole-Genome Comparison and Annotation of Orthologous Clusters Across Multiple Species. Nucleic Acids Res. 2019, 47, W52–W58.
- Kreplak, J.; Madoui, M.-A.; Cápal, P.; Novák, P.; Labadie, K.; Aubert, G.; Bayer, P.E.; Gali, K.K.; Syme, R.A.; Main, D.; et al. A Reference Genome for Pea Provides Insight into Legume Genome Evolution. Nat. Genet. 2019, 51, 1411–1422.
- Goodstein, D.M.; Shu, S.; Howson, R.; Neupane, R.; Hayes, R.; Fazo, J.; Mitros, T.; Dirks, W.; Hellsten, U.; Putnam, N.; et al. Phytozome: A Comparative Platform for Green Plant Genomics. Nucleic Acids Res. 2011, 40, D1178–D1186.
