Ammonia nitrogen is the major oxygen-consuming pollutant in aquatic environments. Exposure to ammonia nitrogen in the aquatic environment can lead to bioaccumulation in fish, and the ammonia nitrogen concentration is the main determinant of accumulation. In most aquatic environments, fish are at the top of the food chain and are most vulnerable to the toxic effects of high levels of ammonia nitrogen exposure. In fish exposed to toxicants, ammonia-induced toxicity is mainly caused by bioaccumulation in certain tissues. Ammonia nitrogen absorbed in the fish enters the circulatory system and affects hematological properties. Ammonia nitrogen also breaks balance in antioxidant capacity and causes oxidative damage. In addition, ammonia nitrogen affects the immune response and causes neurotoxicity because of the physical and chemical toxicity.
1. Introduction
Ammonia nitrogen is the final product of protein catabolism and metabolism. In farming water, ammonia nitrogen is mainly derived from the decomposition process of organic matter. It is the most common environmental limiting factor in aquaculture
[1]. The ammonia concentration in naturally occurring water is approximately 0–0.2 mg/L, which is at a low level. However, with the development of culturing systems, the excessive concentration of ammonia nitrogen in farmed water has become a common environmental problem. Ammonia has the greatest impact on the physiological function of aquatic organisms. Ammonia can accumulate quickly and reach toxic concentrations
[2]. There are two main reasons for the growth of the mass concentration of ammonia nitrogen in farming water: one is the decomposition of organic matter containing nitrogen such as feed residues and aquatic animal excreta
[3]. High-density farming increases the burden of these substances, resulting in the accumulation of ammonia nitrogen. The second is industrial wastewater, domestic sewage discharge, etc. In various regions of fertilization of pesticides agriculture, the massive use of nitrogen fertilizers, mainly ammonium chloride and urea, entering the farming water with the washout of rainwater and surface runoff
[4].
Ammonia nitrogen is the sum of ammonia present in water in two forms of ionized (NH
4+) and non-ionic ammonia (NH
3), which is also called total ammonia (TAN)
[5]. The equilibrium reaction equation of both is
Ammonia nitrogen is the main product of fish metabolism, and most fish are sensitive to ammonia
[6]. The increase of non-ionic ammonia in the water environment will inhibit the excretion of ammonia nitrogen in the fish and increase the concentration of ammonia in their blood and tissues, making the blood less capable of carrying oxygen and disrupting normal metabolism. Non-ionic ammonia is the main toxic form of physiological stress in fish and is about 300 to 400 times more toxic than ionized ammonia
[4]. Non-ionic ammonia has good lipid solubility and carries no electric charge, making it more easily fuse with the phospholipid bilayer on the cell membrane, thus diffusing through the cell membrane to the hemolymph and increasing the concentration of ammonia nitrogen in fish, producing toxic effects
[7]. Furthermore, non-ionic ammonia has good lipid solubility. It can easily diffuse into fish through cell membranes, causing damage to important organs, including gill tissue, resulting in respiratory difficulties and reduced feeding rate of fish, and inhibiting their growth and development
[8]. The non-ionic ammonia which enters the fish directly affects the metabolism of enzymes, causing disorders of enzyme metabolism and reducing immunity, stimulating a series of toxic reactions in fish, such as excitement and convulsions until they die of exhaustion
[9][10][9,10].
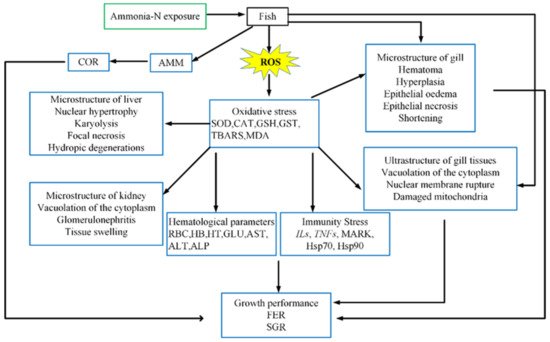
We comprehensively analyzed the main toxicological characteristics and physiological reaction processes of fish after exposure to ammonia (Figure 1). The toxicity of ammonia nitrogen is manifold, and therefore it is necessary to conduct an overall research and analysis to confirm the adverse effects of ammonia nitrogen on fish. Thus, the aim of this review was to summarize changes in ammonia accumulation patterns, oxidative stress, neurotoxicity and changes in immunological reactions in fish following exposure to ammonia nitrogen.
Figure 1. Toxicological characteristics and physiological response process for fish exposed to ammonia
[11]. AMM: ammonia; COR: cortisol; SOD: superoxide dismutase; CAT: catalase; GSH: glutathione; GST: Glutathione S-transferase; TBARS: Thiobarbituric reactive substances; MDA: malon dialdehyde; RBC: red blood cell count; Hb: hemoglobin; Ht: hematocrit; GLU: glucose; AST: aspartate transaminase; ALT: alanine transaminase; ALP: alkaline phosphatase;
Ils: interleukins;
TNFs: tumor necrosis factors; FER: feed efficiency ratio; SGR: specific growth—Reprinted from Ref.
[11].
2. Bioaccumulation
The toxicity of ammonia to fish mostly results from bioaccumulation as well as excretion, metabolism and detoxification mechanisms caused by ammonia nitrogen uptake
[12]. In water, ammonia is present as non-ionic ammonia (NH
3) and ionized ammonium (NH
4+), the latter accounting for a large proportion at normal water pH
[3]. Most biofilms are not permeable to ammonium ions but are permeable to ammonia. Thus, the ammonia toxicity is owing to its non-ionic form (NH
3), which can easily spread through gill membranes
[13]. Furthermore, provided there is an outward gradient, the ammonia can be discharged into water as NH
3 through gills, and this process is aided by Rhesus (Rh) glycoproteins
[14]. However, under high ambient ammonia (HEA), the external ammonia flux through gills is decreased and the inverse internal flux of ammonia occurs. Therefore, ammonia levels in blood and tissues increased and acute and chronic toxic reactions were observed in fish
[15][16][15,16].
Ammonia toxicity to fish has been demonstrated to follow a multifactorial pathogenesis. It is generally considered that NH
3 enters the organism through the gills, epidermis, and intestinal mucosa of fish, which increases the blood pH and reduces oxygen carrying capacity of blood. Long-term exposure to ammonia also damages gill tissue, leading to gill tissue congestion, gill lamellae bending and adhesion, affecting gill gas exchange, inhibiting the respiratory function of the organism, leading to fish hypoxia and even death
[7]. After ammonia diffuses into the tissues, the ammonia level increases
[17], damaging the liver and kidney system, resulting in congestion, edema, liver coma and even death
[18].
Ammonia can also damage the central nervous system of fish. Initially, researchers believed that mechanisms of ammonia poisoning of fish were similar to those of hepatic encephalopathy in mammals
[19]. This is because high levels of non-ionic ammonia (NH
3) in the brain synthesize high amounts of glutamine (Gln) catalyzed by glutamine synthetase, swelling neuroglia and activating the N-methyl-D-aspartate (NMDA) receptor
[20]. Under normal conditions, the organism produces Gln mainly from glutamate (Glu) and NH
4+ to remove excess NH
4+ from the brain. Therefore, increased concentration of NH
4+ in the brain is often accompanied by an increase in the level of Gln. While the excessive increase in Gln intracellularly leads to astrocyte swelling
[21], triggering brain edema and promoting the release of Glu into the intercellular, causing intracranial hypertension and death
[22]. In addition, NH
4+ also causes depolarization of the neuronal surface. Both Glu and depolarized neurons accumulated intercellularly can activate NMDA receptors located on the neuronal surface. Excessive activation of this receptor promotes NO synthesis and activates Na
+/K
+-ATPase
[23][24][23,24]. Activation of Na
+/K
+-ATPase accelerates energy depletion in the brain. The excessive amount of NO not only increased the oxidative stress in the organism, but also tends to produce extremely toxic hydrogen peroxide, which impairs the mitochondrial respiration, initiates ATP exhaustion and results in cell death
[25][26][25,26]. This assumption has been accepted by most scholars for a long time. In the early 21st century, several studies confirmed that some fish, such as
Cyprinus and mudskipper, accumulate glutamine after ammonia stress at concentrations much greater than those that constitute lethal concentrations in mammals
[27][28][27,28]. The histological data suggested that the skull of fish has more cranial space than mammals and they can bear more cranial pressure
[11]. Therefore, fish may have different defense mechanisms to ammonia toxicity than mammals.
Nevertheless, physical stress responses (or pathological processes) could be triggered by the production of metabolites in adaptive regulation, for example, the oxidative damage and inflammatory hyperinflammation, which could be the real reason for fish death
[29]. Likewise, Hegazi et al. indicated that ammonia nitrogen stress triggers the formation of reactive oxygen species, which are also mediators of ammonia toxicity
[30]. In recent years, with the continuous innovation of research methods in aquatic animals, new evidence suggests that ammonia toxicity in fish is associated with the over inflammatory response of the organism
[31][32][31,32]. The exact mechanisms of ammonia toxicity to fish need to be further examined.
3. Hematological Parameters
The inflow of toxic materials to the water environment affects water parameters and leads to alterations in the fish hematological profile
[33][34][33,34]. Toxic exposure can adversely affect the blood oxygen carrying capacity and the blood electrolyte balance, especially ammonia exposure can induce the accumulation of ammonia in fish circulatory system. As ammonia has high affinity for blood hemoglobin, it displaces oxygen and influences some hematological properties
[35]. Hematological properties are significant indicators to assess fish health status after exposed to different environmental stresses and chemical toxicity
[36][37][38][39][36,37,38,39]. Ammonia enters the fish circulatory system and causes metabolic disturbances and fatal responses, such as oxidative stress, immune response and genetic expression
[40]. Exposure to ammonia also affects the fish circulatory system, particularly hematological indexes such as red blood cell count (RBC), hematocrit (Ht) and hemoglobin (Hb)
[32]. In general, exposure to toxic substances decreases hematological properties like RBC, Ht and Hb owing to the hemolysis and red blood cells destruction and may cause anemia
[41]. Praveena et al. suggested that the decrease in RBC and the concentration of hemoglobin resulting from toxicity exposure might be attributed to the destructive effects of toxicity, but the decrease in the concentration of hemoglobin resulted in a potential impairment of tissue function because of the inadequate oxygen supply to the tissues
[42]. Gao et al. observed significant declines in Hb content, Ht and blood RBC counts after exposure to high concentrations of ammonia in
Takifugu rubripes, suggesting that the fish was anemic by exposure to ammonia
[40]. Hoseini et al. revealed that the increase in radicals exposed to ammonia could lead to attack on RBCs, leading to their destruction
[43]. Researches have revealed that the ammonia toxicity induces the inhibition of hematopoiesis by destroying the production sites of red blood cells
[44]. The onset of anemia symptoms may be due to destruction of red blood cells or injury to hematopoietic tissues after exposure to ammonia. Serum proteins are considered to be reliable indicators of fish immune status and health
[45]. David et al. attributed the decreased protein content in the toxically exposed fish to the disruption or collapse of cell functions and the concomitant impairment of protein synthetic mechanisms
[46]. Asthana et al. reported that high concentration of ammonia resulted in the deamination of proteins and increased the degradation of proteins
[47]. Ammonia exposure induced a reduction in hematological properties like RBC, Ht and Hb in fish, which is considered to account for the stress-induced decline in Hb content and Hb synthesis rate. Thus, it may exert a toxic effect by inducing disturbances in tissue oxygenation.
Ammonia absorbed in fish diffuses through cell membranes into the blood system and causes accumulation. Therefore, hematological parameters usually act as sensitive indicators to evaluate the toxicity of ammonia to fish
[48]. The effects of ammonia on fish hematological parameters are shown in
Table 1, regarding the route of exposure (freshwater, seawater, waterborne exposure). The decrease in hematological properties induced by ammonia exposure is manifested by disruption of RBC and alteration of the small or large red blood cell anemic state. Das et al. reported changes in blood characteristics (such as RBCs and hemoglobin) of
Cirrhinus mrigala after exposure to ammonia
[49]. This phenomenon causes tissue damage due to ammonia toxicity and hemodilution after hemolysis. Iheanacho et al. showed that changes in RBC content, hematocrit values and hemoglobin concentration reflected the fish defensive mechanisms against stress induced by exposure to environmental toxicity
[50]. Kim et al. revealed that the ammonia exposure greatly decreased the levels of hematocrit and hemoglobin in juvenile hybrid grouper
[48]. These authors considered that fish tissues might be under hypoxic conditions because of ammonia exposure and may result in the inhibition and depletion of hematopoietic potential under that condition.
Table 1. Hematological parameters in fish exposed to ammonia.
| Exposure Route |
Exposure Type |
Fish Specie |
Ammonia
Concentration |
Exposure Time |
Response
Concentration |
Response * |
Reference |
| RBC (Billion/mL) |
| Sea water |
Waterborne
exposure |
Takifugu rubripes |
5, 50, 100, 150 mg/L |
24, 48, 96 h |
100, 150 mg/L |
− |
Gao et al. [40] 2021 |
| Freshwater |
66][81]. 2021 Jun-Hwan Kim, Young-Bin Yu, Jae-Ho Choi.
Table 2 shows the responses of antioxidant enzymes in fish exposed to ammonia. The oxidative stress in fish exposed to ammonia stress is indicated by changes in the production of ROS in fish. One of the main defense strategies to reduce ROS production is by raising the activity of antioxidant enzymes, including superoxide dismutase (SOD), catalase (CAT), and glutathione (GSH)
[35][65][67][68][69][70][35,65,66,67,68,69]. Antioxidant enzymes are widely present in tissues and are most abundant in hepatocytes
[71][72][70,71]. Under stress, fish can protect the structure and function of cell membranes from peroxides by converting O
2− to H
2O
2 through SOD, GSH and CAT and by breaking down cytotoxic H
2O
2 into oxygen and water
[73][72].
Table 2. Antioxidant enzyme responses such as SOD, CAT and GST in fish exposed to ammonia.
| Exposure Route |
Exposure
Type |
Fish Specie |
Ammonia
Concentration |
Exposure Periods |
Response
Concentration |
Target Organs |
Response * |
Reference |
| SOD (Superoxide dismutase) |
| Sea water |
Waterborne
exposure |
Dicentrarchus labrax |
20 mg/L |
12, 48, 84, 180 h |
20 mg/L |
Blood |
× |
Sinha et al. [74][76] 2015 |
| Epinephelus fuscoguttatus ♀ | Waterborne
exposure |
Cyprinus carpio |
106mg/L |
24 h |
106 mg/L |
− |
× E. lanceolatus ♂Hoseini et al. |
1, 2, 4, 8 mg/L[ |
1week, 2 wk |
4, 8 mg/L |
Liver, Gill |
+ |
Kim et al. [48] 202043] 2019 |
| Megalobrama amblycephala |
5, 10, 15, 20 mg/L |
9 weeks |
20 mg/L |
− |
Zhang et al. [11] 2019 |
| Scophthalmus maximus |
5, 20, 40 mg/L |
24, 48, 96 h |
20, 40 mg/L |
Ht (%) |
| Liver |
+ |
Jia et al. | [ | 75 | ] | [98] 2020 |
| Chlamys farreri |
20 mg/L |
1, 12, 24 d |
20 mg/L |
Blood |
+ |
Wang et al. [76][85] 2012 |
Sea water |
Waterborne
exposure |
Takifugu rubripes |
5, 50, 100, 150 mg/L |
| Takifugu rubripes |
5, 50, 100, 150 mg/L | 24, 48, 96 h |
24 h | 50, 100, 150 mg/L |
− |
50, 100, 150 mg/L |
Gill |
+ |
Gao et al. [40] | Gao et al. [40] 2021 |
| 2021 |
Piaractus
mesopotamicus |
1, 2, 3 mg/L |
96 h |
2, 3 mg/L |
+ |
Edison et al. [51][57] 2015 |
| Freshwater |
| 48, 96 h |
50, 100, 150 mg/L |
Gill |
− |
Waterborne
exposure |
Cyprinus carpio |
106 mg/L |
24 h |
10 6mg/L |
− |
Hoseini et al. [43] 2019 |
| Freshwater |
Waterborne
exposure |
Carassius auratus |
10, 50 mg/L |
30 d |
10, 50 mg/L |
Liver |
− |
Qi et al. [9] 2017 |
Megalobrama amblycephala |
5, 10, 15, 20 mg/L |
9 weeks |
20 mg/L |
− |
| Megalobrama amblycephala |
5, 10, 15, 20 mg/L | Zhang et al. |
9 weeks |
20 mg/L |
Liver[11] 2019 |
| − |
Zhang et al. | [ | 11 | ] | 2019 |
Hb (g/L) |
| Cyprinus carpio |
106 mg/L |
24 h |
106 mg/L |
Blood |
× |
Hoseini et al. [43] 2019 |
Sea water |
Waterborne
exposure |
Takifugu rubripes |
5, 50, 100, 150 mg/L |
24, 48, 96 h |
50, 100, 150 mg/L |
− |
Gao et al. [40] 2021 |
| Oreochromis niloticus |
5, 10 mg/L |
70 days |
5, 10 mg/L |
Liver, Muscle |
+ |
Hegazi et al. [77][87] 2010 |
Piaractus
mesopotamicus |
1, 2, 3 mg/L |
96 h |
| CAT (Catalase) | 2, 3 mg/L |
− |
Edison et al. | [ | 51][57] 2015 |
| Freshwater |
Waterborne
exposure |
Cyprinus carpio |
106 mg/L |
24 h |
106 mg/L |
− |
Hoseini et al. [43] 2019 |
| Sea water |
Waterborne
exposure |
Dicentrarchus labrax |
20 mg/L |
12, 48, 84, 180 h |
20 mg/L |
Blood |
+ |
Sinha et al. [74][76] 2015 |
Megalobrama amblycephala |
5, 10, 15, 20 mg/L |
9 weeks |
20 mg/L |
− |
Zhang et al. [11] 2019 |
| Scophthalmus maximus |
5, 20, 40 mg/L |
24, 48, 96 h |
20, 40 mg/L |
Liver |
+ |
Jia et al. [ |
Glucose (mg/dL) |
| 75 | ] | [ | 98 | ] | 2020 |
| Takifugu rubripes |
5, 50, 100, 150 mg/L |
24 h |
50, 100, 150 mg/L |
Gill |
+ |
Gao et al. [40] 2021 |
Sea water |
Waterborne
exposure |
Takifugu rubripes |
5, 50, 100, 150 mg/L |
24, 48, 96 h |
50, 100, 150 mg/L |
+ |
Gao et al. [40] 2021 |
| 48, 96 h |
50, 100, 150 mg/L |
Gill |
− |
Litopenaeus vannamei |
0.32, 0.44, 0.60 mg/L |
6 h, 12 h, 1 day, 2 days |
0.32, 0.44, 0.60 mg/L |
+ |
Cui et al. |
| Freshwater |
Waterborne
exposure | [ | 52 | ] |
Carassius auratus |
10, 50 mg/L[ |
30 days53] 2017 |
| 10, 50 mg/L |
Liver |
× |
Qi et al. | [ | 9 | ] | 2017 |
Piaractus
mesopotamicus |
1, 2, 3 mg/L |
96 h |
2, 3 mg/L |
+ |
Edison et al. [51][57] 2015 |
| Freshwater |
Waterborne
exposure |
Pelteobagrus fulvidraco |
100 mg/L |
24, 48, 72 h |
100 mg/L |
+ |
Zhao et al. [53][52] 2021 |
| Megalobrama amblycephala |
5, 10, 15, 20 mg/L |
9 weeks |
20 mg/L |
− |
Zhang et al. [11] 2019 |
| Cyprinus carpio |
0.5 mg/L |
24 h |
0.5 mg/L |
+ |
Mirghaed et al. [54][58] 2019 |
| Total protein (g/dL) |
| Sea water |
Waterborne
exposure |
Takifugu rubripes |
5, 50, 100, 150 mg/L |
24, 48, 96 h |
50, 100, 150 mg/L |
− |
Gao et al. [40] 2021 |
| Epinephelus fuscoguttatus ♀ × E. lanceolatus ♂ |
1, 2, 4, 8 mg/L |
1week, 2 weeks |
8 mg/L |
− |
Kim et al. [48] 2020 |
| Freshwater |
Waterborne
exposure |
Pelteobagrus fulvidraco |
100 mg/L |
24, 48, 72 h |
100 mg/L |
+ |
Zhao et al. [53][52] 2021 |
| Inject |
Ctenopharynodon idellus |
9 μL |
96 h |
9 μL |
× |
Xing et al. [55][59] 2016 |
| AST (U/L) |
| Freshwater |
Waterborne
exposure |
Pelteobagrus fulvidraco |
100 mg/L |
24, 48, 72 h |
100 mg/L |
+ |
Zhao et al. [53][52] 2021 |
| Megalobrama amblycephala |
5, 10, 15, 20 mg/L |
9 weeks |
20 mg/L |
+ |
Zhang et al. [11] 2019 |
| Cyprinus carpio |
106 mg/L |
24 h |
106 mg/L |
+ |
Hoseini et al. [43] 2019 |
| ALT (U/L) |
| Sea water |
Waterborne
exposure |
Takifugu rubripes |
5, 50, 100, 150 mg/L |
24, 48, 96 h |
50, 100, 150 mg/L |
+ |
Gao et al. [40] 2021 |
| Freshwater |
Waterborne
exposure |
Pelteobagrus fulvidraco |
100 mg/L |
24, 48, 72 h |
100 mg/L |
+ |
Zhao et al. [53][52] 2021 |
| Megalobrama amblycephala |
5, 10, 15, 20 mg/L |
9 weeks |
20 mg/L |
× |
Zhang et al. [11] 2019 |
| Cyprinus carpio |
106 mg/L |
24 h |
106 mg/L |
+ |
Hoseini et al. [43] 2019 |
| ALP (U/L) |
| Freshwater |
Waterborne
exposure |
Pelteobagrus fulvidraco |
100 mg/L |
24, 48, 72 h |
100 mg/L |
× |
Zhao et al. [53][52] 2021 |
| Megalobrama amblycephala |
5, 10, 15, 20 mg/L |
9 weeks |
20 mg/L |
× |
Zhang et al. [11] 2019 |
| Cyprinus carpio |
106 mg/L |
24 h |
106 mg/L |
+ |
Hoseini et al. [43] 2019 |
The balance of glucose levels is maintained by balancing the production of glucose and the storage of glucose as glycogen
[56][51]. Glucose metabolism meets the energy requirements of the organs and tissues, which can mediate the ammonia response. Zhao et al. reported a significant increase in glucose in juvenile yellow catfish,
Pelteobagrus fulvidraco, exposed to ammonia
[53][52]. Long-term exposure to ammonia results in a dramatic elevation of blood glucose in
Litopenaeus vannamei owing to the impaired glucose metabolism in the liver
[52][53]. Lower glucose levels were critical for reducing tissue injuries and maintaining low levels of gene expression of pro-inflammatory cytokines in stressful conditions
[32]. Changes in glucose levels in fish caused by ammonia exposure were attributed to stress responses or disturbances in homeostasis.
Enzyme plasma components including aspartate transaminase (AST), alanine transaminase (ALT) and alkaline phosphatase (ALP) are recognized as credible and sensitive biological indicators for evaluating damages to the liver and other fish organs following environmental stress
[57][54]. Plasma ALT and AST levels play important roles in indicating hepatopancreatic functions and injuries, and can be used as sensitive indicators of hepatocyte integrity
[58][55]. Zhao et al. revealed that AST and ALT levels were significantly increased in juvenile yellow catfish,
Pelteobagrus fulvidraco, exposed to ammonia, which may be due to damage to cell membranes and liver
[53][52]. Hoseini et al. recorded significant increases in ALT, AST and ALP of
Cyprinus carpio following ammonia exposure, which may be due to damage to cell membranes
[43]. Zhang et al. reported that ALP levels were significantly increased in
Megalobrama amblycephala exposed to ammonia
[11]. ALP is an important indicator reflecting liver damage, so the upward trend in ALP in
Megalobrama amblycephala is thought to be attributed to liver damage and stress caused by ammonia exposure. Peyghan et al. reported that ammonia exposure induced a remarkable increase in ALP in
Cyprinus carpio, indicating that hematological parameters were affected
[59][56].
Ammonia enters the circulation and disrupts blood proteins participated in lipid metabolism, immune defense, blood coagulation and molecular transport, when fish are exposed to ammonia
[11][13][11,13]. Specifically, ammonia particles may affect various blood physiologies through chemical and physical interactions in the blood. Various studies have confirmed changes in various hematological properties following ammonia exposure, and hematological parameters may be a reliable indicator for assessing fish toxicity.
4. Oxidative Stress
Oxidative stress is one of the toxicity mechanisms of ammonia nitrogen stress in aquatic animals
[7]. It has been shown that the increase in the concentration of ammonia nitrogen in aquaculture water can result in the production of reactive oxygen species (ROS) in aquatic animals
[60]. ROS combines with unsaturated fatty acids and cholesterol on the cell membrane to produce lipid peroxidation, which leads to reduced mobility and greater cell membrane permeability. Disturbance of the distribution of proteins across the cell membrane leads to cell membrane dysfunction and apoptosis
[61][62][61,62]. In order to counteract antioxidant stress and maintain the balance of the redox state of cells, antioxidant defense systems have evolved to function at different levels to avoid or repair this damage
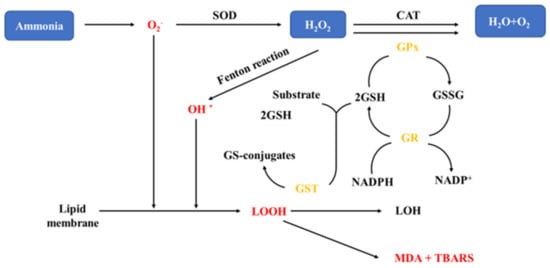
[31]. The mechanism of oxidative stress in fish exposed to ammonia is shown in
Figure 2. Studies have reported that the activities of antioxidant enzymes can be elicited in low concentrations of pollutants and disrupted in high concentrations
[63][64][63,64]. When physiological antioxidant system is unable to counteract the increased levels of stress-generated ROS, cellular oxidative stress occurs
[65].
Figure 2. Oxidative stress mechanisms in fish exposed to ammonia
[66][81]. H
2O
2: hydrogen peroxide; SOD: superoxide dismutase; CAT: catalase; GSH: glutathione; GST: Glutathione S-transferase; TBARS: Thiobarbituric reactive substances; MDA: malon dialdehyde; GPx: glutathione peroxide; GR: glutathione reductase; GSSG: glutathione; NADPH: nicotinamide adenine dinucleotide phosphate—Reprinted with permission from Ref.
[
| Megalobrama amblycephala |
| 5, 10, 15, 20 mg/L |
| 9 weeks |
| 20 mg/L |
| Liver |
| − |
| Zhang et al. |
| [ |
| 11 |
| ] |
| 2019 |
| Cyprinus carpio |
106 mg/L |
24 h |
106 mg/L |
Blood |
− |
Hoseini et al. [43] 2019 |
| Corbicula fluminea |
10, 25 mg/L |
24, 48 h |
10 mg/L |
Digestive gland |
+ |
Zhang et al. [78][84] 2020 |
| 10, 25 mg/L |
24, 48 h |
10 mg/L |
Gill |
× |
| 10, 25 mg/L |
24, 48 h |
25 mg/L |
Digestive gland |
− |
| 10, 25 mg/L |
24, 48 h |
25 mg/L |
Gill |
+ |
| GST (Glutathione-S-transferase) |
| Sea water |
Waterborne
exposure |
Dicentrarchus labrax |
20 mg/L |
12, 48, 84, 180 h |
20 mg/L |
Blood |
+ |
Sinha et al. [74][76] 2015 |
| Takifugu rubripes |
5, 50, 100, 150 mg/L |
24 h |
50, 100, 150 mg/L |
Gill |
+ |
Gao et al. [40] 2021 |
| 48, 96 h |
50, 100, 150 mg/L |
Gill |
− |
| Epinephelus fuscoguttatus♀ × E. lanceolatus ♂ |
1, 2, 4, 8 mg/L |
1 week |
4, 8 mg/L |
Liver, Gill |
+ |
Kim et al. [48] 2020 |
| Epinephelus fuscoguttatus♀ × E. lanceolatus ♂ |
1, 2, 4, 8 mg/L |
2 weeks |
4, 8 mg/L |
Liver, Gill |
− |
| Freshwater |
Waterborne
exposure |
Carassius auratus |
10, 50 mg/L |
30 days |
10, 50 mg/L |
Liver |
× |
Qi et al. [9] 2017 |
| Paralichthys orbignyanus |
5, 10 mg/L |
70 days |
5, 10 mg/L |
Liver, Muscle |
+ |
Hoseini et al. [43] 2019 |
| Cyprinus carpio L. |
10, 20, 30 mg/L |
6, 24, 48 h |
30 mg/L |
Liver |
+ |
Li et al. [10] 2019 |
| 10, 20, 30 mg/L |
6, 24, 48 h |
10, 20, 30 mg/L |
Gill |
+ |