Your browser does not fully support modern features. Please upgrade for a smoother experience.
Please note this is a comparison between Version 1 by Long Li and Version 2 by Rita Xu.
The successful establishment of many plants in tropical forests often depends on species-specific adaptations related to light availability and forest successional stage. Species that are present in early successional stages generally do not occur in later successional stages.
- light availability
- establishment success
- invasive plant species
1. Introduction
Biological invasions can have serious environmental and economic impacts (Dennis 2004), for example through reduced forest productivity [1] and disrupted ecosystem services [2]. Nevertheless, biological invasions may also have positive impacts, including economic benefits from the introduction of new food sources for humans [3], improved soil microbial biomass and soil mineralization [4], and positive bottom-up effects on higher trophic levels [5].
In plant communities, invasive species can have detrimental effects on the native flora, either directly via competition, or indirectly by altering soil chemistry [6], nutrient cycling [7], or community assembly [8]. The mechanisms of plant invasion largely involve two major hypotheses: one based on the invasive ability of the exotic species [9][10][11][12][9,10,11,12], and another based on the invasibility of the habitat [13][14][13,14]. Based on succession theory, most invasive species of forests are pioneers that can only survive in specific early successional stages (likewise for native pioneer species). Pioneer species are heliophilous plants that are generally characterized by rapid growth, shade-intolerance, fast reproductive cycles, and short lifespans (REFS).
Globally, there are approximately 289 invasive pioneer species documented to occur in the tropics and subtropics [15][16][17][18][16,17,18,19]. In general, tropical forests tend to be far less affected by invasive plant species than other forest types [19][20][20,21]. Complex forest communities and high connectivity, such as tropical forests, can resist invasion by exotic species through niche occupation and local adaptation [21][22][23][24][22,23,24,25].
2. Forest Edge Effects on Distribution and Abundance of Terrestrial Invasive Herbs and Shrubs
During 2014–2015, we surveyed the distribution of TIHS along transects running along the forest edge of tropical rain forest in Baiwang-lin Nature Reserve in Hainan Island (18°52′–19°12′ N, 108°53′–109°20′ E). The Nature Reserve has a circumference road (3–6 m wide) of 26 km and covers an altitudinal range of 250 m to 1265 m. Baiwang-lin Nature Reserve consists of four forest types: rubber plantation, lowland tropical rain forest (low elevation, no clear dominant tree species), hillside tropical rain forest (intermediate to high elevation, dominant species Dacrydium pierrei), and tropical coniferous forest (intermediate to high elevation, dominated by Pinus latteri). We established 13 transects of 250 m length, spaced a minimum of 1 km apart, along forest edges, covering all three natural forest types (i.e., excluding the rubber plantations) (Figure 1). Along each transect we established three belt transects (2 m × 20 m) starting at and perpendicular to the forest edge. Each belt was subdivided into four quadrats (2 m × 5 m) at a distance of 0–5, 5–10, 10–15, 15–20 m from the forest edge.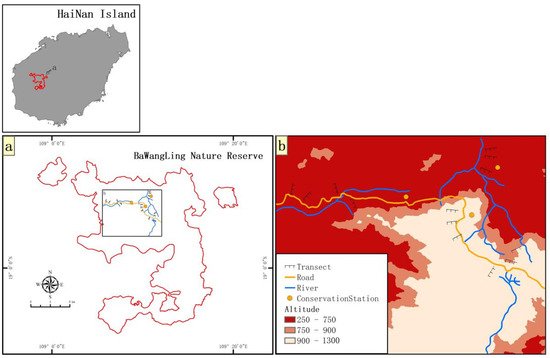
Figure 1. Location of soil sampling transects in Baiwang-lin Nature Reserve, Hainan Island, China. (a): Baiwang-lin Nature Reserve; (b): soil sample transects (dotted lines). The range in altitude of transects is 250–900 m. 13 transects of 250 m length were established, and along each transect there are three belt transects (2 m × 20 m) starting at and perpendicular to the forest edge.
3. Species Diversity and Distribution of Terrestrial Invasive Herbs and Shrubs in Hainan Island
Across all 97 sample sites, the nine study species were detected in all habitat types except for the tropical rain forest interior (Table 1). Several TIHS were found in all non-rain forest habitats (e.g., Co, Cs and Lc) and others were found in fewer habitats (e.g., Ap, Pf, and Ph).
Table 1. Incidence of nine species of terrestrial invasive herbs or shrubs in different vegetation types in Hainan Island, China.
| Habitat (N) | Ap | Co | Cs | Lc |
|---|---|---|---|---|
Of all invaded vegetation types, shrub land and forest edges had the lowest frequency of TIHS occurrence, while (abandoned) fields had the highest frequency (Table 2).
Table 2. Comparison of terrestrial invasive herbs and shrubs frequencies (TIHS/site) among invaded vegetation types (mean ± SE) *.
| TIHS | Frequency of Terrestrial Invasive Herbs and Shrubs | Mp | Pc | Pf | Ph | St | Species Per Site (Mean ± Stdev) | |||||||||||||
|---|---|---|---|---|---|---|---|---|---|---|---|---|---|---|---|---|---|---|---|---|
| AF (17) | PL (20) | RV (14) | SE (11) | FI (14) | GR (11) | |||||||||||||||
| Abandoned field (17) | + | + | + | + | Pc | 0.700 ± 0.500 + | a | 0.946 ± 0.472 + | a | 0.485 ± 0.298 + | b | 0.556 ± 0.529 + | b,c | + | 4.6 ± 1.3 | |||||
| 0.790 ± 0.451 | b,c | 0.685 ± 0.218 | b | Plantation (20) | 0 | + | + | + | + | + | 0 | |||||||||
| Mp | 0.502 ± 0.407 | a | 0.331 ± 0.357 | 0 | a | + | 4.2 ± 1.0 | |||||||||||||
| 0.274 ± 0.351 | a,b | 0.204 ± 0.430 | a | 0.592 ± 0.455 | c | 0.474 ± 0.250 | a,b | Rural (14) | + | + | + | + | + | + | + | + | + | 0.355 ± 0.527 | ||
| Co | 0.749 ± 0.493 | a | 3.9 ±0.8 | |||||||||||||||||
| 0.701 ± 0.465 | a | 0.628 ± 0.326 | a | 0.556 ± 0.529 | a | 0.733 ± 0.459 | a | 0.771 ± 0.226 | a | Grassland (11) | + | + | + | + | + | + | 0 | 0 | + | 3.4 ± 0.9 |
| Cs | 0.273 ± 0.431 | a | 0.339 ± 0.443 | a | 0.291 ± 0.394 | a | 0.186 ± 0.347 | a | a | 0.191 ± 0.094 | ||||||||||
A,C). In addition, distance to forest edge and canopy closure had a significant negative correlation with TIHS abundance (Figure 2B,D).
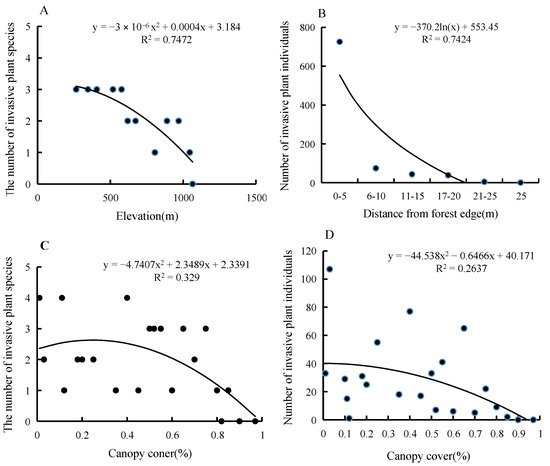
Figure 2. The relationship between the distribution characters and environmental factors. (A). The relationship between the number of invasive plant species and elevation; (B). The relationship between the number of invasive plant individuals and distance from forest edge; (C). The relationship between the number of invasive plant species and canopy coner; (D). The relationship between the number of invasive plant individuals and canopy cover.
Most TIHS individuals were found in sites 0–5 m from the forest edge, some at 5–10 m, and only a few at 10–15 m, 15–20 m, or 20–25 m (Figure 3A–C).
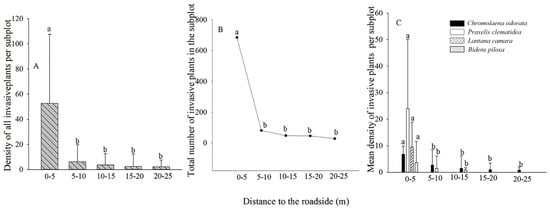
Figure 3. Abundance of terrestrial invasive herbs and shrubs in relation to distance from forest edge. (A). Density of invasive plants at different distances from forest edge; (B). The number of invasive plants at different distances from forest edge; (C). The density of four invasive plants at different distances from forest edge. Different lowercase letters indicate significant differences (p < 0.05).
A total of 57,138 individual seedlings from 72 plant species were germinated from the 195 soil samples collected from the Baiwang-lin Nature Reserve, among which 1545 seedlings of 12 TIHS were observed (2.7% of all seedlings). The 12 TIHS were P. clematidea, C. odorata, L. camara, M. pudica, M. repens, M. diplotricha, Crassocephalum crepidioides, Tridax procumbens, Bidens pilosa, Spermacoce alata, Ageratum conyzoides, and Stachytarpheta jamaicensis. Among these species, P. clematidea, C. odorata, L. camara, and M. pudica are classified as malignant TIHS in China (REF). The seed germination density of these TIHS ranged from 25 to 7000 seeds m−2 (Table 3). Seed density of the TIHS in the soil seed bank decreased rapidly with distance from the forest edge into the forest interior (Figure 4).
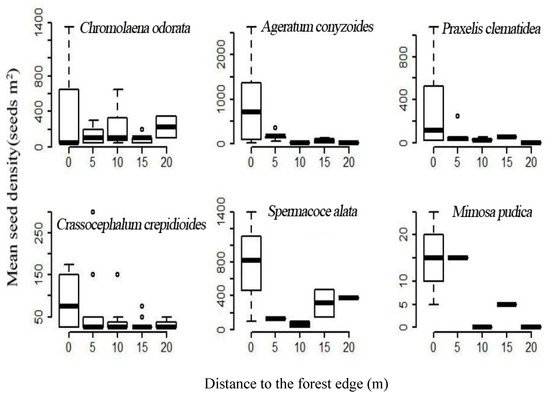
Figure 4. The relationship between distance from the forest edge (m) and the number of seeds germinated per m2 in our seed germination trails of soil samples collected at different distances from the forest edge.
Table 3. Germination results of the terrestrial invasive herbs and shrubs seeds in the soil seed banks of tropical forest edges.
| Species | Frequency (Presence/Soil Sample) | Furthest Distance Observed (m) |
Range (Seedlings m | −2 | ) | Density (Seedlings m | −2 | ) | Total Germinated Seedlings of TIHS | Proportion of All Germinated Seedlings (57,138) (%) | |||||||
|---|---|---|---|---|---|---|---|---|---|---|---|---|---|---|---|---|---|
| A. conyzoides | 0.138 | 20 | 25–625 | 501.9 ± 697.0 | 542 | 0.95 | |||||||||||
| P. clematidea | 0.159 | 20 | 25–7000 | 192.5 ± 267.0 | 511 | 0.89 | |||||||||||
| B. latifolia | 0.041 | 20 | 25–1400 | 387.5 ± 483.8 | 143 | 0.25 | |||||||||||
| C. odorata | a | 0.149 | 20 | 25–2900 | |||||||||||||
| Field (14) | |||||||||||||||||
| 104.5 ± 139.0 | PF+ | + | + | + | 0.118 ± 0.223 + | a | - | 0.112 ± 0.185 | a | -+ | + | + | + | 3.6 ± 0.8 | |||
| 0.051 ± 0.125 | a | - | Forest edge (11) | 0 | ++ | + | + | + | 0 | 0 | |||||||
| 117 | 0.2 | ||||||||||||||||
| R. repen | 0.015 | 0 | Lc | 0.118 ± 0.311 | + | a | 0.025 ± 0.092 | 2.7 ± 1.3 | |||||||||
| a | 0.112 ± 0.185 | a | 0.099 ± 0.188 | a | 0.051 ± 0.125 | a | 0.092 ± 0.137 | a | Rain forest (10) | 0 | 0 | 0 | 0 | 0 | 0 | 0 | 0 |
| Ap | 0.126 ± 0.211 | a | 0.022 ± 0.115 | a | 0.032 ± 0.105 | a | - | 0.091 ± 0.114 | a | 0.052 ± 0.137 | 0 | 0.0 ± 0.0 | |||||
| a | |||||||||||||||||
| 1545 | |||||||||||||||||
| 2.7 | |||||||||||||||||
The best-supported model explaining the canopy cover included a significant effect of altitude (LRT: χ2 = 27.234, df = 1, p < 0.001) and the distance from the forest edges (χ2 = 6.1831, df = 1, p = 0.129) (Table 4). The canopy cover increased significantly as the distance from edge and altitude increased. The second best-supported model had similar AIC to the first model and also included the forest type, though the significance was marginal (χ2 = 5.87, df = 3, p = 0.08). Low-stature forests generally had lower canopy cover than other forest types. Transects in higher areas in the study site usually had a more dense canopy cover (estimate of difference in higher altitude effect for the surveyed transects = 0.551; 95% confidence interval = 0.329, 0.774).
Table 4. The best-supported models explaining (A) the pooled species richness of exotic species and (B) the pooled abundance of exotic species (C) the presence of exotic plants in the soil seed bank. Parameter estimates and their standard errors are shown, as are standard deviations of model random effects.
| Effects | Parameter | Estimate (±1 SE) | ||||||||||
|---|---|---|---|---|---|---|---|---|---|---|---|---|
| (A) Pooled species richness of exotic species ~ Distance from edge + Canopy | Intercept | 1.114 (0.212) | ||||||||||
| Distance from the edge | −0.780 (0.383) | |||||||||||
| Canopy cover | −0.796 (0.453) | |||||||||||
| (B) Pooled abundance of exotic seeds ~Distance from edge + Canopy cover + seed mass | Intercept | 3.455 (0.302) | 225–1375 | 783.3 ± 575.0 | 94 | 0.16 | ||||||
| Distance from the edge | −4.291 (0.650) | C. crepidioide | 0.185 | 20 | 25–300 | 54.9 ± 59.7 | 79 | 0.14 | ||||
| seed mass | −2.151 (0.715) | M. diplotricha | 0.015 | 10 | 25–275 | 166.5 ± 128.0 | 20 | |||||
| 0.04 | St | 0.126 ± 0.391 | a | |||||||||
| Canopy cover | −0.526 (0.361) | 0.226 ± 0.173 | b | 0.029 ± 0.140 | a | 0.050 ± 0.169 | a | M. pudica | 0.179 ± 0.397 | a | 0.129 ± 0.140 | a |
| 0.036 | 15 | 25–125 | 67.9 ± 37.4 | 19 | 0.03 | Ph | 0.085 ± 0.121 | a | 0.015 ± 0.002 | a | 0.112 ± 0.105 | a |
| (C) Presence of exotic plants in the soil seed bank ~Distance from edge + Canopy cover | - | 0.051 ± 0.125 | a | 0.092 ± 0.037 | a | |||||||
| AFTIHS ** | 2.806 | 2.605 | 2.075 | 1.651 | 2.893 | 2.486 |
* Different lowercase letters indicate significant differences between invaded vegetation types (p < 0.05). ** AFTIHS: Accumulated frequency of invasive plants. AF: abandoned field, PL: plantation, RV: rural vegetation, SE: shurb and edge of tropical forest, FI: field, GR: grassland. Ap: A. philoxeroides, Co: C. odorata, Cs: C. sumatrensis, Lc: L. camara, Mp: M. pudica, Pc: P. clematidea, PF: P. fasciculare, Ph: P. hysterophorus and St: S. trilobata.
4. Forest Edge Effects on Terrestrial Invasive Herbs or Shrubs
Elevation and canopy cover had a significant negative correlation with TIHS species numbers (Figure 2
| Intercept | |||||||||
| 6.910 (2.867) | |||||||||
| S. jamaicensis | |||||||||
| 0.010 | |||||||||
| 20 | 25–175 | 100.0 ± 106.1 | 8 | 0.01 | |||||
| Distance from the edge | −2.627 (0.741) | B. pilosa | 0.015 | 15 | 25–75 | 41.6 ± 28.8 | 5 | 0.01 | |
| Canopy cover | 0.265 (0.820) | L. camara | 0.021 | 0 | 25 | 25.0 | 4 | 0.01 | |
| T. procumbens | 0.015 | 10 | 25 | 25.0 | 3 | 0.01 | |||
| Total |
For the pooled abundance of alien plants in the soil seed bank, the best-fitting model according to Akaike weights retained the significant effects of the distance from the edge (χ2 = 46.81, df = 1, p < 0.001), and the seed mass of the alien plants (χ2 = 8.682, df = 1, p = 0.003; Table 1), as well as a weak effect of canopy cover (χ2 = 1.802, df = 1, p = 0.179), while the second best model had similar AIC values to the first model and included the influence of altitude besides canopy cover and distance from edge (Table 4). For all the surveyed forests, the pooled abundance of alien species declined markedly with increasing distance from the edge. The seed traits of the exotic plants significantly affected their abundance in the soil seed bank. Light-seeded species were more abundant compared with the large-seeded species. We also found that species with lower seed mass usually have a higher chance of occurrence in the soil seed banks. This may suggest a biological barrier for the large-seeded exotic species to penetrate into the forest interior.
5. Seed Germination and Seedling Survival of Terrestrial Invasive Herbs and Shrubs in Forest Gaps
The average germination rate of TIHS was very low, being only 12.1%, 5.9%, and 2.1% in the gap core area (CA), boundary of forest gap (EA), and understory near the forest gap (UA), respectively. The germination rates for all TIHS were higher in the center of the gaps, lower at the edge of the gap, and even lower at the forest interior (Table 1, Figure 5 and Figure 6), except for M. diplotricha. The seed germination of M. diplotricha occurred within 2 to 10 days after sowing, with 31, 21, and 27 seedlings in CA, EA, and UA, respectively. The seed germination of P. clematidea occurred within 5 to 15 days after sowing, with 209, 133, and 37 seedlings in CA, EA, and UA, respectively. The seed germination of C. odorata occurred within 6 to 25 days after sowing, with 120, 23, and no seedlings in CA, EA, and UA, respectively. The seed germination of L. camara occurred within 20 to 30 days after sowing, with two, one, and no seedling(s) in CA, EA, and UA, respectively. All seedlings died within a year.
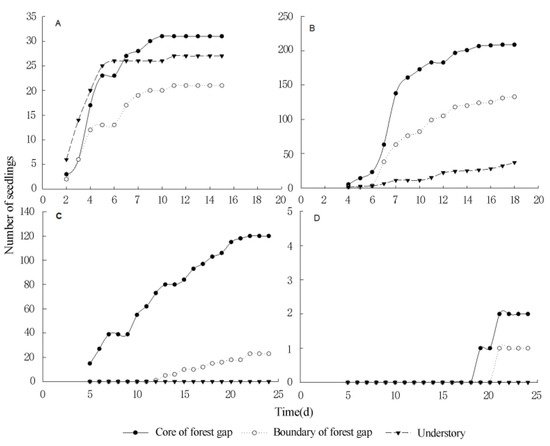
Figure 5. The germination rates of four species of terrestrial invasive herbs and shrubs in different locations of the forest gap ((A): M. diplotricha, (B): P. clematidea, (C): C. odorata, (D): L. camara).
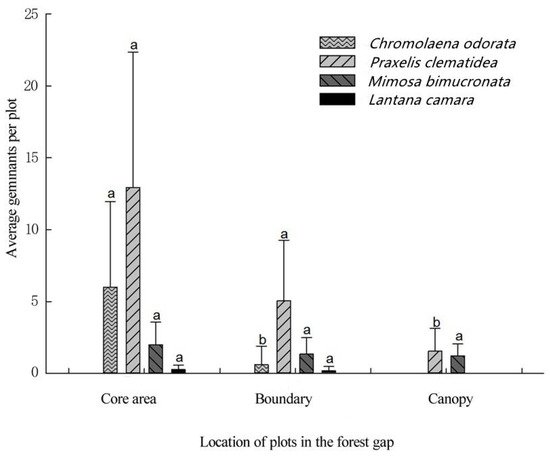
Figure 6. Comparison of mean germinants per plot of four species of terrestrial invasive herbs and shrubs in three different positions in the forest gap. Different lowercase letters indicate significant differences (p < 0.05).