Stock Market Prediction (SMP) is an example of time-series forecasting that promptly examines previous data and estimates future data values. Financial market prediction has been a matter of worry for analysts in different disciplines, including economics, mathematics, material science, and computer science. Driving profits from the trading of stocks is an important factor for the prediction of the stock market.
- generic review
- machine learning
- stock market prediction
- support vector machine
1. Introduction
According to [1][10], there exist two main traditional approaches to the analysis of the stock markets: (1) fundamental analysis and (2) technical analysis.
Technical analysis is the study of stock prices to make a profit, or to make better investment decisions [2][19]. Technical analysis predicts the direction of the future price movements of stocks based on their historical data, and helps to analyze financial time series data using technical indicators to forecast stock prices. Meanwhile, it is assumed that the price moves in a trend and has momentum [3][20]. Technical analysis uses price charts and certain formulae, and studies patterns to predict future stock prices; it is mainly used by short-term investors. The price would be considered high, low or open, or the closing price of the stock, where the time points would be daily, weekly, monthly, or yearly. Dow theory puts forward the main principles for technical analysis, which are that the market price discounts everything, prices move in trends, and historic trends usually repeat the same patterns [4][21]. There are several technical indicators, such as the Moving Average (MA), Moving Average Convergence/Divergence (MACD), the Aroon indicator, and the money flow index, etc. The evident flaws of technical analysis as per [5][18] are that expert’s opinions define rules in technical analysis, which are fixed and are reluctant to change. Various parameters that affect stock prices are ignored.
The prerequisite is to overcome the deficiencies of fundamental and technical analysis, and the evident advancement in the modelling techniques has motivated various researchers to study new methods for stock price prediction. A new form of collective intelligence has emerged, and new innovative methods are being employed for stock value forecasting. The methodologies incorporate the work of machine learning algorithms for stock market analysis and prediction.
One of the phenomena of current times that is changing the world is the global availability of the internet. The most-used platforms on the internet are social media. It is estimated that social media users all over the world will number around 3.07 billion [6][27]. There is a high association between stock prices and events related to stocks on the web. The event information is extracted from the internet to predict stock prices; such an approach is known as event-driven stock prediction [7][28]. Through social networks, people generate tremendous amounts of data that is filled with emotions. Much of this data is related to user perceptions and concerns [8][29]. Sentiment analysis is a field of study that deals with the people’s concerns, beliefs, emotions, perceptions, and sentiments towards some entity [9][10][30,31]. It is the process of analyzing text corpora, e.g., news feeds or stock market-specific tweets, for stock trend prediction. The Stock Twits, Twitter, Yahoo Finance, and so on are well-known platforms used for the extraction of sentiments. There is a significant importance of using sentimental data for enhancing the prediction of volatility in the stock market. The ‘Wisdom of Crowds’ and sentiment analysis generate more insights that can be used to increase the performance in various fields, such as box office sales, election outcomes, SMP, and so on [11][32]. This suggests that a good decision can be made by taking the opinions and insights of large groups of people with varied types of information [12][33]. The information generated through social media allows us to explore vast and diverse opinions. Exploring sentiments from social media in addition to numeric time-series stock data would enhance the accuracy of the prediction. Using time-series data as well as social media data would intensify the prediction accuracy. Different approaches and techniques have been proposed over time to anticipate stock prices through numerous methodologies, thanks to the dynamic and challenging panorama of stock markets [13][34].
2. Generic Scheme for SMP
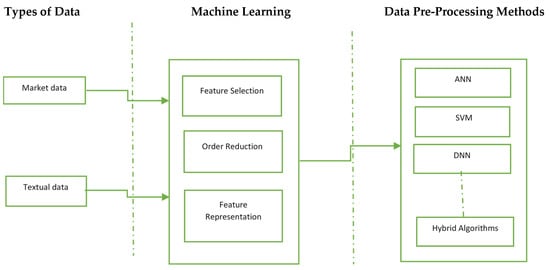
Figure 13 describes the generic process involved in SMP. The process starts with the collection of the data, and then pre-processing that data so that it can be fed to a machine learning model. The prediction models generally use two types of data: market and textual data. The literature of both types is discussed in the following section. The next section classifies the previous studies based on the type of data used. Furthermore, the next section surveys the previous studies based on the various data-preprocessing approaches applied. Moreover, the literature is further surveyed based on the machine learning algorithms used by different systems.
3. Overfitting
One of the most well-known and challenging issues in machine learning models is overfitting. In this phenomenon, the model tries too hard to learn from training data. This means that the model picks up on noise or random fluctuations in the training data and learns them as ideas. These ideas don’t apply to the new data that is to be predicted, thereby resulting in poor model generalization. Because stock market data is highly stochastic, it is imperative to explain the methods used to resolve this issue. The most common approach to mitigate the issue of overfitting is cross validation. A few studies have applied this approach, like in [14][15][16][17][18][38,42,150,151,152]. In a typical k-fold cross-validation, the data is partitioned into k subsets, or folds. The model is trained iteratively on k-1 folds, and the remaining fold—also known as the hold-out fold—is treated as a test set. Numerous studies have used the early stopping method to overcome overfitting [19][153]. Another method is to remove irrelevant features and noise from the data, which greatly increases the model’s generalizability. A few studies have implemented these procedures to avoid overfitting, such as [15][20][21][22][42,44,68,121]. The most important preventive measure against overfitting is regularization. This technique removes the extra weights from the selected features and redistributes them uniformly. It discourages the learning of models that are complex or more flexible, hence avoiding the risk of overfitting. The majority of the reviewed studies applied regularization approaches to prevent overfitting [23][24][25][23,25,83]. A few recent studies applied the procedure of data augmentation to prevent overfitting [26][27][154,155].
4. Comparative Analysis
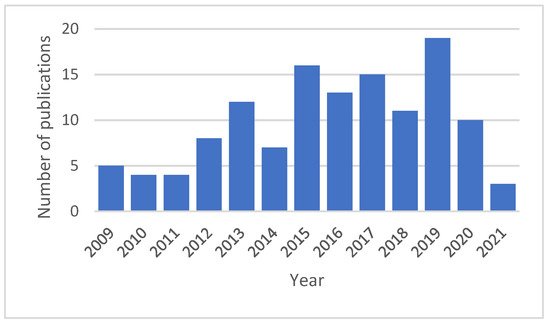
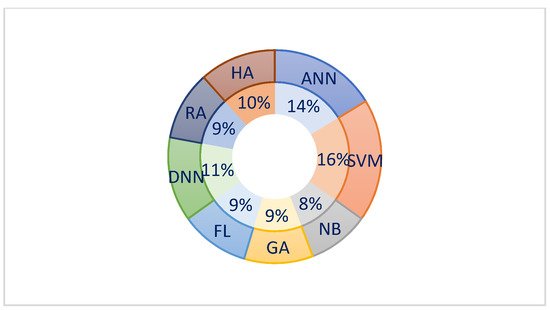
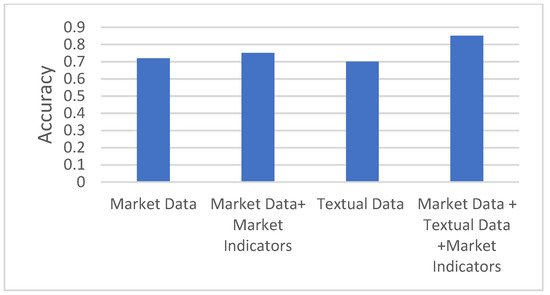
The distribution of the number of papers published in recent years is presented in Figure 25. The number of publications increased from 2009, and was at its peak in 2019, but over the previous two years, the publication number was low. The distribution of machine learning algorithms used for SMP is shown in Figure 36, where the SVM was the most popular technique used. However, the ANN and DNN have attracted the research community’s attention for the last few years. Traditional neural network approaches may not make accurate SMPs as initially; the weight of the randomly selected problems may suffer from the local optimal, and results in incorrect predictions [28][123]. The deep learning approaches are used to analyze complicated patterns in the stock data, and provide much faster results[29]. Furthermore, there is no such single technique that can promise to give the optimum results. The comparative analysis between the type of data used and the performance of the models is represented in Figure 47. Data alone from social media do not perform better than using market data and technical indicators[30]. However, if data from textual sources is combined with them, then the model performance increases. These ensemble approaches in predictive model building has much advantages in terms of optimizing accuracy, rigor and availability of data within emerging economies[31][32]. Econometric models like Vector autoregression (VAR) is also promising technique if model can be provided with high frequency data and retraining procedures [33]