Your browser does not fully support modern features. Please upgrade for a smoother experience.
Please note this is a comparison between Version 2 by Oskan Bahidinov Tasinov and Version 1 by Oskan Bahidinov Tasinov.
Sambucus ebulus L. (SE), also known as dwarf elder or dwarf elderberry, is a widely used as wound-healing, anti-nociceptive, anti-rheumatoid, anti-influenza, antibacterial and diuretic medicinal plant in Bulgaria, Turkey, Iran, Lebanon, Romania and Bosnia–Herzegovina.
- Sambucus ebulus L.
- phytochemical composition
- anti-inflammatory
- ER stress
- lipopolysaccharides
- macrophages
1. Introduction
Traditional medicine is a good source of knowledge about therapeutics, which are consequently researched and successfully implicated in modern pharmaceutical preparations. Sambucus ebulus L. (SE), also known as dwarf elder or dwarf elderberry, is a widely used as wound-healing, anti-nociceptive, anti-rheumatoid, anti-influenza, antibacterial and diuretic medicinal plant in Bulgaria, Turkey, Iran, Lebanon, Romania and Bosnia–Herzegovina [1,2,3,4,5]. Fresh fruits, jam, tea or decoction of SE fruits are used as immunostimulating and hematopoietic herbal preparations, as well as for the treatment of rheumatoid arthritis and gastrointestinal disorders [1,2,6]. The number of modern studies focusing on SE biological activities are growing, but there is still insufficient knowledge regarding molecular mechanisms of action of fresh or dry fruits and various fruit extracts.
Only ripe fruits are used in traditional medicine recipes and the chemical content varies depending on the types of the extract [3,7]. Data from phytochemical analyses in the literature reveal that SE fruits are high in polyphenolics, especially anthocyanins and proantchocyanidins, phenolic acids, hydroxycinnamic acids, flavonol glycosides, as well as organic acids, tannins, pectins, resins, vitamin C, volatile substances (eugenol, valeric acid, citronellal etc.), amino acids (including some essential ones), and plant sterols [3,7,8,9,10,11,12,13,14,15,16]. Many chromatographic analyses of SE fruit extracts have been carried out up to date, and, still, the information about the presence of certain specific organic compounds remains unclear, especially with regard to soil characteristics, variety of extragents used for sample preparation. Therefore, a detailed phytochemical analysis could be useful, especially in examining the molecular mechanisms of SE fruits on human health.
Numerous studies have established the strong in-vitro antioxidant activity of SE fruit extracts, analyzing its iron chelating, NO radical scavenging, and ABTS cation radical decolorization activity, and their interrelations with polyphenolic and anthocyanin content [3,7,8]. The presence of different functional groups in polyphenolics and organic acids found in the tested SE fruit extracts is considered to determine, to a great extent, their antioxidant and anti-inflammatory activities. In oxidatively challenged 3T3-L1 preadipocytes, SE fruit aqueous extract (FAE) acts as modulator of antioxidant genes’ transcription [17]. In macrophages treated with ethanol- or lipopolysaccharides (LPS), SE FAE suppresses the ethanol- and LPS-stimulated transcription of glutamate–cysteine ligase, glutathione peroxidase and nuclear factor kappa B (NFκB) [9,18]. Acetone extracts, hydrophilic and anthocyanin-rich fractions of SE fruits possessing high in-vitro antioxidant activity protect macrophages from the oxidative stress-mediated cytotoxicity caused by tert-Butyl hydroperoxide [19]. Ethyl acetate fraction of SE fruits possesses cytoprotective and anti-inflammatory activity reducing ethanol-induced cell death, proinflammatory gene transcription in macrophages [9]. Methanolic extracts of SE fruits reduce carrageenan-induced paw edema in rats [20]. Others describe the antiemetic, neuroprotective and anti-herpes-simplex-virus activities of SE fruit extracts [12,21].
In an intervention study on healthy adult volunteers, SE fruit tea enhances serum antioxidant potential, improves lipid profile [22], decreases serum CRP, IL-1β, leptin and adiponectin levels [23], thus indicating an immune- and fat metabolism-modulating activity. A clinical trial reported the effectiveness of SE fruit ethanol extract for the treatment of paederus dermatitis, proving its anti-inflammatory and wound healing potential [24].
LPS-stimulated macrophages are widely used in-vitro models for testing anti-inflammatory activity of medicinal plant extracts. The macrophages are source of a variety of pro-inflammatory cytokines, chemokines, and may act in a paracrine and endocrine mode. In low grade inflammation, such as in adiposity, where the activation of chemokine release is associated with macrophage recruitment and unlocking a self-feeding inflammatory process that leads to such complications as insulin resistance and related atherosclerosis [25]. The released cytokines and chemokines, such as TNFα, IL-6, IL-1β, NO, as a product of iNOS, activate signaling pathways mediated by Jun N-terminal kinase (JNK), the inhibitor of κB-kinase (IKK)β and other serine kinases [25,26,27,28], and resulting in NFκB activation. The latter stimulates the transcription of pro-inflammatory genes [29].
Along with the protein synthesis, endoplasmic reticulum (ER) plays an important role in sensing nutrients and responds to different stress conditions by activating the unfolded protein response and subsequently implicating it into insulin resistance and cardiovascular diseases [30,31]. ER stress can promote inflammation, and vice versa [32,33]. ER stress-related inflammation could be mediated by iNOS [34]. Therefore, the enzyme iNOS as a cross point of inflammation and ER stress could be a possible therapeutic target.
There are data that ER stress and inflammation in different pathological conditions could be reduced by compounds such as resveratrol [35,36], epigallocatechin gallate [37] and proanthocyanidins found in herbal extracts [38]. SE fruits, being rich polyphenolics, anthocyanins and stilbenes, could be effective in combating ER stress and inflammation.
2. Phytochemical Content and Composition
Among the phytochemical compounds identified in the tested SE FAE 15 amino acids (AAs), 10 organic acids (OAs), 36 sugar acids and alcohols, 25 mono-, di- and trisaccharides, 13 fatty acids (saturated and unsaturated) and their esters (Table 1), and 38 phenolic compounds were detected and quantified (Table 2).Table 1. List of polar phytochemicals identified in the analyzed polar fraction (A) of SE FAE using GC-MS technique. The concentration was given in µg/mL extract. Results are presented as mean ± standard deviation.
| Compound | Content, µg/mL | ||
|---|---|---|---|
| Amino Acids | |||
| L-Valine | 3.02 ± 0.21 | ||
| L-Leucine | 8.06 ± 0.56 | ||
| Cyanidin-3-O-glucoside (chrysanthemin) | 31.07 ± 1.10 | L-Isoleucine | 8.48 ± 0.59 |
| Cyanidin-3-O-arabinoside | L-Proline | 20.01 ± 1.40 | |
| 85.87 ± 2.80 | L-Threonine | 3.89 ± 0.27 | |
| Cyanidin-3-O-xyloside | |||
| Melibiose isomer; alpha-D-Gal-(1,6)-D-Glc isomer | |||
| 18.59 ± 1.30 | |||
| 14.35 ± 0.53 | |||
| Proanthocyanidin monomers | L-Phenylalanine | 10.25 ± 0.72 | |
| Catechin | 40.19 ± 1.33 | L-Lysine | 4.37 ± 0.31 |
| Epicatechin | 322.37 ± 11.75 | Glycine | 3.78 ± 0.26 |
| Proanthocyanidin dimers | Serine | 2.59 ± 0.18 | |
| EC→EC (1) | 171.40 ± 6.23 | L-Aspartic acid | 16.32 ± 1.14 |
| EC→EC (2) | 169.24 ± 6.15 | L-Asparagine | 6.19 ± 0.43 |
| EC→EC (3) | 189.86 ± 6.90 | L-Glutamic acid | 1.34 ± 0.09 |
| L-Glutamine | 22.99 ± 1.61 | ||
| DL-Ornithine | 12.36 ± 0.86 | ||
| L-Tyrosine | 2.66 ± 0.19 | ||
| Organic Acids | |||
| Succinic acid | 12.64 ± 0.88 | ||
| Fumaric acid | 6.61 ± 0.46 | ||
| Malic acid | 9.22 ± 0.65 | ||
| EC→EC (4) | 157.91 ± 5.74 | ||
| Proanthocyanidin trimers | |||
| EC→EC→EC (1) | 225.23 ± 8.16 | ||
| EC→EC→EC (2) | 242.27 ± 8.78 | ||
| EC→EC→EC (4) | 198.92 ± 7.21 | Pyroglutamic acid (5-oxoproline) | |
| EC→EC→EC (4) | 249.36 ± 9.04 | ||
| Stilbenes | |||
| trans-Resveratrol-3-O-glucoside | 51.92 ± 1.94 | 33.63 ± 2.35 | |
| Cyclohexanecarboxylic acid | 4-Aminobutyric acid | 5.69 ± 0.40 | |
| Quinic acid | 2-Hydroxyglutaric acid | 4.07 ± 0.29 | |
| 108.00 ± 4.02 | 2-Ketoglutaric acid | 8.02 ± 0.56 | |
| Phenylpyruvic acid | |||
| Hydroxycinnamic acids | |||
| 3-O-Caffeoylquinic acid (chlorogenic acid) | 567.06 ± 20.55 | 2.18 ± 0.15 | |
| Caffeic acid-O-galactoside | 98.72 ± 3.58 | 2,3-Dihydroxybutanedioic acid | 10.49 ± 0.73 |
| Caffeic acid-O-glucoside | Isocitric acid | 18.12 ± 1.27 | |
| Sugar Acids and Alcohols | |||
| 74.66 ± 2.71 | |||
| 5-O-Caffeoylquinic acid (neochlorogenic acid) | 906.08 ± 32.84 | Glycerol | |
| p-Coumaric acid-O-glucoside | 236.37 ± 8.57 | ||
| 3-O-p-Coumaroylquinic acid | 36.12 ± 2.53 | ||
| Digalactosylglycerol | 6.99 ± 0.63 | ||
| 399.47 ± 14.48 | |||
| Feruloylquinic acid | 248.93 ± 9.02 | Glyceric acid | 17.05 ± 1.19 |
| Threitol | 7.66 ± 0.54 | ||
| Ferulic acid-O-galactoside | Erythreol | 2.09 ± 0.15 | |
| Erithreonic acid | 2.65 ± 0.19 | ||
| Threonic acid | 8.40 ± 0.59 | ||
| Xylitol | 4.20 ± 0.29 | ||
| Melibiose isomer; alpha-D-Gal-(1,6)-D-Glc isomer | |||
| 18.80 ± 1.32 | |||
| 131.66 ± 4.77 | |||
| Sucrose; alpha-D-Glc-(1,2)-beta-D-Fru isomer | |||
| 20.55 ± 1.44 | |||
| Trehalose; alpha-D-Glc-(1,1)-alpha-D-Glc isomer | |||
| 16.13 ± 1.13 | |||
| 4-O-p-Coumaroylquinic acid | |||
| Ferulic acid-O-glucoside | 122.26 ± 4.43 | ||
| Flavonol glycosides | |||
| Quercetin-3-O-rhamnosyl-galactoside | 25.57 ± 0.93 | ||
| Quercetin-3-O-galactoside (hyperoside) | 29.17 ± 1.06 | Arabinitol | 34.65 ± 2.43 |
| Kaempferol-3-O-galactoside | Pentonic acid | 7.69 ± 0.54 | |
| 11.15 ± 0.40 | |||
| Quercetin-3-O-rhamnosyl-glucoside | 20.35 ± 0.74 | L-Glycerol-3-phosphate | 17.72 ± 1.24 |
| Quercetin-3-O-glucoside (isoquercetin) | 22.80 ± 0.83 | Ribonic acid | 4.76 ± 0.33 |
| Kaempferol-3-O-glucoside (astragalin) | 9.94 ± 0.36 | Manitol | 2.98 ± 0.21 |
| Quercetin-3-O-arabinoside (guaiaverin) | 16.77 ± 0.61 | Sorbitol | 49.26 ± 3.45 |
| Quercetin-3-O-xyloside | Glucuronic acid isomer | 8.49 ± 0.59 | |
| 13.97 ± 0.51 | Galactitol | 1.91 ± 0.13 | |
| Galacturonic acid isomer | 15.91 ± 1.11 | ||
| Glucuronic acid isomer | 13.03 ± 0.91 | ||
| Gluconic acid isomer | 1.78 ± 0.12 | ||
| Galacturonic acid isomer | 2.89 ± 0.20 | ||
| Glucuronic acid isomer | 3.87 ± 0.27 | ||
| Galactonic acid | 6.33 ± 0.44 | ||
| Gluconic acid isomer | 3.71 ± 0.26 | ||
| Glucaric acid | 14.00 ± 0.98 | ||
| Galactaric acid | 3.38 ± 0.24 | ||
| Myo-inositol | 6.71 ± 0.47 | ||
| Galactosylglycerol | 22.50 ± 1.58 | ||
| Sorbitol-6-phosphate | 43.32 ± 3.03 | ||
| myo-Inositol-1-phosphate isomer | 5.64 ± 0.39 | ||
| myo-Inositol-2-phosphate isomer | 7.43 ± 0.52 | ||
| Gluconic acid-6-phosphate | 1.54 ± 0.11 | ||
| Kaempferol-3-O-rhamnosyl-galactoside | myo-Inositol-1-phosphate isomer | 3.30 ± 0.23 | |
| myo-Inositol-2-phosphate isomer | 6.87 ± 0.48 | ||
| Maltitol; alpha-D-Glc-(1,4)-D-sorbitol | 4.90 ± 0.34 | ||
| Galactinol isomer; alpha-D-Gal-(1,3)-myo-Inositol | 0.69 ± 0.05 | ||
| Galactinol isomer; alpha-D-Gal-(1,3)-myo-Inositol | 3.67 ± 0.26 | ||
| Saccharides (mono-, di-, and tri-) | |||
| Xylose methoxyamine | 5.94 ± 0.42 | ||
| Arabinose methoxyamine | 12.65 ± 0.89 | ||
| Fructose isomer | 14.31 ± 1.00 | ||
| Fructose isomer | 18.89 ± 1.32 | ||
| 12.52 ± 0.45 | |||
| Kaempferol-3-O-rhamnosyl-glucoside | 9.15 ± 0.33 | Sorbose isomer | 28.11 ± 1.97 |
| Sorbose isomer | 21.35 ± 1.49 | ||
| Galactose isomer | 35.19 ± 2.46 | ||
| Galactose isomer | 13.86 ± 0.97 | ||
| Glucose isomer | 17.34 ± 1.21 | ||
| Glucose isomer | 13.59 ± 0.95 | ||
| Fructose-6-phosphate isomer | 16.20 ± 1.13 | ||
| Mannose-6-phosphate isomer | 3.47 ± 0.24 | ||
| Galactose-6-phosphate isomer | 18.79 ± 1.32 | ||
| Glucose-6-phosphate isomer | 30.27 ± 2.12 | ||
| Fructose-6-phosphate isomer | 5.81 ± 0.41 | ||
| Raffinose; alpha-D-Gal-(1,6)-alpha-D-Glc-(1,2)-beta-D-Fru isomer | |||
| Kaempferol-3-O-arabinoside | 11.15 ± 0.40 | ||
| Kaempferol-3-O-xyloside | 12.80 ± 0.46 | Galactose-6-phosphate isomer | 3.32 ± 0.23 |
| Glucose-6-phosphate isomer | 4.52 ± 0.32 | ||
| 12.91 ± 0.90 | |||
| Total analyzed polyphenols | Sucrose; alpha-D-Glc-(1,2)-beta-D-Fru isomer | 24.81 ± 1.74 | |
| Trehalose; alpha-D-Glc-(1,1)-alpha-D-Glc isomer | 10.10 ± 0.71 | ||
| Raffinose; alpha-D-Gal-(1,6)-alpha-D-Glc-(1,2)-beta-D-Fru isomer | 25.61 ± 1.79 | ||
| Saturated, unsaturated acids and esters | |||
| 9-(E)-Hexadecenoic acid | 8.52 ± 0.77 | ||
| 9-(Z)-Hexadecenoic acid | 6.57 ± 0.59 | ||
| Heptadecanoic acid | 7.56 ± 0.68 | ||
| Hexadecatrienoic acid | 4.85 ± 0.44 | ||
| Hexadecanoic acid (Palmitic acid) | 6.56 ± 0.59 | ||
| Heptadecanoic acid | 6.06 ± 0.55 | ||
| 9,12-(Z,Z)-Octadecadienoic acid (Linoleic acid) | 9.69 ± 0.87 | ||
| 9,12,15-(Z,Z,Z)-Octadecatrienoic acid (Linolenic acid) | 8.42 ± 0.76 | ||
| Octadecanoic acid (Stearic acid) | 11.12 ± 1.00 | ||
| (2E,4E)-2,4-Octadecadienoic acid | 15.65 ± 1.41 | ||
| 1-Monopalmitin | 13.80 ± 1.24 | ||
| Monooctadecanoylglycerol | 8.62 ± 0.78 | ||
| beta-Sitosterol | 15.22 ± 1.37 | ||
All metabolites are trimethylsilyl derivatives; SE FAE–Sambucus ebulus L. fruit aqueous extract; essential AAs are given in italic. Additional data regarding chromatographic parameters and total ion chromatogram of tested polar compounds are given in Table S1 and Figure S1, respectively.
Table 2. Polyphenolic compounds identified in non-anthocyanin fraction (B) and anthocyanin fraction (C) of the SE FAE using LC-PDA-ESI-MS/MS technique. The concentrations are given in µg/mL extract. Results are presented as mean ± standard deviation.
| Compound | Content, µg/mL |
|---|---|
| Anthocyanins | |
| Cyanidin-3-O-galactoside (idaein) | 382.15 ± 13.19 |
| 219.83 ± 7.97 | |
| 5840.50 | |
EC–epicatechin; SE FAE–Sambucus ebulus L. fruit aqueous extract. Additional data regarding precursor ion and fragment ion mass-to-charge ratios (m/z) of the analyzed polyphenols are given in Table S2. Representative LC-PDA-ESI-MS/MS chromatograms of detected polyphenols are given in Figure S2 (anthocyanins), Figure S3 (proanthocyanidin monomers), Figure S4 (proanthocyanidin proanthocyanidin di- and trimers), Figure S5 (stilbenes), Figure S6 (hydroxycinnamic acids), Figure S7 (hydroxycinnamic acids), Figures S8–S11 (flavonols).
2.2. Investigation of Inflammation Related Biomarkers in a Model of LPS-Stimulated J774A.1 Macrophages
Aiming to study the anti-inflammatory action of the aqueous extract of dwarf elderberry under conditions of LPS-stimulated inflammatory response in J774A.1 mouse macrophages, the transcriptional levels of genes coding for proteins mediating and involved in the inflammatory process as well as the translation levels of iNOS were analyzed. Macrophage cells were pre-treated with increasing concentrations of 2.5%, 5% and 10% v/v (0.25 mg DW/mL, 0.5 mg DW/mL, 1 mg DW/mL respectively) SE FAE or salicylic acid (SA) for 24 h followed by LPS stimulation for an additional 24 h, and included respective control treatments. It was previously reported that the concentrations of extract used in recent experiment are non-toxic for the J774A.1 cell line [18]. The analyzed genes included interleukin 1 beta (IL-1β), interleukin 6 (IL-6), tumor necrosis factor alpha (TNFα), monocyte chemoattractant protein-1 (MCP-1, chemokine nomenclature: C–C motif chemokine ligand 2 (Ccl2)), intercellular adhesion molecule-1 (Icam1), fatty acid binding protein 4 (Fabp4, adipocyte protein 2 (aP2), prostaglandin-endoperoxide synthase 2 (Ptgs2, cyclooxygenase-2 (COX2)), inducible NO synthase (iNOS), NADPH oxidase organizer 1 (Noxo1), interleukin 1 beta receptor antagonist (IL-1ra) and sirtuin 1 (Sirt-1). The intracellular iNOS protein levels were analyzed as well.2.2.1. The Effect of LPS-Stimulation on Inflammation Related Biomarkers in J774A.1 Macrophages
As an inflammatory agent, LPS increased transcription levels of IL-1β, IL-6, TNFα, Ccl2, Icam1 and Fabp4 by fold-changes of 182 (p < 0.001), 27 (p < 0.001), 6 (p < 0.001), 14.9 (p < 0.001), 7 (p < 0.01) and 1.9 (p < 0.001), respectively (Figure 1a–c and Figure 2a–c). Similarly, LPS-stimulated transcription of COX2, iNOS, and of Noxo1 by 18 (p < 0.001), 18 (p < 0.001), 3.4 (p < 0.05) folds, respectively, and of iNOS protein levels as well by 11.7 (p < 0.01) folds (Figure 3a–d). Concerning anti-inflammatory genes’ expression, we observed a 12- (p < 0.001) and 5-fold (p < 0.01) increase for IL-1ra and Sirt-1, respectively (Figure 4a,b).
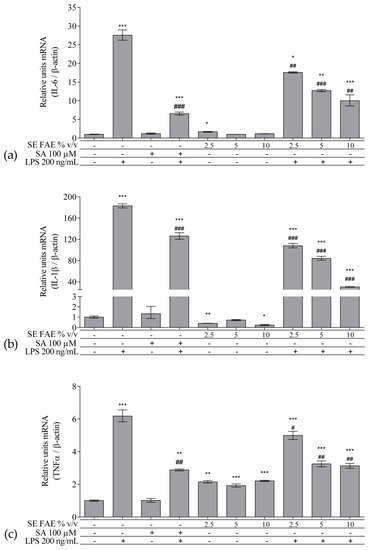
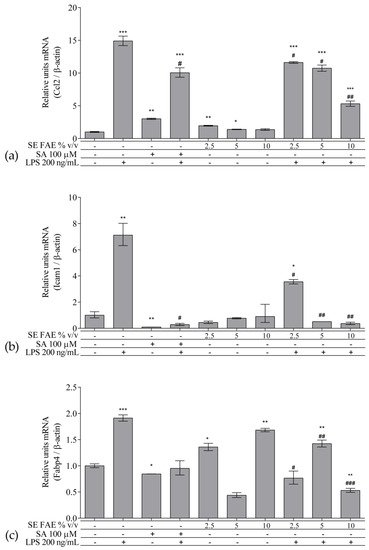
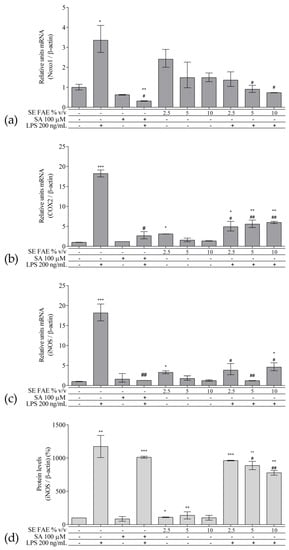
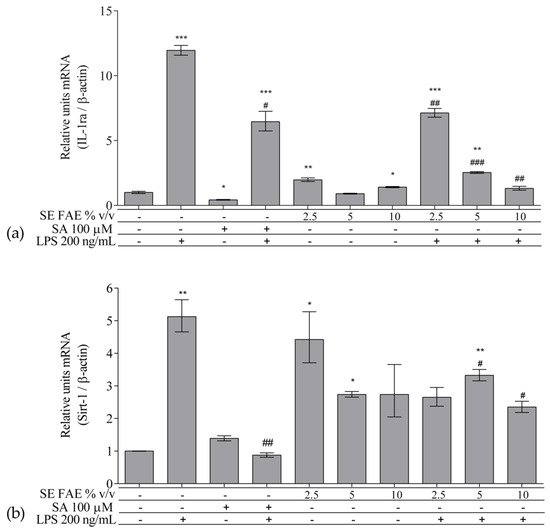
Figure 1. Changes in mRNA levels of IL-1β (a), IL-6 (b), and TNFα (c) in J774A.1 mouse macrophages pre-treated with increasing concentrations (2.5%, 5%, 10% v/v) of SE FAE or with SA for 24 h and subsequently stimulated or not with LPS. Results were obtained using qPCR technique. Data are presented as mean ± SEM. Legend: SE FAE–Sambucus ebulus L. fruit aqueous extract; SA–100 μM salicylic acid; LPS–200 ng/mL lipopolysaccharides. * p < 0.05, ** p < 0.01, *** p < 0.001 vs. untreated cells; # p < 0.05, ## p < 0.01, ### p < 0.001 vs. LPS.
Figure 2. Changes in mRNA levels of Ccl2 (a), Icam1 (b), and Fabp4 (c) in J774A.1 mouse macrophages pre-treated with increasing concentrations (2.5%, 5%, 10% v/v) of SE FAE or with SA for 24 h and subsequently stimulated or not with LPS. Results were obtained using qPCR technique. Data are presented as mean ± SEM. Legend: SE FAE–Sambucus ebulus L. fruit aqueous extract; SA–100 μM salicylic acid; LPS–200 ng/mL lipopolysaccharides. * p < 0.05, ** p < 0.01, *** p < 0.001 vs. untreated cells; # p < 0.05, ## p < 0.01, ### p < 0.001 vs. LPS.
Figure 3. Changes in mRNA levels of COX2 (a), iNOS (b), Noxo1 (c), and of protein levels of iNOS (d) in J774A.1 mouse macrophages pre-treated with increasing concentrations (2.5%, 5%, 10% v/v) of SE FAE or with SA for 24 h and subsequently stimulated or not with LPS. Results were obtained using qPCR ((a), (b) and (c)) or western blot technique (d). Data are presented as mean ± SEM. Legend: SE FAE–Sambucus ebulus L. fruit aqueous extract; SA–100 μM salicylic acid; LPS–200 ng/mL lipopolysaccharides. * p < 0.05, ** p < 0.01, *** p < 0.001 vs. untreated cells; # p < 0.05, ## p < 0.01 vs. LPS treatment.
Figure 4. Changes in mRNA levels of IL-1ra (a) and of Sirt-1 (b) in J774A.1 mouse macrophages pre-treated with increasing concentrations (2.5%, 5%, 10% v/v) of SE FAE or with SA for 24 h and subsequently stimulated or not with LPS. Results were obtained using qPCR technique. Data are presented as mean ± SEM. Legend: SE FAE–Sambucus ebulus L. fruit aqueous extract; SA–100 μM salicylic acid; LPS–200 ng/mL lipopolysaccharides. * p < 0.05, ** p < 0.01, *** p < 0.001 vs. untreated cells; # p < 0.05, ## p < 0.01, ### p < 0.001 vs. LPS treatment.
2.2.2. The Effect of SE FAE on Inflammation-Related Biomarkers in Non-Stimulated J774A.1 Macrophages
When applied alone, 2.5% v/v and 10% v/v SE FAE slightly reduced the gene expression of IL-1β by 60% (p < 0.01) and 77% (p < 0.05), respectively, as compared to untreated cells (Figure 1a). While 2.5% v/v of herbal extract induced the gene expression of IL-6 (by 67%, p < 0.05), TNFα (by 115%, p < 0.01), Ccl2 (by 95%, p < 0.01), and Fabp4 (by 36%, p < 0.05) (Figure 1b,c and Figure 2a,c). The higher concentration of SE FAE (5% extract) in culture media stimulated transcription of TNFα (by 92%, p < 0.001) and of Ccl2 (by 39%, p < 0.05) (Figure 1c and Figure 2a), while the highest concentration (10% extract) induced transcription of TNFα (by 121%, p < 0.001) and of Fabp4 (by 68%, p < 0.01) (Figure 1c and Figure 2c). SA, applied alone, similarly to SE FAE, it enhanced transcription levels of Ccl2 (by 200%, p < 0.01), but in contrast with SE FAE, it slightly reduced those of Icam1 (by 91%, p < 0.01) and of Fabp4 (by 16%, p < 0.05) (Figure 2a–c), while no significant effects on IL-1β, IL-6 and TNFα transcription levels were observed (Figure 1a–c).
The treatment with 2.5% v/v of SE FAE alone significantly induced the transcription levels of COX2 (by 210%, p < 0.05) and of iNOS (by 230%, p < 0.05) and both 2.5% v/v and 5% v/v of the extract induced iNOS protein levels by 9% (p < 0.05) and by 38% (p < 0.01), respectively (Figure 3). No effect of SA alone was observed on the gene expression levels of all analyzed inflammation and phagocytosis-related enzymes (Figure 3).
SE FAE in concentrations of 2.5% v/v and 10% v/v induced the transcription levels of IL-1ra by 98% (p < 0.01) and 41% (p < 0.05), respectively (Figure 4a). In contrast, SA treatment reduced IL-1ra transcription by 57% (p < 0.05) (Figure 4a). Transcription of the so-called longevity gene Sirt-1 was stimulated upon 2.5% v/v and 5% v/v SE FAE treatment by 343% (p < 0.05) and by 274% (p < 0.05), respectively (Figure 4b). There was no significant effect of SA applied alone on Sirt-1 transcription levels (Figure 4b).
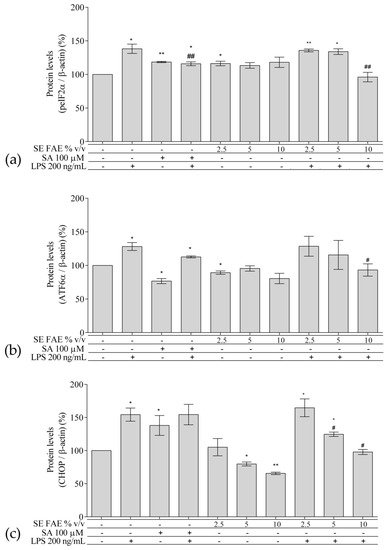
2.3. Investigation of ER Stress-Related Biomarkers in a Model of LPS-Stimulated J744A.1 Macrophages
Regarding the well-known relationship between inflammation and ER stress, we have analyzed intracellular protein levels of ER stress-related proteins: activating transcription factor 6 alpha (ATF6α), phosphorylated eukaryotic translation initiation factor 2 alpha (peIF2α), and their downstream target gene’s product C/EBP homologous protein (CHOP, growth arrest and DNA damage-inducible gene 153 (GADD153)) in a model of LPS-stimulated J744A.1 macrophages (Figure 5). Cells were pre-treated with increasing concentrations of 2.5%, 5% and 10% v/v (0.25 mg DW/mL, 0.5 mg DW/mL, 1 mg DW/mL respectively) SE FAE or SA for 24 h followed by LPS-stimulation for additional 24 h, and respective control treatments were performed as well.Figure 5. Changes in the protein levels of peIF2α (a), ATF6α (b), and CHOP (c) in J774A.1 mouse macrophages pre-treated with increasing concentrations (2.5%, 5%, 10% v/v) of SE FAE or with SA for 24 h and subsequently stimulated or not with LPS. Results were obtained using the Western blot technique. Data are presented as mean ± SEM. Legend: SE FAE–Sambucus ebulus L. fruit aqueous extract; SA–100 μM salicylic acid; LPS–200 ng/mL lipopolysaccharides. * p < 0.05, ** p < 0.01 vs. untreated cells; # p < 0.05, ## p < 0.01 vs. LPS treatment.