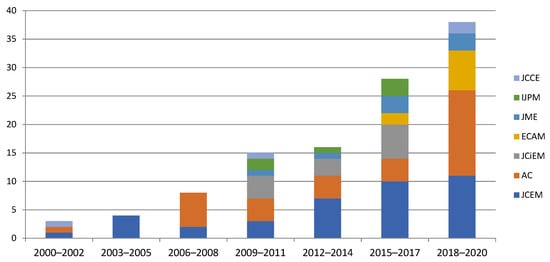
Artificial neural networks (ANN) exhibit excellent performance in complex problems and have been increasingly applied in the research field of construction management (CM) over the last few decades. This paper aims tHo provide a comprehensive understanding of the application of ANN in CM research and useful reference for the future.Content analysis is performed to comprehensively analyze 112 related bibliographic records retrieved from seven selected top journals published between 2000 and 2020. The results indicate that the applications of ANN of interest in CM research have been significantly increasing since 2015. Back-propagation was the most widely used algorithm in training ANN. Integrated ANN with fuzzy logic/genetic algorithm was the most commonly em-ployed way of addressing the CM problem. In addition, 11 application fields and 31 wever, few papers draw up a systematic review to evaluate the state-of-the-art research topics were identified, with the primary research interests focusing on cost, performance, and safetyon ANN in CM.
- artificial neural network
- construction management
1. Introduction
1. Introduction
2. Publication Trend of Research on ANN in CM from 2000 to 2020

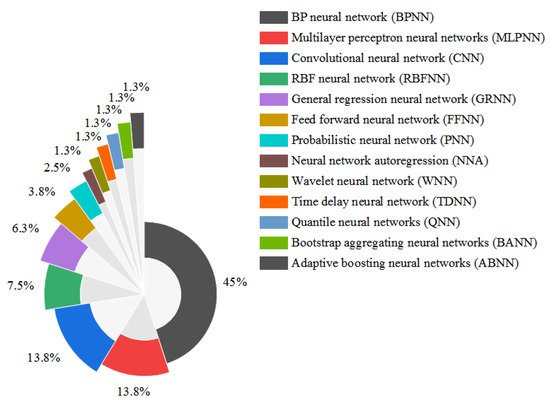
3. Types of ANN Applied in CM Research

| Type | Features | Weakness | Applicable Field |
|---|
| BPNN [10][25][26] |
Gradient descent method. Nonlinear mapping function. Self-learning and adaptive. | Problem of slow convergence, over-fitting, and local optima. | Applied to prediction and classification tasks in CM: widely used to solve problems in 11 fields; see |
| BPNN [10,51,52] |
Gradient descent method. Nonlinear mapping function. Self-learning and adaptive. | Problem of slow convergence, over-fitting, and local optima. | Applied to prediction and classification tasks in CM: widely used to solve problems in 11 fields; see |

5. Application Fields and Hot Topics on ANN in CM
| Code | Application Fields | Freq./ Percentage |
Specific Topics | Freq. | Percentage |
|---|---|---|---|---|---|
| 1 | |||||
| Table | 2 | . | |||
| Cost | 26 | 23.21% | 4. | ||
| Project cost estimation | 13 |
| Research Topics | Input Variable | Description | References | Variable Ranking | ||
|---|---|---|---|---|---|---|
| Predicting construction cost | Total construction area | Above and below ground | [35][40][42][ | 11.61% | 44] | [61,66,68,70] |
| MLPNN [12][27] |
Nonlinear mapping function. Global optimization. | Insufficient generalization ability. Poor performance in processing multidimensional data. | Applied to prediction and classification tasks in CM: claim prediction, cost prediction, classification of patent screening, classification of project decision. | |||
| MLPNN [12,53] |
Nonlinear mapping function. Global optimization. | Insufficient generalization ability. Poor performance in processing multidimensional data. | Applied to prediction and classification tasks in CM: claim prediction, cost prediction, classification of patent screening, classification of project decision. | |||
| Materials prices prediction | 5 | 4.46% | ||||
| CNN [15][28] |
Sparse connectivity and weight sharing. Suitable for high-dimensional data. | Large amount of calculation, and high requirements for input data. | ||||
| Bid price prediction | 3 | |||||
| Applied to the image field in CM: safety risk identification at construction site, sewer image defect classification, equipment tracking and monitoring. | ||||||
| CNN [15,54] |
Sparse connectivity and weight sharing. Suitable for high-dimensional data. | Large amount of calculation, and high requirements for input data. | Applied to the image field in CM: safety risk identification at construction site, sewer image defect classification, equipment tracking and monitoring. |
4. Methods Integrated with ANN Applied in CM Research
| 2.68% | ||||||||||
| Forecasting construction cost index | 2 | 1.79% | ||||||||
| 1 | Usage and service cost estimation | 2 | 1.79% | |||||||
| Maintenance cost of equipment prediction | 1 | 0.89% | ||||||||
| number of floors | Above and below ground, building height | [35][42][44] | [61,68,70] | 2 | ||||||
| project locality | Project location, location index | [40][44][45] | [66,70,71] | 3 | 2 | Performance | 18 16.07% |
Corporate performance evaluation | 5 | 4.46% |
| Facility | Interior decoration, electromechanical infrastructure | [35][44] | [61,70] | Project performance evaluation | 11 | 9.82% | ||||
| 4 | Industry performance evaluation | 2 | 1.79% | |||||||
| 3 | Safety | 13 11.61% |
Worker safety behavior assessment | 10 | 8.93% | |||||
| Accident analysis for construction safety | 2 | 1.79% | ||||||||
| Safety climate prediction | 1 | 0.89% | ||||||||
| 4 | ||||||||||
| Market conditions | Price at the beginning of the project, economic variables and indexes | [40][44] | [66,70] | 5 | ||||||
| Site conditions | Topography, ground conditions, soil condition | [35][44] | [61,70] | 6 | ||||||
| Forecasting index/price | Corresponding data in previous | Material prices in the previous five days, price index of the last two quarters, etc. | [46][47][48] | [72,73,74] | 1 | Quality | ||||
| Macroeconomic indicators | CPI, PPI, unemployment rate, GDP, foreign reserves, lending rate, etc. | 9 8.04% |
Health monitoring of construction structure | 6 | 5.36% | |||||
| Construction stability testing | 3 | 2.68% | ||||||||
| 5 | Resource | 9 8.04% |
Mechanical equipment management | 3 | 2.68% | |||||
| Material management | 2 | 1.79% | ||||||||
| Fund management | 2 | 1.79% | ||||||||
| Patent technology management | 1 | 0.89% | ||||||||
| Human resources management | 1 | 0.89% | ||||||||
| 6 | Risk | 7 6.25% |
Optimal risk allocation in projects | 3 | 2.68% | |||||
| Multi-project resource conflict risk prediction | 3 | 2.68% | ||||||||
| Prediction of financial contingency | 1 | 0.89% | ||||||||
| 7 | Contract | 6 5.36% |
Project dispute prediction and resolution | 3 | 2.68% | |||||
| Prediction of project claim | 3 | 2.68% | ||||||||
| 8 | Schedule | 6 5.36% |
Project duration and time estimation | 4 | 3.57% | |||||
| S-curve prediction, auxiliary schedule control | 2 | 1.79% | ||||||||
| 9 | Procurement | 5/4.46% | Contractor prequalification and selection | 5 | 4.46% | |||||
| 10 | Environment and sustainability | 4 3.57% |
Energy consumption evaluation | 3 | 2.68% | |||||
| Environment assessment | 1 | 0.89% | ||||||||
| 11 | Other | 9 8.04% |
Model or system development | 7 | 6.25% | |||||
| Trend forecast | 2 | 1.79% |
