Your browser does not fully support modern features. Please upgrade for a smoother experience.
Please note this is a comparison between Version 2 by Jason Zhu and Version 4 by Jason Zhu.
Recently, the classification of fatty liver and the definition for non-alcoholic fatty liver disease (NAFLD) have been challenged. Herein, this research aims to evaluate the burden of hepatic fibrosis in the missed and added populations following the proposal of the new definition of metabolic dysfunction-associated fatty liver (MAFLD) in a health check-up cohort.
- metabolic dysfunction-associated fatty liver
- magnetic resonance elastography
- non-alcoholic fatty liver disease
- significant fibrosis
- advanced fibrosis
1. Introduction
Traditionally, fatty liver (FL) has been divided into alcoholic FL associated with a significant alcohol intake and non-alcoholic fatty liver disease (NAFLD) that occurs without a significant alcohol intake. Recently, metabolic dysfunction-associated fatty liver disease (MAFLD) has been proposed as an alternative term for NAFLD [1]. MAFLD emphasizes the metabolic risk as an underlying pathophysiology, as reflected in its definition. Additionally, the MAFLD definition is not exclusive to subgroups of patients who share both metabolic risk and non-NAFLD etiologies. Therefore, it is challenging to classify FL according to the newly proposed MAFLD definition, which requires consideration of both metabolic risk and other etiologies previously not included in the definition of NAFLD.
The shift of the definition from NAFLD to MAFLD has not reached a consensus, and its impact should be evaluated in real-life practice. In particular, its impact on the transition of hepatic fibrosis according to the change in the definition has not been fully assessed. Data estimating fibrosis using an appropriate method in a large cohort are still limited. To date, six cross-sectional studies have compared the fibrosis burden between NAFLD and MAFLD in community-based cohorts [2][3][4][5][6][7]. However, little is known about the prevalence and characteristics of populations compatible with the previous definition of NAFLD, but are now excluded from the new MAFLD definition (missed population). Additionally, there is limited information regarding those who were previously not considered to have NAFLD but have been newly included in the MAFLD definition (added population). Understanding the hepatic fibrosis burden in the added and missed populations in MAFLD is important. However, most previous studies based on the general population used predictive models for hepatic fibrosis, such as the Fibrosis-4 or NAFLD fibrosis score, rather than actual fibrosis measurements [2][3][6]. Hence, they may have overestimated the fibrosis burden, especially in MAFLD with an alcohol-related etiology. Moreover, the number of individuals in the NAFLD-only or MAFLD-only groups was not sufficiently large to adequately compare their characteristics, even in studies that used transient elastography for the fibrosis measurement [4][5].
2. Baseline Characteristics of the Entire Population
A total of 6775 subjects was included in the study (Table 1). Males were more prevalent in our cohort (80.6%). The mean age of the participants was 46.8 years. The prevalence of hypertension, type 2 diabetes, and metabolic syndrome was 28%, 8%, and 22.4%, respectively. The proportion of significant and advanced fibrosis was 8.2% and 2.2%, respectively.
Table 1. Baseline characteristics of patients who underwent MRE and abdominal ultrasound during health check-ups, according to the definitions of NAFLD and MAFLD.
| Characteristics | Total (n = 6775) |
Control (n = 2628) |
Neither NAFLD nor MAFLD (n = 46) |
NAFLD (n = 2483) |
NAFLD Only (n = 148) |
MAFLD Only (n = 686) |
Both NAFLD and MAFLD (n = 2335) |
p ‡ | p § | p ‖ |
|---|---|---|---|---|---|---|---|---|---|---|
| Age (years) † | 46.8 ± 10.3 | 46.4 ± 10.9 | 46.4 ± 10.4 | 47.4 ± 9.8 | 46.5 ± 10.2 | 46.9 ± 9.5 | 47.5 ± 9.8 | 0.875 | 0.228 | 0.636 |
| Male | 5460 (80.6) | 1941 (73.9) | 39 (84.8) | 2229 (89.8) | 116 (78.4) | 622 (90.7) | 2113 (90.5) | 0.222 | 0.487 | <0.001 |
| Hypertension | 1895 (28) | 559 (21.3) | 4 (8.7) | 916 (36.9) | 11 (7.4) | 236 (34.4) | 905 (38.8) | <0.001 | 0.230 | <0.001 |
| Type 2 diabetes | 545 (8) | 103 (3.9) | 0 (0) | 312 (12.9) | 1 (0.7) | 81 (11.8) | 320 (13.7) | 0.043 | 0.435 | <0.001 |
| Alcohol consumption (g/week) † | 94 ± 166 | 53 ± 1 | ||||||||
| 90 (13.1) | ||||||||||
| 210 (9) | ||||||||||
| 0.896 | ||||||||||
| 0.001 | ||||||||||
| 0.016 | ||||||||||
| Advanced fibrosis | ||||||||||
| 151 (2.2) | ||||||||||
| 37 (1.4) | ||||||||||
| 1 (2.2) | 58 (2.3) | 4 (2.7) | 18 (2.6) | 54 (2.3) | 0.204 | 0.663 | 0.957 |
3. Distribution of Fatty Liver According to NAFLD and MAFLD Definitions
In our cohort, the prevalence of sonographic FL was 47.4%. Among the subjects with FL, nearly 72.7% were compatible with both NAFLD and MAFLD definitions (Figure 2). However, only 77% of these subjects were compatible with the NAFLD definition, whereas over 94% of subjects with FL were compatible with the MAFLD definition. The proportion of subjects with FL belonging to the NAFLD-only group and the MAFLD-only group, according to the new MAFLD definition, was 4.6% and 21.3%, respectively. In the entire population, the prevalence of the NAFLD-only group was 2.2%, whereas subjects in the MAFLD-only group constituted 10.1% of the entire population (Figure 1). The MAFLD-only group had the following coexisting liver diseases: alcohol-related (significant alcohol consumption) (71.9%), hepatitis B (23.9%), hepatitis C (0.4%), and both alcohol and viral hepatitis (2.8%) (Figure 2).
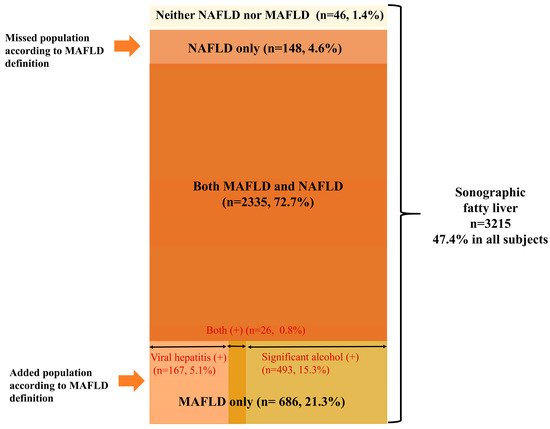
Figure 2. Venn diagram representing the prevalence of fatty liver disease in the community-based cohort, according to the definition of NAFLD and MAFLD. Abbreviations: MAFLD, metabolic-associated fatty liver disease; NAFLD, non-alcoholic fatty liver disease.
Interestingly, 1.4% of subjects with FL met neither the NAFLD nor the MAFLD criteria. Neither the NAFLD nor MAFLD group was metabolically healthy; 80.4% (36/46) of subjects had significant alcohol intake, 17.4% (8/46) also had HBV, and 2.2% (1/46) had both viral and significant alcohol intake (data not shown).
4. Clinical Characteristics of the MAFLD-Only Group (Added Population)
The proportion of the MAFLD-only group among the subjects with FL was considerable (21.3%). Except for the amount of alcohol consumption, there were no significant differences in BMI, waist circumference, and the weight-adjusted lean mass between the NAFLD and MAFLD group and the MAFLD-only group. The proportion of significant fibrosis (≥F2) was considerably higher in the MAFLD-only group than in the NAFLD and MAFLD group (13.1% vs. 9.0%, p = 0.001), and the NAFLD-only group (missed population) (13.1% vs. 6.1%, p = 0.016) (Figure 3A). However, the prevalence of advanced fibrosis (≥F3) did not differ among the NAFLD and MAFLD group, NAFLD-only group, and MAFLD-only group (Figure 3B). The total fat mass was higher in the MAFLD-only group than that in the NAFLD-only group (21.6 ± 5.7 kg vs. 13.6 ± 2.7 kg, p < 0.001). In contrast, the weight-adjusted lean body mass in the MAFLD-only group was significantly lower than that in the NAFLD-only group (67% vs. 72.5%, p < 0.001) and the control group (67% vs. 70.1%, p < 0.001).
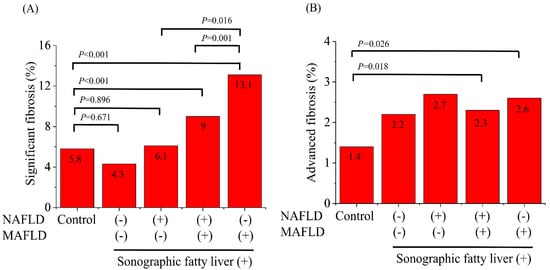
Figure 3. The prevalence of significant fibrosis (≥3.0 kPa) (A) and advanced fibrosis (≥3.6 kPa) (B) on magnetic resonance elastography among the healthy controls, and those with neither NAFLD nor MAFLD, NAFLD only, both NAFLD and MAFLD, and MAFLD only. Abbreviations: MAFLD, metabolic-associated fatty liver disease; NAFLD, non-alcoholic fatty liver disease.
5. Clinical Characteristics of the NAFLD-Only Group (Missed Population)
The proportion of the NAFLD-only group (missed population) among the subjects with FL was only 4.6%. There were no significant differences in BMI, waist circumference, and the weight-adjusted lean mass between the NAFLD-only group and neither the NAFLD nor MAFLD groups. The fibrotic burden was also similar between the two groups. Moreover, the prevalence of significant fibrosis and advanced fibrosis was similar between the NAFLD-only group and the healthy control group. Additionally, the NAFLD-only group showed better profiles of anthropometric data, including a lower BMI and total fat mass, than the control group. The total fat mass was also lower in the NAFLD-only group than the healthy control group (13.6 ± 2.7 kg vs. 16.2 ± 4.7 kg, p < 0.001). In contrast, the weight-adjusted lean mass in the NAFLD-only group was significantly higher than that in the control group (72.5% vs. 70.1%, p < 0.001).
6. Sensitivity Analysis According to Various MRE Cut-Offs
The prevalence of hepatic fibrosis at various cut-off values was compared (Table 2), following the sensitivity analysis for the other MRE cut-offs. When ≥3.4 kPa was used as the cut-off for significant fibrosis (≥F2) [8], the groups compatible with the MAFLD definition, regardless of the NAFLD definition, showed a significantly higher proportion of significant fibrosis compared to the healthy controls. Moreover, the MAFLD-only group showed a higher prevalence of significant fibrosis when compared with the control group (4.7% vs. 1.9%, p < 0.001). In contrast, the prevalence of significant fibrosis was not different between the NAFLD-only group and the healthy controls. When ≥3.8 kPa was used as the cut-off for advanced fibrosis (≥F3) [8], the proportion of subjects with advanced fibrosis was significantly higher in both the NAFLD and MAFLD groups (1.9% vs. 0.9%, p = 0.003) (data not shown) and the MAFLD-only group (1.9% vs. 0.9%, p = 0.029) compared to the healthy control group. However, the prevalence of advanced fibrosis between the NAFLD-only group and healthy controls was comparable. The MAFLD-only group alone showed a significantly higher fibrotic burden compared to the healthy control group, regardless of the MRE cut-off.
Table 2.
The prevalence of hepatic fibrosis at various cut-off values.
| Cut-Off Values (KPa) |
Total (n = 6775) |
Control (n = 2628) |
NAFLD Group (n = 2483) |
NAFLD-Only Group (n = 148) |
MAFLD-Only Group (n = 686) |
p † | p ‡ | p § | p ‖ | ||||||||
|---|---|---|---|---|---|---|---|---|---|---|---|---|---|---|---|---|---|
| ≥3.0 | 554 (8.2) | 153 (5.8) | 219 (8.8) | 9 (6.1) | 90 (13.1) | 0.896 | 0.001 | 0.016 | <0.001 | ||||||||
| ≥3.2 | 340 (5) | 84 (3.2) | 136 (5.5) | 6 (4.1) | 54 (7.9) | 0.556 | 0.019 | 0.103 | <0.001 | ||||||||
| ≥3.4 | 220 (3.2) | 51 (1.9) | 91 (3.7) | 5 (3.4) | 32 (4.7) | 0.226 | 0.230 | 0.491 | <0.001 | ||||||||
| ≥3.6 | 151 (2.2) | 37 (1.4) | 58 (2.3) | 4 (2.7) | 18 (2.6) | 0.204 | 0.663 | 0.957 | 0.026 | ||||||||
| 335 ± 229 | 34 ± 54 | 37 ± 57 | 304 ± 248 | 34 ± 54 | 0.391 | ||||||||||||
| ≥3.8 | 111 (1.6) | 24 (0.9) | 47 (1.9) | 3 (2) | 13 (1.9) | 0.179 | 0.997 | <0.001 | <0.001 | ||||||||
| 0.915 | 0.029 | Number of metabolic risks † | 1.4 ± 1.3 | 0.9 ± 1 | 0.3 ± 0.4 | 2.1 ± 1.3 | 0.3 ± 0.5 | 2.2 ± 1.2 | 2 ± 1.2 | <0.001 | 0.654 | <0.001 | |||||
| ≥4.2 | 72 (1.1) | 17 (0.6) | 29 (1.2) | 2 (1.4) | 10 (1.5) | 0.312 | 0.542 | 0.921 | 0.035 | Metabolic syndrome | |||||||
| ≥4.6 | 1517 (22.4) | 243 (9.2) | 0 (0) | 946 (38.1) | 0 (0) | 250 (36.5) | 946 (40.5) | <0.001 | 0.427 | <0.001 | |||||||
| 46 (0.7) | 7 (0.3) | 16 (0.6) | 0 (0) | 8 (1.2) | 0.53 | 0.163 | BMI (kg/m2) † | 24.8 ± 3.2 | 23.4 ± 2.6 | 21.8 ± 0.8 | 26.4 ± 3 | 21.6 ± 1.1 | 26.6 ± 2.8 | 26.7 ± 2.8 | <0.001 | 0.076 | <0.001 |
| 0.187 | 0.002 | Waist circumference (cm) † | 85.3 ± 9.1 | 81.2 ± 8.1 | 79.3 ± 5.3 | 90 ± 7.6 | 78.9 ± 5.1 | 90.6 ± 7.3 | 90.7 ± 7.2 | 0.001 | 0.085 | <0.001 | |||||
| Total fat mass (kg) † | 18.5 ± 5.8 | 16.2 ± 4.8 | 13.6 ± 2.6 | 21 ± 5.7 | 13.6 ± 2.7 | 21.6 ± 5.7 | 21.5 ± 5.5 | <0.001 | 0.020 | <0.001 | |||||||
| Lean mass (kg) † | 49.1 ± 8.9 | 46.9 ± 8.6 | 44.9 ± 8.2 | 51.8 ± 8.3 | 45.2 ± 6.5 | 52.4 ± 8 | 52.2 ± 8.2 | 0.022 | 0.082 | <0.001 | |||||||
| Lean mass * 100/BW | 68.6 | 70.1 | 70.5 | 67.1 | 72.5 | 67 | 66.8 | <0.001 | 0.563 | <0.001 | |||||||
| SBP (mmHg) † | 116 ± 13 | 114 ± 13 | 112. ± 11 | 119 ± 13 | 113 ± 10 | 117 ± 13 | 119 ± 13 | 0.234 | 0.006 | <0.001 | |||||||
| DBP (mmHg) † | 74 ± 9 | 73 ± 9 | 71 ± 7 | 76 ± 9 | 72 ± 7 | 75 ± 9 | 77 ± 9 | 0.103 | 0.015 | <0.001 | |||||||
| AST (IU/L) † | 30 ± 19 | 26 ± 13 | 27 ± 9 | 34 ± 22 | 29 ± 22 | 34 ± 25 | 34 ± 22 | 0.016 | 0.846 | 0.022 | |||||||
| ALT (IU/L) † | 32 ± 33 | 23 ± 21 | 27 ± 16 | 41 ± 35 | 28 ± 26 | 42 ± 46 | 42 ± 36 | 0.006 | 0.463 | <0.001 | |||||||
| GGT (U/L) † | 55 ± 84 | 43 ± 54 | 43 ± 45 | 72 ± 112 | 57 ± 142 | 62 ± 63 | 73 ± 110 | 0.007 | 0.023 | 0.559 | |||||||
| Triglyceride (mg/dL) † | 142 ± 113 | 112 ± 76 | 102 ± 52 | 181 ± 129 | 105 ± 55 | 180 ± 160 | 186 ± 131 | 0.314 | 0.815 | <0.001 | |||||||
| HDL (mg/dL) † | 53 ± 12 | 59 ± 13 | 55 ± 11 | 48 ± 10 | 56 ± 12 | 48 ± 10 | 48 ± 10 | 0.772 | 0.465 | <0.001 | |||||||
| Glucose (mg/dL) † | 98 ± 20 | 94 ± 16 | 92 ± 7 | 103 ± 24 | 92 ± 9 | 103 ± 24 | 104 ± 24 | 0.051 | 0.657 | <0.001 | |||||||
| Liver stiffness (kPa) † | 2.34 ± 0.56 | 2.26 ± 0.51 | 2.36 ± 0.4 | 2.38 ± 0.54 | 2.26 ± 0.51 | 2.43 ± 0.62 | 2.38 ± 0.54 | 0.99 | 0.014 | 0.002 | |||||||
| Significant fibrosis | 554 (8.2) | 153 (5.8) | 2 (4.3) | 219 (8.8) | 9 (6.1) |
7. Conclusion
In conclusion, 94% of sonographic FL cases were compatible with the newly proposed MAFLD definitions. The fibrosis burden of the NAFLD-only group (missed population) was low and was similar to that of the healthy control group. An additional one-tenth of the population with a higher metabolic and fibrosis burden was also compatible with the MAFLD definition.
References
- Eslam, M.; Sanyal, A.J.; George, J.; International Consensus, P. MAFLD: A Consensus-Driven Proposed Nomenclature for Metabolic Associated Fatty Liver Disease. Gastroenterology 2020, 158, 1999–2014.e1991.
- Huang, J.; Kumar, R.; Wang, M.; Zhu, Y.; Lin, S. MAFLD criteria overlooks a number of patients with severe steatosis: Is it clinically relevant? J. Hepatol. 2020, 73, 1265–1267.
- Lin, S.; Huang, J.; Wang, M.; Kumar, R.; Liu, Y.; Liu, S.; Wu, Y.; Wang, X.; Zhu, Y. Comparison of MAFLD and NAFLD diagnostic criteria in real world. Liver Int. 2020, 40, 2082–2089.
- Yamamura, S.; Eslam, M.; Kawaguchi, T.; Tsutsumi, T.; Nakano, D.; Yoshinaga, S.; Takahashi, H.; Anzai, K.; George, J.; Torimura, T. MAFLD identifies patients with significant hepatic fibrosis better than NAFLD. Liver Int. 2020, 40, 3018–3030.
- Ciardullo, S.; Perseghin, G. Prevalence of NAFLD, MAFLD and associated advanced fibrosis in the contemporary United States population. Liver Int. 2021, 41, 1290–1293.
- Sun, D.-Q.; Jin, Y.; Wang, T.-Y.; Zheng, K.I.; Rios, R.S.; Zhang, H.-Y.; Targher, G.; Byrne, C.D.; Yuan, W.-J.; Zheng, M.-H. MAFLD and risk of CKD. Metabolism 2021, 115, 154433.
- Zheng, K.I.; Sun, D.Q.; Jin, Y.; Zhu, P.W.; Zheng, M.H. Clinical utility of the MAFLD definition. J. Hepatol. 2021, 74, 989–991.
- Xiao, G.; Zhu, S.; Xiao, X.; Yan, L.; Yang, J.; Wu, G. Comparison of laboratory tests, ultrasound, or magnetic resonance elastography to detect fibrosis in patients with nonalcoholic fatty liver disease: A meta-analysis. Hepatology 2017, 66, 1486–1501.
More