Nowadays, the detection of VOCs at trace level (down to ppb) is feasible by exploiting ultra-sensitive and highly selective chemoresistors, especially in the field of medical diagnosis. By coupling Metal Oxide Semiconductors (MOS e.g. SnO2, ZnO, WO3, CuO, TiO2 and Fe2O3) with innovative carbon-based materials (as graphene oxide) outstanding performances in terms of sensitivity, selectivity, limits of detection, response and recovery times towards specific gaseous targets (such as ethanol, acetone, formaldehyde and aromatic compounds) can be easily achieved. Notably, carbonaceous species, highly interconnected to MOS nanoparticles, enhance the sensor responses by i) increasing the surface area and the pores content, ii) favoring the electron migration, the transfer efficiency and gas diffusion rate, iii) promoting the active sites concomitantly limiting the nanopowders agglomeration; and iv) forming nano-heterojunctions. Herein, the aim of the present work is to highlight the nanocomposites features in order to engineer novel flexible, miniaturized and low working temperature sensors, able to detect specific VOC biomarkers of a human’s disease.
- graphene oxide
- metal oxides
- gas sensing
- volatile organic compounds
- chemoresistor
- sensing mechanism
- medical diagnosis
- breakthroughs
1. Definition
A sensor can be defined as a device able to convert a target chemical or physical variation into an easily processable signal. The sensing element has to fulfill two different tasks: first, it has to interact with the target gas through various mechanisms, like surface adsorption, charge transfer or ionic exchange (receptor task); then, this interaction has to be transformed into a signal, as a change in the electrical conductivity or in optical transmission (transducer task). There is a variety of sensing devices that rely on different chemical or physical phenomena, among which we can find chemoresistors that are based on variation of Metal Oxide Semiconductors (MOS) resistance upon target gas interaction. Hence, materials possessing elevated electronic, optical, mechanical features alongside with desired flexibility and lightweight are required especially for medical diagnosis [7,8][1][2]. Indeed, human’s breath is mainly composed by N2, O2, CO2, H2O, other inert gases, while the remaining small fraction consists of more than 1000 different volatile organic compounds (VOCs) at parts per million (ppm) to parts per trillion (ppt) [12,13][3][4]. Compounds with relatively high concentrations in exhaled breath include ammonia (median concentration: 833 parts-per-billion, ppb), acetone (477 ppb), ethanol (112 ppb), propanol (18 ppb) and acetaldehyde (22 ppb) [14][5]. Alongside, it is well known that many diseases are accompanied by characteristic volatile organic compounds (VOCs) emission. Therefore, their recognition can provide diagnostic clues, guide the laboratory evaluation, and affect the choice of immediate therapy.
2. Graphene Oxide-MOS Gas Sensors
Along with the exploitation of pristine graphene, another method recently explored is the coupling of the metal oxides with graphene oxide (GO) [6][7]. Due to its lower defective structure and many surface oxygen-containing functional groups if compared to Reduced Graphene Oxide (RGO), graphene oxide has not been studied as much up to now [8][9][10]. Nevertheless, GO was reported to possess excellent electrical and mechanical properties [11] and its p-type semiconductor character [12][13][14][15] can be exploited to form a p-n heterojunction with various n-type gas sensing semiconductors. Moreover, GO functionalities can be the anchor points for the controlled chemical growth of metal oxides, thus giving rise to well-integrated composite materials. Hence, in this section, we will review the main steps forward in the engineering of novel promising chemoresistors comprising the use of graphene oxide, whose performances in terms of detection limit, signal intensity, response and recovery times are listed in
Table 3.1.
A general comparison of graphene oxide (GO)-metal oxides (MOS) chemoresistors performances.
| Metal oxide@GO | Synthetic Route | VOC | Operating T (°C) | LOD (ppm) | Response at LOD (Rair/Ranalyte) | Response/Recovery Times (s) | Ref. |
|---|---|---|---|---|---|---|---|
| α-Fe2O3 | In situ fluorine directed solution process/heat treatment | Acetone | 220 | 5 | < 10.0 a | 7/8 | [75][16] |
| α-Fe2O3 | One-step low temperature hydrothermal | Ethanol | 260 | 5 | < 5.0 a | 7/6 | [76][17] |
| SnO2 | One-step electrospinning | Ethanol | 300 | 50 | 30.7 | n.d. | [77][18] |
| Hierarchical SnO2 | Electrospinning/hydrothermal | Formaldehyde | 60 | 0.25 | 6.3 | n.d. | [78][19] |
| SnO2 | Hydrothermal | Ethanol | 25 (UV) | 0.1 | 1.7 | 310/320 | [70][10] |
| SnO2-TiO2 | Solvothermal | Acetone | 200 | 0.25 | 6.3 | 10/12 | [79][20] |
| SnxTi1-xO2 | Hydrothermal | Toluene | 350 | 0.1 | < 1.2 a | 20–35/30–60 | [80][21] |
| ZnO | Chemical bath deposition | Acetone | 450 | 10 | 2.5 | ~8–12/n.d. | [81][22] |
| ZnO | Impregnation | Acetone | 240 | 1 | < 2.0 | 13/7 | [82][23] |
| ZnO | Hydrothermal | Ethanol | 25 (UV) | 0.1 | ~1.1 a | 80/90 | [83][24] |
In particular, Song et al. [16] developed an in situ fluorine directed solution process combined with heat treatment to grow highly ordered, porous α-Fe
2O
3nanorod arrays (NRAs) on graphene oxide (GO) sheets, resulting in flexible 3D nanostructures. High-magnification SEM and TEM images (
Figure 4a,b) display that both sides of GO sheets were fully covered by vertical nanorod arrays (~50 nm long and 10–20 nm wide), including the edges and wrinkle parts (see EDX analyses in2a,b) display that both sides of GO sheets were fully covered by vertical nanorod arrays (~50 nm long and 10–20 nm wide), including the edges and wrinkle parts (see EDX analyses in
Figure 4c,d). Remarkably, they observed nanopores inside the rods with sizes below 5 nm, which are believed to be beneficial for gas sensing. When tested with 50 ppm of acetone, the nanocomposite showed a high sensitivity at 220 °C, i.e., five times greater than that of pristine α-Fe2c,d). Remarkably, they observed nanopores inside the rods with sizes below 5 nm, which are believed to be beneficial for gas sensing. When tested with 50 ppm of acetone, the nanocomposite showed a high sensitivity at 220 °C, i.e., five times greater than that of pristine α-Fe
2O
3(
Figure 4e). Outstandingly, even after 50 days, a stable sensitivity was observed. Moreover, several target molecules were tested, resulting in a slightly higher selectivity towards acetone molecules. Therefore, the improved sensitivity, fast response/recovery and selectivity of the hybrid Fe2e). Outstandingly, even after 50 days, a stable sensitivity was observed. Moreover, several target molecules were tested, resulting in a slightly higher selectivity towards acetone molecules. Therefore, the improved sensitivity, fast response/recovery and selectivity of the hybrid Fe
2O
3NRAs/GO was attributed by the authors to both the highly ordered, porous structure and the synergistic effect between α-Fe
2O
3and GO.
Figure 4f reports a sketch of the possible sensing mechanism. At first, oxygen molecules adsorb on the α-Fe2f reports a sketch of the possible sensing mechanism. At first, oxygen molecules adsorb on the α-Fe
2O
3NRAs and form O
−species at the operating temperature of 220 °C. Then, acetone molecules react with O
− species, inducing a material resistance variation, which is recorded by the sensing device.species, inducing a material resistance variation, which is recorded by the sensing device.
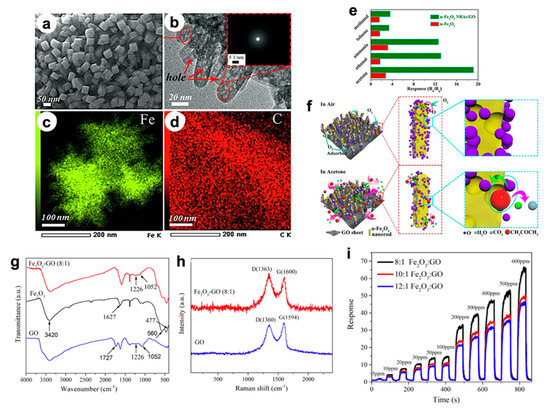
(
a) SEM and (
b) TEM images of the α-Fe
2O
3nanorods array (NRAs)/GO hybrid. Energy Dispersive X-ray spectroscopy (EDX) elemental mapping images of (
c) Fe and (
d) C species, respectively. (
e) Response of α-Fe
2O
3NRAs/GO and α-Fe
2O
3nanoparticle-based sensors toward 50 ppm of different gases, at 220 °C. (
f) Schematic illustration of the gas sensing mechanism. Reproduced with permission from [75]. Elsevier, 2019. () Schematic illustration of the gas sensing mechanism. Reproduced with permission from [16]. Elsevier, 2019. (
g) FTIR spectra of GO, Fe
2O
3, Fe
2O
3–GO (8:1) nanocomposites [76]. (–GO (8:1) nanocomposites [17]. (
h) Raman spectra of GO and Fe
2O
3–GO (8:1) samples [76]. (–GO (8:1) samples [17]. (
i) Response/recovery curves of Fe
2O
3–GO (8:1), Fe
2O
3–GO (10:1), Fe
2O
3–GO (12:1) nanocomposites towards 5–800 ppm ethanol, at 260 °C [76].–GO (12:1) nanocomposites towards 5–800 ppm ethanol, at 260 °C [17].
In addition, in Jia’s et al. work [17], the authors investigated the same nanocomposite system based on Fe
2O
3grown onto GO via one-step low temperature hydrothermal method. Both FTIR and Raman spectroscopies confirmed the effective accomplishment of the GO decoration by iron oxide nanoparticles. In particular, infrared spectra of Fe
2O
3–GO (8:1) reported in
Figure 4g show the characteristic band GO, such as C–OH stretching vibrations at 1226 cm2g show the characteristic band GO, such as C–OH stretching vibrations at 1226 cm
−1and C–O–C (epoxy) stretching modes at 1052 cm
−1; furthermore, the Fe–O vibrational absorption band at 560 and 477 cm
−1are clearly observable. In addition, Raman spectra (
Figure 4h) exhibit two characteristic peaks relative to D (~1360 cm2h) exhibit two characteristic peaks relative to D (~1360 cm
−1) and G (~1594 cm
−1) bands ascribable to the breathing mode of the
k-point photons of A
1gsymmetry and the E
2gvibration mode in GO. Notably, for the Fe
2O
3–GO (8:1), the relative D/G intensity ratio (ca. 1.07) is slightly higher than that of GO (0.94), confirming the more disordered structure of the nanocomposite, which may be due to the insertion of iron oxide nanoparticles into the GO nanosheets. Finally, the specific surface area of Fe
2O
3–GO (115 m
2g
−1) was around three times greater than that of pure iron oxide.
Figure 4i displays the dynamic response of the nanocomposites with different Fe2i displays the dynamic response of the nanocomposites with different Fe
2O
3–GO ratios towards ethanol (at 260 °C), resulting in 8:1 the best sensing material. The authors suggested that the improved performances are strictly connected, once more, to the larger surface area and incremental active sites. Hence, the results reveal that GO is crucial to improve the final gas sensing.–GO ratios towards ethanol (at 260 °C), resulting in 8:1 the best sensing material. The authors suggested that the improved performances are strictly connected, once more, to the larger surface area and incremental active sites. Hence, the results reveal that GO is crucial to improve the final gas sensing.
For what concerns the exploitation of tin dioxide material coupled with GO, several novel papers have recently been published. For instance, Seshendra Reddy et al. [18] prepared pure SnO
2using the one-step electrospinning technique and GO–SnO
2nanotubes (NTs) by dipping SnO
2NTs into a GO solution followed by a suitable annealing treatment. HRTEM images along with the relative Selected Area Electron Diffraction maps of the hybrid sample revealed the effective GO wrapping on the surface of the SnO
2NTs (
Figure 5a–d).3a–d).
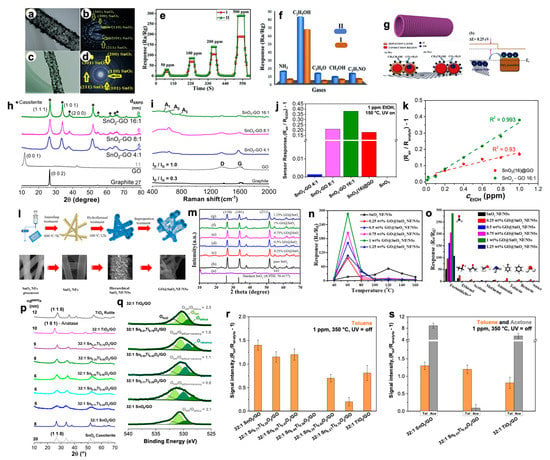
HRTEM of (
a) pristine SnO
2(I) and (
c) GO–SnO
2(II) nanotubes (NTs) along with relative (
b,
d) SAED images. (
e) Dynamic response of pristine and GO–SnO
2NTs sensors towards 50–500 ppm of at 300 °C. (
f) Comparison of sensing response to 100 ppm concentration of various gases at 300 °C. (
g) Ethanol gas sensing mechanism of GO incorporated SnO
2 NTs in different atmospheres. Reproduced with permission from [77]. Elsevier, 2019. Structural properties by (NTs in different atmospheres. Reproduced with permission from [18]. Elsevier, 2019. Structural properties by (
h) XRPD and (
i) Raman spectroscopies results relative to graphite, graphene oxide and hybrid SnO
2–GO samples. (
j) Comparison of response intensities towards 1 ppm of ethanol by adopting hybrid SnO
2–GO 4:1, 8:1 and 16:1. For comparison, gas responses acquired with pristine SnO
2and SnO
2(16)@GO (physically prepared by mixing the two powders) samples were reported. Tests carried out in simulated air (80% N
2–20% O
2) at 150 °C, under UV light. (
k) Linear correlation between sensors responses and ethanol concentration for mechanically prepared SnO
2(16)@GO and SnO
2–GO 16:1 compounds. Reproduced with permission from [70]. Elsevier, 2019. (–GO 16:1 compounds. Reproduced with permission from [10]. Elsevier, 2019. (
l) Sketch of the preparation process of GO@SnO
2 nanofiber (NF)/nanosheets (NSs) [78]. (nanofiber (NF)/nanosheets (NSs) [19]. (
m) XRD patterns of GO, SnO
2NF/NSs and GO@SnO
2 NF/NSs nanocomposites with different GO concentrations [78]. (NF/NSs nanocomposites with different GO concentrations [19]. (
n) Sensing responses toward 100 ppm of formaldehyde at different operating temperatures [78]. () Sensing responses toward 100 ppm of formaldehyde at different operating temperatures [19]. (
o) Response of the gas sensors to different test gases at their respective optimal temperature [78]. () Response of the gas sensors to different test gases at their respective optimal temperature [19]. (
p) Comparison of XRD patterns by increasing the Ti content into 32:1 Sn
xTi
1−xO
2/GO materials [80]. (/GO materials [21]. (
q) XP spectra of O 1s region relative to three 32:1 Sn
xTi
1−xO
2/GO (with
x= 0.71, 0.55 and 0.21) as representative samples. Additionally, 32:1 SnO
2/GO and TiO
2/GO were reported for comparison [80]. (/GO were reported for comparison [21]. (
r) Comparison of the response intensity of the solid solutions towards 1 ppm of toluene analyte [80]. () Comparison of the response intensity of the solid solutions towards 1 ppm of toluene analyte [21]. (
s) Comparison of the intensities at 1 ppm of toluene (orange) and acetone (grey) obtained with the most promising 32:1 SnO
2/GO, 32:1 TiO
2/GO and 32:1 Sn
0.55Ti
0.45O
2/GO samples [80]./GO samples [21].
Moreover, in their work, the influence of GO on the ethanol vapor detecting performance of SnO
2NTs was analyzed in both dry and wet atmospheres.
Figure 5e displays that the GO–SnO3e displays that the GO–SnO
2nanotubes showed good response (R
a/R
gof ca. 85) towards 100 ppm of ethanol with an optimum working temperature of 300 °C in dry atmosphere. A slight decrease in the sensor signal (ca. 52) was obtained in wet atmosphere, performing better than pristine tin dioxide nanotubes. Furthermore, it is very selective towards ethanol with respect to other gaseous species (
Figure 5f). The authors hypothesized the possible mechanism (displayed in3f). The authors hypothesized the possible mechanism (displayed in
Figure 5g), highlighting the role played by GO. Indeed, the graphene layer attached to the SnO3g), highlighting the role played by GO. Indeed, the graphene layer attached to the SnO
2 NTs is believed to enhance the surface area and provide more chemisorbed oxygen on the material surface. In addition, GO stops the agglomeration of tin dioxide nanotubes, guaranteeing a higher active surface area. This could have led to significantly enhanced gas sensing properties. A deeper investigation of the coverage of GO by tin dioxide nanoparticles and the relative ethanol sensing performances were recently evaluated by Pargoletti et al. [70]. The authors of this paper finely investigated different SnONTs is believed to enhance the surface area and provide more chemisorbed oxygen on the material surface. In addition, GO stops the agglomeration of tin dioxide nanotubes, guaranteeing a higher active surface area. This could have led to significantly enhanced gas sensing properties. A deeper investigation of the coverage of GO by tin dioxide nanoparticles and the relative ethanol sensing performances were recently evaluated by Pargoletti et al. [10]. The authors of this paper finely investigated different SnO
2–GO ratios from 4:1 to 16:1 (by a simple hydrothermal method) from different physico-chemical points of view. The structural analyses reported in
Figure 5h,i exhibit the effective gradual coverage of GO sheets by SnO3h,i exhibit the effective gradual coverage of GO sheets by SnO
2nanoparticles. Moreover, sensing tests towards ethanol species showed that 16:1 ratio is the optimal one in terms of sensitivity, higher signals intensity, good response linearity by reducing the VOC concentration (
Figure 5j,k), even with respect to mechanically prepared SnO3j,k), even with respect to mechanically prepared SnO
2–GO, namely SnO
2(16)@GO, and detection at lower operating temperatures (i.e., 150 °C, by exploiting the UV light).(16)@GO, and detection at lower operating temperatures (i.e., 150 °C, by exploiting the UV light).
In addition, Wan et al. [19] reported a formaldehyde gas sensor with highly sensitive and selective gas sensing performances at low temperatures based on graphene oxide (GO)@SnO
2nanofiber/nanosheets (NF/NSs) synthesized by electrospinning technique followed by a hydrothermal step (
Figure 5l).3l).
Figure 5m shows the XRD patterns of pristine SnO3m shows the XRD patterns of pristine SnO
2NF/NSs, GO@SnO
2NF/NSs nanocomposites and GO. Notably, the diffraction peaks of tin dioxide do not change after introducing GO nanosheets, whereas the main diffraction peaks of GO are not perceivable due to its low loading. Indeed, the sensing performances of GO@SnO
2NF/NSs nanocomposites was optimized by adjusting the loading amount of GO, ranging from 0.25% to 1.25%. The results show the optimum loading amount of 1% not only exhibited the highest sensitivity value, but also lowered the optimum operation temperature from 120 °C to 60 °C (
Figure 5n). Moreover, the GO@SnO3n). Moreover, the GO@SnO
2NF/NSs showed a lower detection limit of 0.25 ppm and an excellent selectivity (
Figure 5o). The enhanced sensing performances was believed to be mainly due to the high specific surface area, suitable electron transfer channels and the synergistic effect of the SnO3o). The enhanced sensing performances was believed to be mainly due to the high specific surface area, suitable electron transfer channels and the synergistic effect of the SnO
2 NF/NSs and GO nanosheets network.NF/NSs and GO nanosheets network.
Finally, in Kalidoss’s et al. work [20], a ternary composite based on SnO
2–TiO
2–GO materials was reported. The gas sensing properties of the as-prepared GO–SnO
2–TiO
2 nanocomposites films were investigated at the optimal temperature of 200 °C. The ternary compound exhibited superior gas sensing performances towards acetone in the range 0.25–30 ppm and was also an excellent candidate for the selective detection of this analyte in diabetes mellitus breath. As a step forward from this work, Pargoletti et al. [80] deeply investigated the coupling of SnOnanocomposites films were investigated at the optimal temperature of 200 °C. The ternary compound exhibited superior gas sensing performances towards acetone in the range 0.25–30 ppm and was also an excellent candidate for the selective detection of this analyte in diabetes mellitus breath. As a step forward from this work, Pargoletti et al. [21] deeply investigated the coupling of SnO
2–TiO
2solid solutions with GO (with 32:1 solid solution/GO weight ratio) to unravel the possible boosted selectivity of the prepared compounds towards aromatic species. A fine tuning of the Ti content into a SnO
2matrix was obtained, as clearly represented in the XRD patterns, resulting in an increased crystallinity due to a rise in particle size attained at high Ti content, i.e., at the phase transition from cassiterite-like to rutile-like crystal structure (
Figure 5p). Remarkably, with the increase in Ti amount, a higher lattice defectivity was seen, corroborated by X-ray photoelectron spectroscopy (XPS) analyses. Indeed, focusing on the O 1s region (3p). Remarkably, with the increase in Ti amount, a higher lattice defectivity was seen, corroborated by X-ray photoelectron spectroscopy (XPS) analyses. Indeed, focusing on the O 1s region (
Figure 5q), the band relative to loss of oxygen or creation of oxygen vacancies is visible in the 32:1 Sn3q), the band relative to loss of oxygen or creation of oxygen vacancies is visible in the 32:1 Sn
xTi
1−xO
2/GO nanocomposites. Notably, these compounds were revealed to be more sensitive and selective towards toluene molecules at 350 °C (Figure 5r,s). The authors hypothesized that a low titanium content limits the cross-sensitivity to relative humidity by reducing the number of rooted and terminal hydroxyl surface species with respect to both pure metal oxides, thus becoming less hydrophilic and, hence, more prone to sense non-polar molecules as toluene ones./GO nanocomposites. Notably, these compounds were revealed to be more sensitive and selective towards toluene molecules at 350 °C (3r,s). The authors hypothesized that a low titanium content limits the cross-sensitivity to relative humidity by reducing the number of rooted and terminal hydroxyl surface species with respect to both pure metal oxides, thus becoming less hydrophilic and, hence, more prone to sense non-polar molecules as toluene ones.
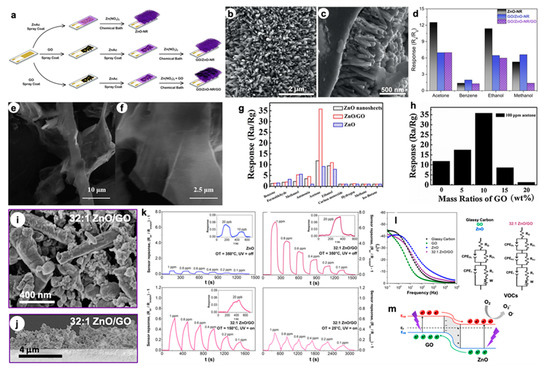
In parallel to the tin dioxide semiconductor, ZnO-based materials have also been widely studied in the gas sensing field. Vessalli et al. [21] recently described an innovative synthetic route to grow ZnO nanorods (ZnO-NR) with controlled size and morphology on gold interdigitated electrodes (IDEs) via chemical bath deposition, at mild temperatures (90 °C; see
Figure 6a).4a).
(
a) Synthetic route used to prepare ZnO-NR, GO/ZnO-NR and GO/ZnO-NR/GO samples. SEM image of (
b) GO/ZnO-NR and (
c) cross-section micrograph of the ZnO-NR arrays. (
d) Comparison of the responses of ZnO-NR, GO/ZnO-NR, and GO/ZnO-NR/GO to 200 ppm of different VOCs (at 450 °C). Reproduced with permission from [81]. Elsevier, 2016. () Comparison of the responses of ZnO-NR, GO/ZnO-NR, and GO/ZnO-NR/GO to 200 ppm of different VOCs (at 450 °C). Reproduced with permission from [22]. Elsevier, 2016. (
e,
f) FESEM images of ZnO/GO nanocomposites. (
g) Sensing responses of pure ZnO, ZnO nanosheets and ZnO/GO nanocomposites sensors to 100 ppm of different gases, at 240 °C. (
h) Responses obtained with different GO mass ratios in the ZnO/GO nanocomposites (100 ppm acetone, at 240 °C). Reproduced with permission from [82]. Elsevier, 2016. SEM image of () Responses obtained with different GO mass ratios in the ZnO/GO nanocomposites (100 ppm acetone, at 240 °C). Reproduced with permission from [23]. Elsevier, 2016. SEM image of (
i) 32:1 ZnO/GO and (
j) relative cross-sections of deposited layers [83]. () relative cross-sections of deposited layers [24]. (
k) Dynamic responses towards various ethanol concentrations, by decreasing the operating T (at 150 °C and RT, exploiting the UV light) [83]. () Dynamic responses towards various ethanol concentrations, by decreasing the operating T (at 150 °C and RT, exploiting the UV light) [24]. (
l) Electrochemical Impedance Spectroscopy (EIS) Bode plots with corresponding fitting circuits [83]. () Electrochemical Impedance Spectroscopy (EIS) Bode plots with corresponding fitting circuits [24]. (
m) Schematic model of GO-ZnO p-n junction for hybrid materials under UV and with +1.0 V applied bias (E
VB, E
CB, E
F are energies of Valence Band, Conduction Band and Fermi level) [83].are energies of Valence Band, Conduction Band and Fermi level) [24].
Furthermore, through the same technique, ZnO-GO compounds were obtained in which graphene oxide sheets can be present below (GO/ZnO-NR) or on both sides of ZnO-NR (GO/ZnO-NR/GO), like a sandwich. The morphology of the as-obtained materials was deeply studied by SEM analysis. Particularly, from the cross-section image in
Figure 6c, it is possible to determine the NRs length of about 640 nm. Conversely, the presence of GO in GO/ZnO-NR sample has led to larger diameters (4c, it is possible to determine the NRs length of about 640 nm. Conversely, the presence of GO in GO/ZnO-NR sample has led to larger diameters (
Figure 6b) and the further increase in GO (GO/ZnO-NR/GO compound) caused the coverage of the ZnO surface by the graphene material itself. These structures, then, were tested as sensors for volatile organic compounds such as acetone, benzene, ethanol and methanol in the concentration range of 10–500 ppm, at the optimal operating temperature of 450 °C (4b) and the further increase in GO (GO/ZnO-NR/GO compound) caused the coverage of the ZnO surface by the graphene material itself. These structures, then, were tested as sensors for volatile organic compounds such as acetone, benzene, ethanol and methanol in the concentration range of 10–500 ppm, at the optimal operating temperature of 450 °C (
Figure 6d). Notably, both the pure ZnO-NR and the GO/ZnO-NR/GO composite showed better selectivity towards acetone molecules, thanks to the either the peculiar morphological features or the presence of GO functional groups that favor the interaction with the target polar VOC. In addition, Wang et al. [82] finely explored the effect of GO content in the ZnO matrix on the final sensing. Specifically, both bare and phosphorus-doped ZnO nanosheets were produced by the CVD method, and GO was introduced by simple impregnation, adopting different graphene oxide amounts. FESEM micrographs reveal the presence of trigon-star like-shaped pure ZnO nanoparticles with branch lengths of around 5 μm that tend to become smooth after P doping (4d). Notably, both the pure ZnO-NR and the GO/ZnO-NR/GO composite showed better selectivity towards acetone molecules, thanks to the either the peculiar morphological features or the presence of GO functional groups that favor the interaction with the target polar VOC. In addition, Wang et al. [23] finely explored the effect of GO content in the ZnO matrix on the final sensing. Specifically, both bare and phosphorus-doped ZnO nanosheets were produced by the CVD method, and GO was introduced by simple impregnation, adopting different graphene oxide amounts. FESEM micrographs reveal the presence of trigon-star like-shaped pure ZnO nanoparticles with branch lengths of around 5 μm that tend to become smooth after P doping (
Figure 6e,f). The nanosheets lengths are around tens of micrometers, several micrometers wide and around 50 nm thick. The authors found that 10 wt% GO is the optimal loading to reach very high responses (R4e,f). The nanosheets lengths are around tens of micrometers, several micrometers wide and around 50 nm thick. The authors found that 10 wt% GO is the optimal loading to reach very high responses (R
a/R
gof around 36) towards 100 ppm of acetone (
Figure 6h). Moreover, this material seems to be the best performing one in terms of selectivity to acetone molecules, as reported in4h). Moreover, this material seems to be the best performing one in terms of selectivity to acetone molecules, as reported in
Figure 6g. The composite unique sensing properties are believed to be due to the presence of planar GO sheets, which offer an extensive 3D network, thus enhancing the interconnectivity among the ZnO nanosheets. In addition, defects and functional groups on the GO surface act as high-energy adsorption sites for the gas molecules and they can increase the final response. Nevertheless, for higher GO content (more than 10 wt%), partial ZnO nanosheets are covered by graphene oxide, affecting the active interacting area of ZnO and acetone gas. So far, studies concerning the enhancement of the sensing features mainly at high working temperatures have been reported; however, to be used in portable devices, such chemoresistors should operate at low temperature. In this context, Pargoletti et al. [83] recently described novel ZnO-GO 3D nanonetworks which are able to sense different VOCs at room temperature, by exploiting the UV light. In addition, in the present work, the authors deeply investigated the optimal ZnO/GO ratio in order to get the best sensing performances, resulting in the 32:1 ZnO salt precursor-to-GO weight ratio being the most promising one. By adopting a simple hydrothermal method, the gradual coverage of GO sheets occurred, as clearly observable in4g. The composite unique sensing properties are believed to be due to the presence of planar GO sheets, which offer an extensive 3D network, thus enhancing the interconnectivity among the ZnO nanosheets. In addition, defects and functional groups on the GO surface act as high-energy adsorption sites for the gas molecules and they can increase the final response. Nevertheless, for higher GO content (more than 10 wt%), partial ZnO nanosheets are covered by graphene oxide, affecting the active interacting area of ZnO and acetone gas. So far, studies concerning the enhancement of the sensing features mainly at high working temperatures have been reported; however, to be used in portable devices, such chemoresistors should operate at low temperature. In this context, Pargoletti et al. [24] recently described novel ZnO-GO 3D nanonetworks which are able to sense different VOCs at room temperature, by exploiting the UV light. In addition, in the present work, the authors deeply investigated the optimal ZnO/GO ratio in order to get the best sensing performances, resulting in the 32:1 ZnO salt precursor-to-GO weight ratio being the most promising one. By adopting a simple hydrothermal method, the gradual coverage of GO sheets occurred, as clearly observable in
Figure 6i, since with the lowest ratio (4:1) the characteristic GO morphology was still visible. Once synthesized, the nanopowders were deposited by an innovative hot-spray method giving rise to micrometric and highly porous (> 90%) films onto IDEs (4i, since with the lowest ratio (4:1) the characteristic GO morphology was still visible. Once synthesized, the nanopowders were deposited by an innovative hot-spray method giving rise to micrometric and highly porous (> 90%) films onto IDEs (
Figure 6j). Remarkably, only with the 32:1 ZnO/GO material was a successful signal towards different VOCs (such as acetone, ethanol and ethylbenzene) recorded down to RT by exploiting the UV light. Nevertheless, this nanocomposite showed a higher selectivity towards small and polar analytes, such as ethanol, for which 100 ppb were detectable even at RT (see4j). Remarkably, only with the 32:1 ZnO/GO material was a successful signal towards different VOCs (such as acetone, ethanol and ethylbenzene) recorded down to RT by exploiting the UV light. Nevertheless, this nanocomposite showed a higher selectivity towards small and polar analytes, such as ethanol, for which 100 ppb were detectable even at RT (see
Figure 6k). Therefore, the unique features of these hybrid compounds were finely investigated to understand their sensing mechanism. For this reason, electrochemical impedance spectroscopy (EIS) was adopted to possibly unveil the synergistic effect of GO and n-type semiconductors, like zinc oxide.4k). Therefore, the unique features of these hybrid compounds were finely investigated to understand their sensing mechanism. For this reason, electrochemical impedance spectroscopy (EIS) was adopted to possibly unveil the synergistic effect of GO and n-type semiconductors, like zinc oxide.
Figure 6l exhibits the Bode plots of both chemically obtained compounds and mechanically mixed ZnO/GO with the same 32:1 ratio. Only with the 32:1 ZnO/GO was it possible to observe the presence of a third circuit relative to the heterojunction occurrence at the interface between graphene oxide (p-type) and ZnO (n-type) materials. This p-n nano-heterojunction could lead to boosted sensing properties, since an increased electron concentration is present in the conduction band of ZnO, thus favoring a risen amount of negatively charged oxygen species adsorbed onto the sensor surface (4l exhibits the Bode plots of both chemically obtained compounds and mechanically mixed ZnO/GO with the same 32:1 ratio. Only with the 32:1 ZnO/GO was it possible to observe the presence of a third circuit relative to the heterojunction occurrence at the interface between graphene oxide (p-type) and ZnO (n-type) materials. This p-n nano-heterojunction could lead to boosted sensing properties, since an increased electron concentration is present in the conduction band of ZnO, thus favoring a risen amount of negatively charged oxygen species adsorbed onto the sensor surface (
Figure 6m). Indeed, these species are believed to be the main protagonists of the sensing mechanism, according to the already described ionosorption model [51,84].4m). Indeed, these species are believed to be the main protagonists of the sensing mechanism, according to the already described ionosorption model [25][26].
3. Conclusions and Future Outlooks
In recent decades, carbon-based materials, such as graphene, its derivatives (GO and RGO), and Carbon Nanotubes (CNTs), have been adopted as new platforms for the design of innovative metal oxide-based chemoresistors showing boosted sensing features. Indeed, thanks to their peculiar properties, such as their unique optical, electrical, mechanical, and thermal properties, they do help the sensitive, selective and lower temperature detection of VOCs. Indeed, the current research attention has been focused on the detection of ppm or even ppb concentrations of several volatile organic compounds (like ethanol, acetone, formaldehyde and aromatic compounds), since they are believed to be specific biomarkers of certain human diseases. Hence, their quick detection can represent a useful step for early medical diagnosis. Thus, in the present review, we have summarized the main breakthroughs in the engineering of nanocomposites exhibiting excellent sensing behavior in terms of optimal detection limits, selectivity towards specific VOCs, even under humid atmosphere such as a human’s breath. Nevertheless, the majority of the materials recently investigated still have some shortcomings, especially related to the high operating temperatures that hinder their application in portable devices. To overcome this issue, the solutions can include (i) the synthesis of hierarchical, highly porous 3D materials to enhance the active surface area; (ii) the formation of p-n nano-heterojunctions, helping to increase the final signals; and (iii) the exploitation of different light sources (such as UV, solar or LED ones) to activate the material enabling the sensing at low T. Figure 12 5 shows that among the investigated carbon-based hybrid chemoresistors, the above-mentioned GO in combination with MOS represent a possible candidate for detecting VOCs (constant concentration, 10 ppm) at low operating temperatures. Furthermore, thanks to their flexible structure, graphene-based materials can be easily implemented in miniaturized hand-held devices. Low temperature-operating gas sensors will persist in representing an exciting challenge in the actual era of applications demanding the use of portable systems for point of care diagnosis and so on.
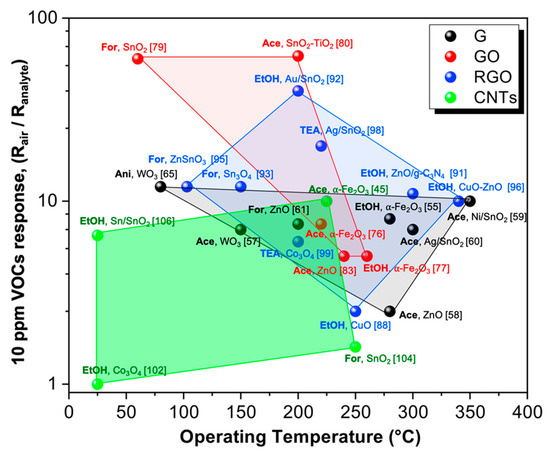
Schematic representation of sensing performances according to the relative optimal operating temperature for the four class of hybrid materials: graphene (G), graphene oxide (GO), reduced graphene oxide (RGO) and carbon nanotubes (CNTs) towards 10 ppm of several VOCs (EtOH = ethanol; Ace = acetone; For = formaldehyde; TEA = triethylamine; Ani = aniline). References have been added in brackets.
References
- Güntner, A.T.; Sievi, N.A.; Theodore, S.J.; Gulich, T.; Kohler, M.; Pratsinis, S.E. Noninvasive Body Fat Burn Monitoring from Exhaled Acetone with Si-doped WO3-sensing Nanoparticles. Anal. Chem. 2017, 89, 10578–10584.
- Cao, W. Breath Analysis: Potential for Clinical Diagnosis and Exposure Assessment. Clin. Chem. 2006, 52, 800–811.
- Han, T.; Nag, A.; Chandra Mukhopadhyay, S.; Xu, Y. Carbon nanotubes and its gas-sensing applications: A review. Sens. Actuators A Phys. 2019, 291, 107–143.
- Mukhopadhyay, R. Don’t waste your breath. Researchers are developing breath tests for diagnosing diseases, but how well do they work? Anal. Chem. 2004, 76, 273A–276A.
- Buszewski, B.; Kęsy, M.; Ligor, T.; Amann, A. Human exhaled air analytics: Biomarkers of diseases. Biomed. Chromatogr. 2007, 21, 553–566
- Gupta Chatterjee, S.; Chatterjee, S.; Ray, A.K.; Chakraborty, A.K. Graphene–metal oxide nanohybrids for toxic gas sensor: A review. Sens. Actuators B Chem. 2015, 221, 1170–1181.
- Meng, F.; Guo, Z.; Huang, X. Graphene-based hybrids for chemiresistive gas sensors. Trends Anal. Chem. 2015, 68, 37–47.
- Pei, S.; Zhao, J.; Du, J.; Ren, W.; Cheng, H.M. Direct reduction of graphene oxide films into highly conductive and flexible graphene films by hydrohalic acids. Carbon 2010, 48, 4466–4474.
- Moussa, H.; Girot, E.; Mozet, K.; Alem, H.; Medjahdi, G.; Schneider, R. ZnO rods/reduced graphene oxide composites prepared via a solvothermal reaction for efficient sunlight-driven photocatalysis. Appl. Catal. B Environ. 2016, 185, 11–21.
- Pargoletti, E.; Tricoli, A.; Pifferi, V.; Orsini, S.; Longhi, M.; Guglielmi, V.; Cerrato, G.; Falciola, L.; Derudi, M.; Cappelletti, G. An electrochemical outlook upon the gaseous ethanol sensing by graphene oxide-SnO2 hybrid materials. Appl. Surf. Sci. 2019, 483, 1081–1089.
- Tripathi, K.M.; Kim, T.; Losic, D.; Tung, T.T. Recent advances in engineered graphene and composites for detection of volatile organic compounds (VOCs) and non-invasive diseases diagnosis. Carbon 2016, 110, 97–129.
- Phan, D.T.; Chung, G.S. P-n junction characteristics of graphene oxide and reduced graphene oxide on n-type Si(111). J. Phys. Chem. Solids 2013, 74, 1509–1514.
- Yeh, T.-F.; Cihlář, J.; Chang, C.-Y.; Cheng, C.; Teng, H. Roles of graphene oxide in photocatalytic water splitting. Mater. Today 2013, 16, 78–84.
- Siyar, M.; Maqsood, A.; Khan, S.B. Synthesis of mono layer graphene oxide from sonicated graphite flakes and their Hall effect measurements. Mater. Sci. 2014, 32, 292–296.
- Peter, C.N.; Anku, W.W.; Shukla, S.K.; Govender, P.P. Theoretical studies of the interfacial charge transfer and the effect of VdW correction on the interaction energy of non-metal doped ZnO and graphene oxide interface. Theor. Chem. Acc. 2018, 137, 75.
- Song, H.; Yan, S.; Yao, Y.; Xia, L.; Jia, X.; Xu, J. 3D α-Fe2O3 nanorods arrays@graphene oxide nanosheets as sensing materials for improved gas sensitivity. Chem. Eng. J. 2019, 370, 1331–1340.
- Jia, X.; Lian, D.; Shi, B.; Dai, R.; Li, C.; Wu, X. Facile synthesis of α-Fe2O3@graphene oxide nanocomposites for enhanced gas-sensing performance to ethanol. J. Mater. Sci. Mater. Electron. 2017, 28, 12070–12079.
- Reddy, C.S.; Murali, G.; Reddy, A.S.; Park, S.; In, I. GO incorporated SnO2 nanotubes as fast response sensors for ethanol vapor in different atmospheres. J. Alloys Compd. 2020, 813, 152251.
- Wan, K.; Yang, J.; Wang, D.; Wang, X. Graphene Oxide@3D Hierarchical SnO2 Nanofiber/Nanosheets Nanocomposites for Highly Sensitive and Low-Temperature Formaldehyde Detection. Molecules 2019, 25, 35.
- Kalidoss, R.; Umapathy, S.; Sivalingam, Y. An investigation of GO-SnO2-TiO2 ternary nanocomposite for the detection of acetone in diabetes mellitus patient’s breath. Appl. Surf. Sci. 2018, 449, 677–684.
- Pargoletti, E.; Verga, S.; Chiarello, G.L.; Longhi, M.; Cerrato, G.; Giordana, A.; Cappelletti, G. Exploring SnxTi1−xO2 Solid Solutions Grown onto Graphene Oxide (GO) as Selective Toluene Gas Sensors. Nanomaterials 2020, 10, 761.
- Vessalli, B.A.; Zito, C.A.; Perfecto, T.M.; Volanti, D.P.; Mazon, T. ZnO nanorods/graphene oxide sheets prepared by chemical bath deposition for volatile organic compounds detection. J. Alloys Compd. 2017, 696, 996–1003.
- Wang, P.; Wang, D.; Zhang, M.; Zhu, Y.; Xu, Y.; Ma, X.; Wang, X. ZnO nanosheets/graphene oxide nanocomposites for highly effective acetone vapor detection. Sens, Actuators B Chem. 2016, 230, 477–484.
- Pargoletti, E.; Hossain, U.H.; Di Bernardo, I.; Chen, H.; Tran-Phu, T.; Lipton-Duffin, J.; Cappelletti, G.; Tricoli, A. Room-temperature photodetectors and VOC sensors based on graphene oxide–ZnO nano-heterojunctions. Nanoscale 2019, 11, 22932–22945.
- Tricoli, A.; Righettoni, M.; Teleki, A. Semiconductor Gas Sensors: Dry Synthesis and Application. Angew. Chem. Int. Ed. 2010, 49, 7632–7659.
- Gurlo, A. Interplay between O2 and SnO2: Oxygen ionosorption and spectroscopic evidence for adsorbed oxygen. ChemPhysChem 2006, 7, 2041–2052.