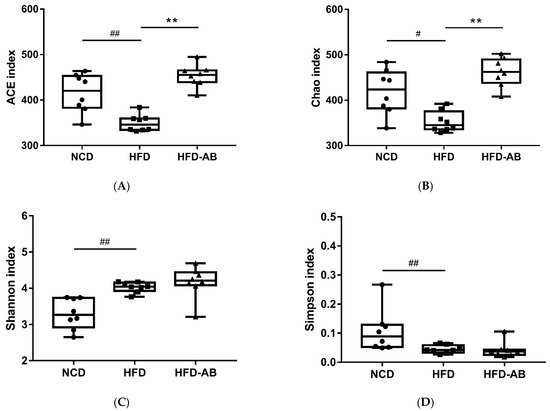
Gut microbiota affects metabolic function and is important in the development of obesity. α diversity reflects the richness and diversity of a microbial community. Community richness refers to the number of species. Community diversity is a comprehensive index of species richness and evenness. The ACE and Chao indices represent the community richness and are often used to estimate the total number of species. Simpson and Shannon indices represent the community diversity. The greater the Shannon value, the higher the community diversity, while the Simpson index is the opposite
[16]. Compared with the NCD group, HFD feeding led to significantly decreased community richness (
Figure 1A,B), and a significant increase in the community diversity (
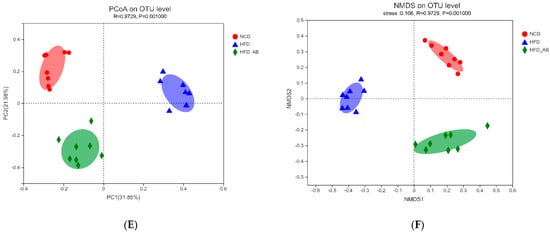
Figure 1C,D). Conversely, adzuki bean supplementation showed significantly increased community richness, but no significant change in community diversity. By using β diversity analysis based on PCoA and NMDS, the three groups formed clusters separated from each other, indicating that gut microbiota composition changed significantly in response to adzuki bean supplementation and HFD feeding (
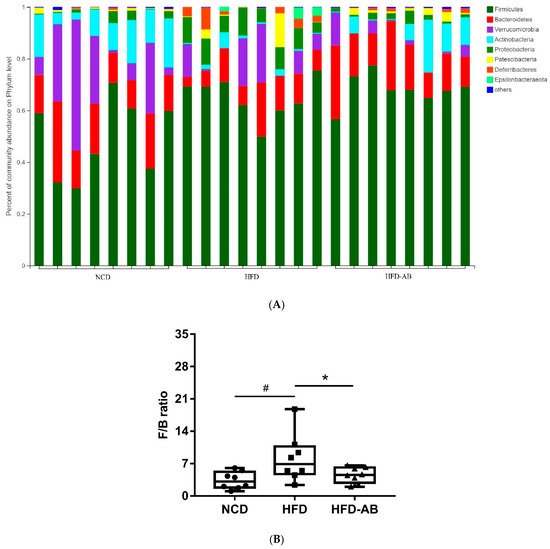
Figure 1E,F). At the phylum level,
Firmicutes,
Bacteroidetes,
Actinobacteria,
Verrucomicrobia, and
Proteobacteria were abundant (
Figure 2A). Compared with the NCD group, HFD feeding significantly increased the ratio of
F/
B, but this effect was reversed by adzuki bean supplementation (
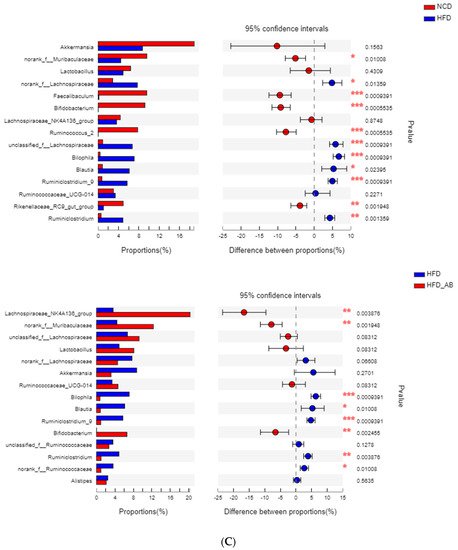
Figure 2B). At the genus level, HFD feeding significantly decreased the abundance of
Bifidobacterium and
norank_f_Muribaculaceae, and enriched
Bilophila,
Blautia,
Ruminiclostridium_9, and
Ruminiclostridium compared with the NCD group (
Figure 2C). Adzuki bean supplementation not only reversed these effects, but also significantly enriched
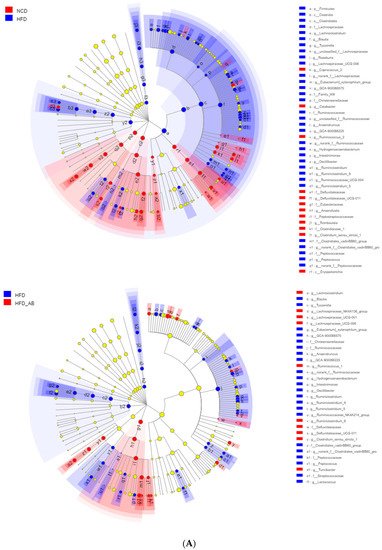
Lachnospiraceae_NK4A136_group. The cladogram corresponding to five phylogenetic levels (from phylum to genus) generated from LEfSe analysis indicates that different dietary interventions led to specific changes in the bacterial taxa (
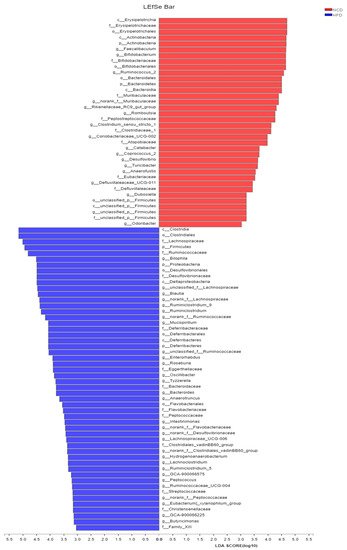
Figure 3A). Further, the LDA scores from LEfSe analysis show that HFD-fed mice were rich in
Bilophila,
Blautia,
Ruminiclostridium,
Ruminiclostridium_9, and
Desulfovibrionaceae compared with the NCD group (
Figure 3B). Adzuki bean supplementation not only reversed these effects, but also significantly enriched
Lachnospiraceae_NK4A136_group,
norank_f_Muribaculaceae,
Bifidobacterium,
Turicibacter,
Lachnoclostridium,
Prevotellaceae,
Ruminococcus_1,
Muribaculum, and
Alloprevotella (
Figure 3B).
Figure 1. Effects of adzuki bean supplementation on the α and β diversity of gut microbiota in mice (n = 8 per group). (A,B) The community richness accessed by the ACE and Chao indices, (C,D) the community diversity accessed by the Shannon and Simpson indices, and (E,F) Principal coordinate analysis (PcoA) score plot and nonmetric multidimensional scaling (NMDS) score plot based on Bray–Curtis. # p < 0.05 and ## p < 0.01, HFD compared with NCD mice. ** p < 0.01, HFD-AB compared with HFD mice. NCD, normal control diet; HFD, high-fat diet; HFD-AB, high-fat diet supplemented with adzuki bean.
Figure 2. Adzuki bean supplementation modulated gut microbiota composition (n = 8 per group). (A) The abundances of gut microbiota at the phylum level, (B) the F/B ratio, and (C) mean proportions of key genera in different groups. # p < 0.05, HFD compared with NCD mice. * p < 0.05, HFD-AB compared with HFD mice (in Figure 26B). * p < 0.05, ** p < 0.01, *** p < 0.001 (in Figure 26C). NCD, normal control diet; HFD, high-fat diet; HFD-AB, high-fat diet supplemented with adzuki bean.
Figure 3. Key phylotypes of gut microbiota. (A) Cladogram generated from LEfSe analysis showing the relationship among taxons, and (B) linear discriminant analysis (LDA > 3) scores derived from LEfSe analysis.