Immune Microenvironment of Malignant Gliomas: Comparison
Please note this is a comparison between Version 1 by Bozena Kaminska and Version 2 by Vivi Li.

Single-cell technologies allow precise identification of tumor composition at the single-cell level, providing high-resolution insights into the intratumoral heterogeneity and transcriptional activity of cells in the tumor microenvironment (TME) that previous approaches failed to capture. Malignant gliomas, the most common primary brain tumors in adults, are genetically heterogeneous and their TME consists of various stromal and immune cells playing an important role in tumor progression and responses to therapies. Previous gene expression or immunocytochemical studies of immune cells infiltrating TME of malignant gliomas failed to dissect their functional phenotypes. Single-cell RNA sequencing (scRNA-seq) and cytometry by time-of-flight (CyTOF) are powerful techniques allowing quantification of whole transcriptomes or >30 protein targets in individual cells. Both methods provide unprecedented resolution of TME. 

  • malignant gliomas
  • glioma heterogeneity
  • glioma associated microglia/macrophages
  • tumor infiltrating lymphocytes
  • single-cell RNA sequencing
  • mass cytometry
  • immunosuppression
  • immunotherapy

1. Introduction

1.1. Classification and Molecular Determinants of Gliomas

Gliomas are tumors of the central nervous system (CNS) that originate from neural stem cells, or astrocytic or oligodendrocytic progenitor cells. Diffuse gliomas represent 80% of primary malignant brain tumors. A new integrated classification system was introduced by the World Health Organization (WHO) in 2016, which comprises five glioma types categorized by both tumor morphology and molecular genetic information [1]. The largest group contains diffuse gliomas such as astrocytic tumors of the WHO grade II and III, the grade II and III oligodendrogliomas, and the grade IV glioblastomas. A separate category encompasses the WHO grade III and IV diffuse gliomas of childhood. This new classification defines as a separate group lower grade astrocytomas with a more circumscribed growth pattern, lack of IDH1/2 (isocitrate dehydrogenase 1 coding genes) alterations, and frequent mutations of BRAF (v-raf murine sarcoma viral oncogene homolog B1 coding for serine/threonine kinase) (i.e., in pilocytic astrocytoma, pleomorphic xanthoastrocytoma) or TSC1/TSC2 (tuberous sclerosis complex 1/2 encoding hamartin and tuberin) (in subependymal giant cell astrocytoma). Restructuring of the diffuse gliomas classification revealed new subtypes including IDH-wildtype glioblastoma, IDH-mutant glioblastoma, and H3 K27M-mutant diffuse midline glioma [2].
The IDH1 gene encodes an isocitrate dehydrogenase 1 which catalyzes the oxidative decarboxylation of isocitrate to α-ketoglutarate (α-KG). Mutations in IDH1/IDH2 result in the substitution of arginine at codon 132 of the IDH1 or codons 140 or 172 of the IDH2 (IDH1-R132, IDH2-R140 or IDH2-R172). IDH1-R132 mutants have dominant-negative, inhibitory effects on a wild-type IDH1, and gain new functions as they reduce α-KG to its (R)-enantiomer of 2-hydroxyglutarate (2-HG). Accumulation of 2-HG in cancer cells inhibits Jumonji class histone demethylases and TET (ten-eleven translocation) family of 5-methylcytosine DNA demethylases (reviewed in [3]). These events result in altered histone methylation and the hypermethylation phenotype [4]. More than 70% of WHO grade II and III diffuse gliomas are IDH1-R132 mutants. 
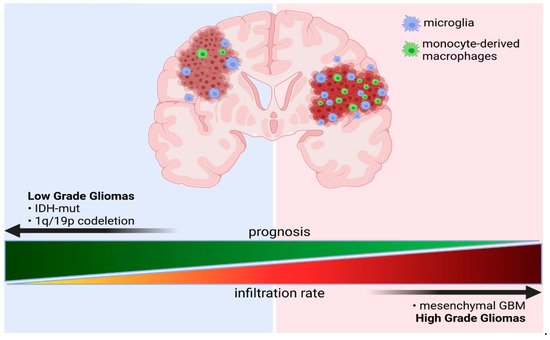
IDH1/2 mutations in some gliomas are associated with longer survival and better responses to chemotherapy [5][6][5,6]. Glioblastomas (GBM), divided into an IDH-wildtype (about 90% of cases) and IDH-mutant (about 10% of cases) GBMs, account for 70–75% of all diffuse gliomas and have a median overall survival of 14–17 months. IDH-mutant GBMs are usually secondary glioblastomas with a history of prior lower grade diffuse glioma and are more frequent in younger patients. GBMs encompass also the epithelioid glioblastoma type, giant cell glioblastoma, and gliosarcoma, which are more frequent in children and younger adults, and often harbor a BRAF V600E mutation.
Comprehensive analyses of genomic transcriptomic alterations in GBMs demonstrated the most common alterations on chromosome 7 (EGFR/MET/CDK6), chromosome 12 (CDK4 and MDM2), and chromosome 4 (PDGFRA), as well as frequent changes of genes such as SOX2MYCNCCND1, and CCNE2 [7][8][7,8]EGFR (epidermal growth factor receptor), PDGFR (platelet derived growth factor receptor), and MET (MNNG HOS transforming gene) encode receptor tyrosine kinases that control cell proliferation and survival signaling. NF1 (neurofibromathosis 1), K-RAS (KIRSTEN rat sarcoma viral oncogene homologue), and B-RAF are components of signaling pathways controlling proliferation and survival. The cell cycle regulatory protein cyclin D1 (CCND1), cyclin E2 (CCNE2), cyclin-dependent kinases 4 and 6 (CDK4/6), MDM2 (Mouse double minute 2), and transcription factors SOX2 (sex-determining region Y-box 2) and MYCN (N-MYC oncogene) control the cell cycle. Several novel mutations or gene rearrangements were found in genes involved in chromatin organization: SETD2 (Set domain containing 2), ARID2 (AT-Rich Interaction Domain 2), DNMT3A (DNA methyltransferase 3 alpha), KRAS/NRAS [9]. Aberrant expression or mutations in genes such as EGFR, NF1, and PDGFRA/IDH1 allowed the delineation of the classical, mesenchymal, and proneural GBM subtypes, respectively. A tumor transcriptional type and specific genetic alterations confer survival advantages. A weak association between the proneural GBM subtype and longer survival has been reported [10]. Correlative analyses of transcriptomic profiles showed the survival advantage of the proneural subtype, which is likely to be due to the Glioma CpG island methylator phenotype (G-CIMP). Methylation of the MGMT (O6-methylguanine–DNA methyltransferase) gene promoter (resulting in low expression of the DNA repair protein) emerged as a predictive biomarker for treatment response only in a classical GBM subtype [8][10][8,10]. The subsequent integration of various data sources, multiple methylation, and gene platforms identified new diffuse glioma subgroups in adults. The IDH-mutant non-codel lower grade gliomas (LGG) and GBM were dissected based on the genome-wide patterns of DNA methylation, into two separate subgroups (G-CIMP-low and G-CIMP-high). This dissection is important as the G-CIMP-low subset had an unfavorable clinical outcome [9].
Introduction of scRNA-seq to GBM studies revealed their considerable genetic heterogeneity and discrete functional states. Implementation of single cell RNA sequencing (scRNA-seq) to glioma studies showed the considerable intratumoral genetic heterogeneity and mosaic expression of genes coding for surface receptors and ligands, including EGFRPDGFRAPDGFAFGFR1 (fibroblast growth factor receptor 1), FGF1 (fibroblast growth factor 1), NOTCH2 (notch receptor 2), and JAG1 (jagged canonical notch ligand 1) [11]. Transcriptomic analyses revealed four meta-signatures related to hypoxia, complement/immune response, oligodendrocytes, and cell cycle. Application of the stemness signature (POU3F2SOX2SALL2OLIG2) demonstrated the presence of glioma stem cells. POU3F2 (POU Class 3 Homeobox 2), SOX2SALL2 (Spalt Like Transcription Factor 2), and OLIG2 (Oligodendrocyte transcription factor 2) encode transcription factors related to the maintenance of the stemness phenotype. Mesenchymal tumors with high expression of stemness markers (POU3F2SOX2SALL2OLIG2) had significantly worse outcome than the proneural subtype tumors [11]. Integrative studies of scRNA-seq data of GBMs, combined with genomic and bulk gene expression analyses collected in The Cancer Genome Atlas (TCGA), allowed the definition of discrete functional GBM states. Copy number amplifications of the CDK4EGFR, and PDGFRA loci and mutations in the NF1 locus define GBM states: neural progenitor-like (NPC-like), oligodendrocyte-progenitor-like (OPC-like), astrocyte-like (AC-like), and mesenchymal-like (MES-like) states. While their relative frequency varies between tumors, genetic alterations in CDK4PDGFRAEGFR, and NF1 define a predominant state [12][13][12,13]EGFR aberrations were associated with a predominance of the AC-like cells, while amplifications of CDK4 and PDGFRA were connected with the prevalence the NPC-like and OPC-like states, respectively. Chr5q deletions and NF1 alterations affected the frequency of MES-like states [12]. Collective data suggest that the molecularly distinct GBM subtypes representing various functional states have a profound impact on their microenvironment and this notion is supported by the data from mouse GBM models showing that well-defined driver mutations may create unique microenvironments [14].

2. The Complexity of the Immune Microenvironment of Malignant Gliomas

Tumor microenvironment (TME) is heterogeneous and consists of tumor cells, stromal cells, endothelial cells, innate immune cells (microglia, macrophages, neutrophils, dendritic cells, innate lymphoid cells, myeloid-derived suppressor cells (MDSCs)), NK cells, and adaptive immune cells (T cells and B cells). In addition, there are the non-cellular components of extracellular matrix, in which cells are embedded. TME plays an important role in brain tumor progression, immune tumor evasion, and responses to therapies, all of which determine patient survival [15][16][29,30]. Numerous studies have demonstrated that GBMs are infiltrated by immune cells that made up to 30% of a tumor’s mass [17][31]. The predominant population consists of glioma-associated microglia and macrophages (GAMs) and their numbers inversely correlate with patients’ survival (reviewed in [15][18][29,32]). The kinetics studies of accumulation of microglia (CD11b+CD45low) and macrophages (CD11b+CD45high) in experimental GL261 gliomas showed that microglia are first attracted to the growing tumor and macrophages are late newcomers to the glioma TME [19][33].
Such extensive accumulation of innate immune cells in gliomas might be misleading as these events do not reflect the effective anti-tumor immunity. Several mechanisms by which malignant gliomas evade elimination by the immune system include reduced expression of antigen processing and presentation proteins; recruitment of suppressor myeloid and regulatory T cells (Tregs); production of immunosuppressive factors (i.e., prostaglandins), cytokines such as TGF-β1 (transforming growth factor beta 1), and interleukin (IL-10); and up-regulation of ligands for co-inhibitory receptors (i.e., PD-L1, Programmed death-ligand 1) that reduce activities of tumor-infiltrating T lymphocytes (TILs) [20][21][34,35]. Reprogramming of glioma infiltrating microglia and macrophages into the tumor supportive, immunosuppressive phenotype (resembling to some extent the in vitro inducible M2 phenotype) has been well documented [17][22][23][24][31,36,37,38]. Microglia educated by glioma cells promote glioma invasion [25][26][27][39,40,41]. MDSCs produce IL-6 and IL-10, to support their expansion, and numerous cytokines (i.e., TGF-β) and chemokines to attract and induce Tregs. High activity of arginase 1 in MDSCs results in exhaustion of some amino acids necessary to support proliferation of T cells, while released secretory enzymes, their metabolites or membrane transporters, block T cell activation [28][42] or lead to apoptosis of T cells [29][43]. Activated DCs contribute to anti-tumor immunity by increased expression of MHC class II, costimulatory molecules and C-C chemokine receptor type 7 (CCR7), and high ability to produce cytokines [30][44]. However, GBM-derived immunosuppressive factors block DC maturation and reprogram DCs into immunosuppressive or regulatory phenotype [31][45].
GAMs isolated from GBM specimens had few innate immune functions intact, but their ability to secrete cytokines and upregulate co-stimulatory molecules is not sufficient to initiate anti-tumor immune responses [32][46]. Despite MHC II expression, GAMs lacked expression of the costimulatory molecules CD86, CD80, and CD40 critical for T-cell activation. This resulted in a lack of effector/activated T cells (glioma infiltrating T-cells were CD8+CD25–). In turn, a prominent population of regulatory CD4+ T cells (CD4+CD25+FOXP3+) infiltrating the tumor was detected [33][47]. GAMs within the tumor microenvironment release a number of immunosuppressive cytokines and promote tumor growth in a variety of ways: by priming invasion, supporting cancer stem cells, blocking the anti-tumor immunity, and favoring the genetic instability (reviewed in [15][18][29,32]).
The issue of cell heterogeneity and functional phenotypes of GAMs (isolated as CD11b+ cells from clinical GBM samples or experimental murine gliomas) and analyzed using bulk transcriptomics have been addressed in many studies, but demonstrated conflicting results [24][38]. Several studies showed the pro-tumor phenotype of GAMs (suppressive M2 phenotype of peripheral macrophages) in rodent gliomas [19][34][35][33,48,49], whereas other studies indicated mixed M1/M2-like phenotypes [36][50] or M0 phenotype in human glioblastomas [37][51]. Lineage tracing studies of mouse experimental gliomas clearly demonstrated the significant contribution of BM-derived macrophages to a pool of GAMs [38][52]. However, in the studies on GAM phenotype the immune populations were isolated as CD11b+ cells immunosorted by FACS or magnetic beads combining all myeloid cells present in GBM tissues, including cells from circulating blood. The M1/M2 classification of the macrophage states in TME is now recognized as being oversimplified. Single-cell studies provide compelling evidence that the transcriptional programs expressed by specific subpopulations of GAMs are not uniform and exhibit spatial and temporal distinctiveness. Therefore, a precise dissecting of GAMs’ heterogeneity, reflected by diverse cellular types and states, could not be resolved with classical methods.

3. Immune Microenvironment of Malignant Gliomas—Insights from Single-Cell Omics

3.1. Operating Principles of Single Cell Technologies

The heterogeneity of the immune infiltrates and specific roles of distinct subpopulations in health and disease could not be solved using traditional methods, which is particularly important in dissecting myeloid subpopulations expressing similar markers. Single-cell studies provided a breakthrough and novel insights into the diversity of immune cells in health and disease.
Single-cell RNA sequencing (scRNA-seq) permits one to determine the entire transcriptome of thousands of individual cells [39][53]. In recent years, scRNA-seq has been used to study immune cells of the brain both during development and in various CNS pathologies [40][41][42][43][44][45][46][47][54,55,56,57,58,59,60,61]. Cytometry by time-of-flight (CyTOF) utilizes monoclonal antibodies conjugated with metal isotopes, which, due to a minimal overlap between channels, allow evaluating more than 40 parameters in a single run. This method significantly outperforms classic flow cytometry analysis or multicolor flow cytometry [48][62]. Cellular indexing of transcriptomes and epitopes by sequencing (CITE-seq) combines the two approaches by application of oligonucleotide-conjugated antibodies, of which the oligonucleotide tags are sequenced in parallel with transcriptome libraries, allowing simultaneous RNA and surface protein measurements [49][63]. This relatively new method has an advantage of comparing RNA expression with protein levels that are not always corresponding [49][63]. It allows to stain a virtually unlimited number of epitopes, although only surface proteins can be targeted. Moreover, spatial transcriptomics techniques are emerging that allow visualization and a quantitative analysis of the transcriptome with spatial resolution in tissue sections. In this approach, histological sections are positioned on arrayed reverse transcription primers with unique positional barcodes and the technique allows visualization of the distribution of mRNAs within tissue sections [50][51][64,65].
In the past, more detailed understanding of the characteristics of functional phenotypes of the immune infiltrates in gliomas was hampered by the lack of reliable markers allowing for separation of specific subpopulations. In the present study, we summarized and critically assessed the current knowledge regarding the composition and functions of immune subpopulations that emerges from the single cell omics studies (Table 1).
Table 1. List of the reviewed scRNA-seq and CyTOF publications on human malignant gliomas.
References Glioma Type Species Methodology
Darmanis et al. 2017 [42]Darmanis et al. 2017 [56] IDH-wt GBMs Human scRNA-seq
Wang et al. 2017 [52]Wang et al. 2017 [66] IDH-wt GBMs, molecular GBM subtypes, paired primary and recurrent Human scRNA-seq (on tumor cells), CIBERSORT
Venteicher et al. 2017 [13] WHO grade II-IV gliomas, IDH-mut Human scRNA-seq
Müller et al. 2017 [43]Müller et al. 2017 [57] WHO grade II-IV glioma Human and mouse scRNA-seq
Neftel et al. 2019 [12] IDH-wt GBMs, pediatric and adult, primary and recurrent Human and mouse scRNA-seq
Sankowski et al. 2019 [45]Sankowski et al. 2019 [59] IDH-wt GBMs Human scRNA-seq, CyTOFF
Fu et al. 2020a [53]Fu et al. 2020a [67] WHO grade II gliomas, IDH variants, diffuse astrocytoma and oligodendroglioma Human CyTOFF
Fu et al. 2020b [54]Fu et al. 2020b [68] GBMs, IDH variants, primary and recurrent Human CyTOFF
Friebel et al. 2020 [55]Friebel et al. 2020 [69] WHO grade II-IV gliomas, brain metastases, IDH-variants Human and mouse CyTOFF
Antunes et al. 2021 [56]Antunes et al. 2021 [70] IDH-wt GBMs, primary and recurrent Human and mouse scRNA-seq, CITE-seq
Hara et al. 2021 [57]Hara et al. 2021 [71] IDH-wt GBMs, primary and recurrent Human and mouse scRNA-seq
Mathewson et al. 2021 [58]Mathewson et al. 2021 [72] GBMs, IDH variants Human and mouse scRNA-seq
Zhang et al. 2021 [59]Zhang et al. 2021 [73] WHO grade II/III glioma, 1p/19q co-deletion variants Human scRNA-seq

3.2. Functional Phenotypes of the Glioma Associated Microglia and Macrophages

GAMs consist of myeloid cells of two origins: brain-resident microglia and BM-derived macrophages. Microglia originate from hematopoietic precursors—erythromyeloid progenitors (EMP) that develop in early embryonic life in the yolk sack [60][74]. A CX3CR1+ subpopulation differentiate from EMPs giving rise to microglial progenitors which migrate to the brain starting from the embryonic day 9.5, until formation the blood-brain-barrier [61][75]. Microglia are long-living cells capable of self-renewal that is independent of the bone marrow and circulating precursors [60][62][74,76]. In contrast, infiltrating macrophages originate from circulating monocytes that renew continuously from hematopoietic stem cells (HSC) residing in the bone marrow. HSCs are capable of giving rise to all blood cell lineages such as red blood cells, lymphocytes, and myeloid cells [63][77]. Despite different ontogeny, cells of the two populations express many common surface proteins and, due to the lack of reliable discrimination markers, their specific roles in gliomagenesis has not been deciphered. Low consistency demonstrated in the GAM transcriptional signature from various bulk RNA-seq studies suggests a substantial heterogeneity of GAMs [24][38].

3.2.1. GAMs Origin and Localization Influence the Expressed Phenotype

scRNA-seq allows a transcriptome analysis in single cells of distinct cell populations and states. Müller et al. (2017) employed GAM transcriptional profiles that were derived from a genetic lineage-tracing studies [38][52] to discriminate microglia and macrophages in their scRNA-seq analysis of IDH-wt GBMs [43][57]. They determined P2RY12 (microglia) and CD49d (macrophages) as good discriminating markers, and demonstrated that although all GAMs show tumor-induced expression of human leukocyte antigen-DR (HLA-DR), its expression is higher in P2RY12- macrophages compared to P2RY12+ microglia. This is in line with a recent study demonstrating significantly increased HLA-DR levels in monocyte-derived macrophages (MDMs) versus microglia both in IDH-wt and IDH-mut gliomas [64][78]. Müller et al. (2017) have applied the identified transcriptomic signature of microglia and macrophage GAMs to estimate dominant populations across glioma anatomical regions in the dataset from the Ivy Glioblastoma Atlas Project [65][79]. Analysis of the bulk RNA-seq performed on glioma microdissected regions indicated that microglial GAMs are enriched in the leading edge and adjacent white matter, whereas macrophage GAMs show increased accumulation in the areas containing hyperplastic blood vessels, microvascular proliferation, and peri-necrosis [43][57]. Consistently, scRNA-seq on human GBM samples resected from a tumor core and tumor periphery demonstrated that macrophages (69%) predominate within the tumor core whereas microglia are most abundant at the tumor edge (86%) [42][56].
Subsequent transcriptional analysis of periphery- and core-derived samples demonstrated that GAMs in the periphery are enriched in the expression of pro-inflammatory interleukin IL1B and a number of cytokines (CCL2CCL3CCL4TNF), as well as colony-stimulating factor (CSF1) and its receptor (CSF1R). Core-derived GAMs present increased expression of pro-angiogenic VEGFA (vascular endothelial growth factor A), hypoxia-induced HIF1A (hypoxia induced factor alpha), and anti-inflammatory interleukin IL1RN [42][56]. These observations point to the importance of the tumor proximity in the tumor-induced activation, but also suggest differences in transcriptional programs expressed in microglia and macrophages. Interestingly, immune-checkpoint encoding genes CD274 (PD-L1), PDCD1LG2 (PD-L2), CD80, and CD86 (CTLA4 receptors) were expressed in both regions, with a slightly higher level in the periphery that is indicative of the immune-suppressed microenvironment [42][56].

3.2.2. Transcriptional Programs of Glioma-Associated Macrophages

Cell state can be characterized by the expressed transcriptional program, informing about specific cell function. Accumulating evidence from the single-cell studies suggests that various transcriptional programs can be expressed by the same cell type. Simultaneously, expression of one transcriptional program is not necessarily restricted to a single cell type.
Sankowski et al. (2019) performed scRNA-seq analysis of patient-derived GBM samples and normal-appearing brain tissue from epileptic brains [45][59]. Cell clusters consisting mainly of GBM-derived cells showed decreased expression of microglia core genes, and induced interferon-associated genes (IFI27IFITM3), lipid metabolism-related (LPLAPOE, TREM2), and MHC-I and -II encoding genes (HLA-A/B/C, HLA-DRB1). Additionally, the authors identified cells showing high expression of genes associated with hypoxia (HIF1AVEGFA). Surprisingly, only microglial cells were identified within the GAMs population, whereas monocytes and BM-macrophages were not distinguished. The sample size was relatively low (n = 1701 microglial cells) which could impede more detailed cell type identification and characterization of functional phenotypes. Using CyTOF, the authors confirmed the expression of HLA-DR, TREM2 (triggering receptor expressed on myeloid cells-2) and APOE (apolipoprotein E) in microglial cells (P2RY12+TMEM119+) [45][59]. Transmembrane protein 119 (TMEM119) is a reliable marker of microglia. However, expression of interferon-associated genes was not validated. Bulk transcriptomic analysis detected a type I IFN response in glioma BM-macrophages (CD49d+) but not in microglia (CD49d-) [64][78], pointing to the infiltrating GAMs as the major source of the interferon-related genes.
More detailed characterization of functional GAM phenotypes was provided in the recent scRNA-seq study on newly diagnosed (ND) and recurrent GBMs [56][70]. In line with previous reports, the authors identified three major functional transcriptomic profiles: (1) interferon-related associated with increased expression of STAT1IFIT2ISG15CXCL10; (2) phagocytosis/lipid-related showing enhanced expression of GPNMBLGALS3FABP5CD9; and (3) hypoxic characterized by induction of BNIP3ADAM8MIFHILPDA. Those signatures were found in both ND and recurrent gliomas and were recapitulated in a murine glioma model (C57BL6 mice injected intracranially with GL261 cells). However, when microglia and macrophage GAMs were compared, macrophages more strongly activated the interferon and hypoxic signatures. Importantly, the identified transcriptomic signatures are in fact differentially enriched in different cell clusters that may encompass different cell populations. For the infiltrating myeloid cells, the authors defined monocytes, transitory monocyte-macrophages, and several macrophage clusters enriched in specific transcriptional programs. Similar monocyte-to-macrophage differentiation stages were identified in another work employing the same murine model [66][80]. Interestingly, in the mouse model the interferon-related genes Rsad (encodes type I protein secretion ATP-binding protein RsaD) and Cxcl10 (encodes C-X-C motif chemokine ligand 10) also showed increased expression in the monocyte and transitory populations, whereas hypoxic and lipid/phagocytosis-related signature gene expression was augmented only in macrophages [56][70]. Interferon signaling is implicated into macrophage responses to pathogenic stimuli, known to elicit antiviral and immunoregulatory actions, and treatment with interferon has the anti-proliferative effect on tumor cells [reviewed in [67][81]. Genes of the lipid/phagocytosis-related signature were found to play tumor-supportive roles. GPNMB (glycoprotein Nmb), LGALS3 (galectin-3), and FABP5 (fatty acid binding protein 5) are implicated in inflammation, cell-matrix adhesion, and lipid metabolism, respectively. TREM2 expression was positively correlated with tumor progression, and the protein was implicated in promoting the immuno-suppressive TME [68][82]. TREM2 cooperates with CSF-1 in sustaining macrophage survival and proliferation [69][83]. ApoE is the best documented ligand of TREM2 [70][84] and CD9 is recognized as an anti-inflammatory marker of monocytes and macrophages [71][85].
Thus, interferon and lipid/phagocytosis signatures may yield opposite activities. CyTOF and scRNA-seq studies pointed to the possibility that anti-tumor monocytes migrate to tumors, where they differentiate to immunosuppressive macrophages and this transition is a consequence of tumor-induced education [55][66][69,80]. Possibly, monocyte-to-macrophage transition is connected with gradual changes of the transcriptional programs.

3.3. Immune Microenvironment of Gliomas Depends on the Tumor Genomic Background

We explored human glioma single-cell omics studies to find evidence for the assumption that distinct alterations in the genetic background dictate a specific immune TME and influence clinical outcomes. Malignant gliomas display considerable genetic and epigenetic heterogeneity, which affects patient survival and responses to therapy.
Combination of histology with molecular genotyping of key markers: IDH, ATP-dependent helicase (ATRX), Lys-27-Met mutations in histone 3 (H3K27M), TP53 mutations, and 1p/19q chromosomal deletion improved the classification of gliomas and provided some predictors of patient clinical outcome [4][72][4,86]. The transcriptional proneural, classical, and mesenchymal GBM subtypes show varied contribution of tumor-associated glial and microglial cells, and these subtypes associate with a specific TME [52][66]. Stratification of WHO grade II-IV glioma patients according to mutational burden indicates that a high number of mutations is associated with significantly worse overall survival and higher expression of immune checkpoint encoding genes [73][74][87,88]. Importantly, patients with high mutational burden showed the enrichment of immune cell signatures [75][89].
All these observations suggest a link between a genetic background of the tumor, immune cell composition, and potential responses to immunotherapies. In recent years several single-cell studies have helped to dissect the immune microenvironment of human gliomas and provided evidence for emerging associations between specific tumor somatic mutations and the composition of immune cells within glioma TME.

3.3.1. Impact of IDH Status on the Immune Microenvironment of Gliomas

The IDH mutation status emerges as a potent modulator of the infiltration of immune cells in glioma TME. Friebel et al. (2020) used a mass cytometry analysis measuring 74 parameters to delineate the myeloid and lymphoid compartment of the brain tumor microenvironment [55][69]. They showed that GAMs constitute a major immune cell population encompassing up to 80% of all immune cells in the TME. In IDH-wt gliomas monocytes-derived macrophages (MDMs) comprise around 30% of GAMs, whereas in IDH-mut gliomas such cells occur at a very low number and microglial cells dominate the GAM population (Figure 1). These results were corroborated in a bulk RNA-seq study, in which microglia (CD49dlow) and macrophages (CD49dhigh) were separated with FACS sorting [64][78]. FACS analysis also confirmed the exclusive expression of CD49d on CNS-invading myeloid cells.
Figure 1. Schematic representation of a ratio of microglia and monocyte-derived macrophages (MDMs) in gliomas of different grades and with distinct genetic backgrounds. Created with BioRender.
Exhaustion, characterized in part by the upregulation of immune checkpoints, contributes to the T-cell dysfunction in GBMs. Levels of inhibitory receptors PD-1, LAG-3/CD223 (lymphocyte activation gene 3 product), TIGIT (T cell immunoreceptor with immunoglobulin and ITIM domain), and ectonucleotidase CD39, combined with T-cell hyporesponsiveness of tumor-specific T cells, suggest poor function of tumor infiltrating lymphocytes (TILs) and confirm severe exhaustion observed in GBM [76][90]. These observations have been corroborated by the analyses of CD45+ immunosorted cells from human gliomas. Significant increases in myeloid cells in IDH-mut and IDH-wt gliomas, and lymphocytes in IDH-wt tumors, have been reported. Multicolor FACS analyses of 14 major immune cell populations across 100 clinical samples followed by RNA-seq of samples from 48 patients demonstrated the differential abundance of microglia and BM-derived macrophages in IDH-mut and IDH-wt gliomas [64][78]. Spatial analysis of tissue sections showed the enrichment of GAMs in the perivascular niche and a closer proximity of MDMs to the vessels compared with activated microglia. Consistently, examination of the transcriptomic data from the Ivy Glioblastoma Atlas Project demonstrated the enrichment of MDMs in the microvascular compartment, in which CD4+ and CD8+ T cells were found in IDH WT gliomas [64][78].
Application of CyTOF (besides dissection of microglia and BM-derived macrophages) revealed changes in other immune cell populations. Among tumor-infiltrating immune cells, Friebel et al. (2020) identified T cells (CD3+), B cells (CD19+HLA-DR+), NK cells (CD56+CD16+), neutrophils (CD66b+), two subsets of classical DCs: cDC1 (CD141+CADM1+) and cDC2 (CD1c+) plasmacytoid DCs: pDCs (CD123+), and plasma cells (CD19+, CD38high). There was no difference in the overall T cell infiltration rate between IDH variants; however, Tregs were significantly more frequent in IDH-wt gliomas and T-cell frequency positively correlated with pDCs and cDCs frequencies, whereas increased numbers of all those populations were associated with decreased GAM/monocyte frequencies [55][69]. The MGMT promoter methylation status did not change frequencies of major immune populations [55][69].
In addition to the reduced number of TILs and macrophages, IDH-mut gliomas show lower PD-L1 expression compared to IDH-wt gliomas [77][78][91,92]. A proportion of lymphocytes (T-cells, B-cells, NK cells) was low in IDH-mut gliomas (~10%), whereas in IDH-wt lymphocytes constituted 25% of all immune infiltrating cells [64][78]. Additionally, division of T cells into five functional subsets: naïve, central memory (CM), effector memory (EM), terminally differentiated effector memory (TEMRA), and non-circulating tissue-resident (RM), according to the expression of five discriminatory markers (CD45RA, CD45RO, CCR7, CD127, and CD103) [79][93], allowed assessing more subtle differences in the T cell populations. Friebel et al. (2020) reported that the majority of T cells found in GBMs were memory T cells [55][69]. CD8 RM and EM T-cells had lower expression of proliferation and activation markers in IDH1mut compared to IDH1wt gliomas. In contrast, the IDH status had no effect on expression of co-stimulatory (ICOS, CD27, and CD137) and co-inhibitory receptors (2B4, TIGIT, and PD-1) [55][69].
The oncometabolite 2-HG inhibits complement activation, complement-mediated phagocytosis, and migration of activated T-cell, their proliferation, and cytokine secretion [80][94]. Reduced PD-L1 expression might be a result of lower infiltration of PD-L1 expressing immune cells, but could emerge from epigenetic silencing of the immune checkpoint genes in glioma cells, due to 2-HG-driven DNA hypermethylation [81][82][95,96]. Studies of mouse syngeneic glioma models indicated the lower expression of cytokines in IDH-mut gliomas that might reduce leukocyte chemotaxis [78][92]. Still, the mechanism underlying lower infiltration of GAMs in IDH-mut gliomas remains to be elucidated.
Innate lymphoid cells play in anti-tumor immunity and are regulators of TME [83][97]. The analysis of NK cells (CD56+CD3-) showed that the two main populations of CD56int/brightCD16 and CD56intCD16+ correspond to the immature and the cytotoxic NK cells, respectively. The enrichment of immature CD56int/bright was found in CD16 NK cells among lymphocytes in the IDH1-wt gliomas, whereas predominantly CD56int/brightCD16+ NK cells accumulated in the IDH1-mut gliomas. Splitting of the IDH1-wt glioma cohort according to the MGMT promoter methylation showed a trend toward a higher proportion of CD56int/brightCD16+ NK cells in the unmethylated cases. Frequencies of immature NK cells negatively correlated with overall survival in the IDH1-wt cohort (but not significantly) [55][69].
Mathewson et al. (2021) investigated T-cell subtypes and expression programs across IDH variants, specifically in glioblastomas [58][72]. ScRNA-seq profiling of T cells from 26 IDH-wt and IDH-mut GBMs revealed the presence of CD8 T cells, CD4 conventional T cells (CD4 Tconv), CD4 Tregs, and cycling T cells. Interestingly, the corticosteroid therapy with dexamethasone was associated with substantially reduced numbers of infiltrating T cells (mean reduction was 4.14- and 7.72-fold for CD3+ and CD4+ T cells, respectively). The overall representation of clusters was similar in IDH-wt and IDH-mut GBMs. CD8 and CD4 T cells expressed an interferon signature, an effector memory signature, or a stress signature. The latter was not an artefact, as expression of these genes was detected by RNA in situ hybridization for glioma-infiltrating CD3E+ T cells [58][72]. T cell-specific genes (including cytotoxicity genes PRF1 (Perforin 1) and GZMA (Granzyme a) were more highly expressed in IDH-wt GBMs than IDH-mut GBMs. The cytotoxicity score of CD8 T cells (PRF1, GZMB, GZMA, GZMH, NKG7, GNLY) was associated with an increased signature of NK cells (KLRD1FGFBP2FCGR3AS1PR5KLRC1KLRC3KLRB1KLRC2). Several NK cell receptor genes, including KLRC2 (NKG2C protein), KLRC3 (NKG2E protein), KLRC1 (NKG2A protein), KLRD1 (CD94 protein), and KLRB1 (CD161 protein) were expressed by CD8 T cells with high cytotoxicity scores. These cells represent effectors that share transcriptional profiles with innate T cells, despite having a diverse TCR repertoire. High cytotoxicity of CD8 T cells correlated with lower expression of the PDCD1 gene (PD-1 protein) and genes coding for co-inhibitory receptors (CTLA4, HAVCR2, LAG3, and TIGIT). The highest level of PDCD1 was found in cytotoxic CD4 T cells, whereas TIGIT was most highly expressed by Tregs. The genes coding for the inhibitory CD161 receptor (KLRB1) and the activating NKG2C/CD94 receptor (KLRC2 and KLRD1) were expressed by a large fraction of CD8 T cells. KLRB1 was preferentially expressed by CD8 and CD4 Tconv cells in diffuse gliomas; its expression was lower in CD4 Tregs. The authors postulated that expression of NK cell receptors is induced in T cells by inflammatory mediators in the glioma TME. CLEC2D, the ligand for CD161, is a surface molecule expressed by immunosuppressive myeloid cells and malignant cells. Mechanistic in vitro and in vivo studies demonstrated that the CD161 receptor inhibits T cell function, including cytotoxicity and cytokine secretion [58][72].

3.3.2. The Effects of Co-Deletion of 1p/19q in IDH Mutant Gliomas

Venteicher et al. (2017) performed scRNA-seq analysis of IDH-mut astrocytomas (IDH-A) characterized by TP53 and ATRX mutations, and oligodendrogliomas (IDH-O) characterized by mutations in the TERT (Telomerase reverse transcriptase) gene promoter and co-deletion of chromosome arms 1p and 19q (1p/19q) [13]. The authors confirmed the genetic background of the investigated samples at single-cell level. Most genes with higher expression in cells from IDH-A were encoded in 1p/19q regions that are deleted in IDH-O, whereas TP53 targets were enriched in IDH-O as compared with TP53 mutated IDH-A. The 1p/19q region contains genes encoding potent immunoregulatory proteins including CSF1 encoded in a 1p region and TGFB1 encoded in the 19q region. CSF1 is involved in proliferation, differentiation, and survival of myeloid cells and TGFβ1 is a potent immunosuppressive cytokine. Thus, a lack of these genes might negatively influence accumulation of microglia and macrophages in glioma TME. Consistently with this notion, the estimated relative abundance of microglia/macrophages was higher in IDH-A tumors compared to IDH-O tumors [13].
A recent CyTOF study of the composition of immune infiltrates in IDH-A and IDH-O tumors showed that IDH-A have increased levels of VEGF and TGFβ that play tumor-supportive roles. However, no difference in the proportion of glioma-associated macrophages was noted [53][67]. These observations have been supported by the results of CIBERSORT deconvolution of the TCGA dataset combined with IHC staining of LGG samples, that demonstrated a lower number of “M2-related” markers in gliomas with 1p/19q co-deletion [59][73]. Co-deletion 1p/19q is a strong, good prognostic marker. Better survival of patients harboring this alteration might be related with reduced infiltration of GAMs, as deletion of the 1p region that encodes the CSF1 gene yields similar survival outcome as full 1p/19q co-deletion, whereas the effect of 19q deletion is marginal [84][98]. The identified transcriptional programs of GAMs, their functional states, and localization in GBMs are depicted in the Figure 2.
Figure 2. A summary of the identified transcriptional programs, cell states, and spatial distribution of GAMs. Created with Biorender.