Your browser does not fully support modern features. Please upgrade for a smoother experience.
Please note this is a comparison between Version 1 by JOHNY JAMES and Version 3 by Camila Xu.
Composites are generally categorized into three main categories based on the matrix substance. They are called metal matrix composite (MMC), polymer matrix composite (PMC), and ceramic matrix composite (CMC), respectively. MMC gives more elevated ductile properties than CMCs and better environmental stability than PMCs. Additionally, MMCs offer good thermal conductivity (from 220 to 580 W·m−1·K−1), wear resistance (0.01025), wear rate (g·m−1), erosion, and shear strength.
- aluminum
- composite
- microstructure
- mechanical properties
- porosity
1. Matrix Materials in MMCs
Since the day work on metal matrix composites commenced, aluminum and its alloys played a vital role as matrix materials due to the increase in demand for high-strength, lightweight components. Similarly, magnesium and titanium alloys are also employed as metal matrix material, but both have their demerits because magnesium quickly reacts with the atmosphere, so processing is complicated; as for titanium, it is highly reactive and forms inter-metallics with many reinforcement materials [1][2][11,12].
2. Applications of MMCs
Based on the statistics, most aircraft components have been replaced by composites, and a considerable amount are MMCs. Additionally, many automotive engine manufacturers already replaced forged steel with MMCs. Piston, piston ring, connecting rod, brake rotor, cylinder liner bearings, bushings, etc., are some of the components made by MMCs due to their wear resistance, high strength, specific stiffness, and fatigue strength [3][4][13,14].
3. Production of MMCs
Various processing techniques are employed in the fabrication of MMCs. They are powder metallurgy, diffusion bonding, spray co-deposition, and casting routes. The casting route is one of the most common and economical from the above fabrication techniques even though it has limitations like porosity and agglomeration defects. Stir casting is commonly acknowledged as a proven technique, presently adopted commercially as well. In addition, stir casting permits a conventional metal processing technique to be integrated or replaced; this leads to cost reduction [5][15]. Furthermore, this liquid casting method is a low cost compared to the other entire composite fabrication method [6][16] and permits huge dimensional components.
Skibo, M reported that the price of producing composites using a casting route is almost 1/3 to 1/2 of other existing routes, but for colossal size production, it may even fall to 1/10 of the cost by other methods. Even though it has few limitations, they can be overcome by using stir casing integrated with a squeeze casing unit [7][8][17,18].
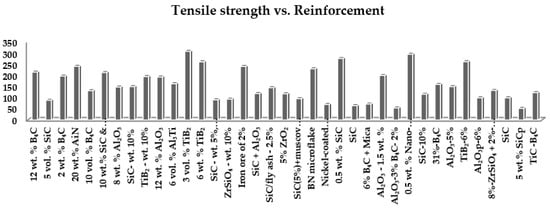
From Figure 1, the highest strength reported is by M. K Akbari et al. using metal matrix A356 reinforced with 3 vol.% TiB2 that results in 308 MPa and K. Amouri using metal matrix A356 reinforced 0.5 wt.% Nano-SiC that results in 295 MPa. The lowest strength reported is by V. Singh using aluminum alloy reinforced with 5% (weight) SiCp that results in 52.8 MPa, and B.V Ramnath using aluminum alloy reinforced with Al2O3—3% B4C—2% and achieved a tensile value of 54.6 MPa. The above experimental work listed in Table 1 shows a vast deviation in tensile strength. Various factors can cause variation in tensile strength. This work analyzes the most influential factors, i.e., wettability, uniform distribution, cluster formation, etc., in detail [21][22][23][24][25][26][27][28][29][30][31][32][33][34][35][36][37][38][39][40][41][42][43][44][45][46][47][48][49][50][51][52][53][54][55][56][31,32,33,34,35,36,37,38,39,40,41,42,43,44,45,46,47,48,49,50,51,52,53,54,55,56,57,58,59,60,61,62,63,64,65,66].
4. Various Metal Matrix and Reinforcement Phases of Advanced Composites Using Different Techniques
H. Abdizadeh processed composite using A356 aluminum alloy and ZrO2 by stir casting method. The vol.% of reinforcement varies from 5 to 15 percent, and the temperatures were 750, 850, and 950 °C, respectively. It was reported that aluminum alloy reinforced with ZrO2 particles enhanced UTS and hardness compared to A356 aluminum alloy, and its maximum values were 232 MPa and 70 BHN, respectively. For 15 vol.% of ZrO2 composition, the highest UTS, and hardness values were obtained [9][19]. Baghchesara, M. A produced composite using A356 aluminum alloy and ZrO2 by stir casting method. Various samples of 5, 10, and 15 volume percent of ZrO2 in different casting temperatures of 750, 850, and 950 °C were prepared. The maximum tensile strength was recorded in the sample having 15 vol.% ZrO2 prepared at 750 °C, which shows an enhancement of 60% compared to the aluminium-356 parent alloy. Additionally, it has been concluded that the composite fracture was severely brittle by increasing ZrO2 particle quantity and casting temperature [10][20]. M. Hajizamani fabricated composite using A356 and ZrO2 by stir casting method. In this work, nanoparticles of ZrO2 and Al2O3 were constituted to produce composites with a composition of 0.5–2 wt.% of the reinforcement. This work records that by raising the reinforcement, density reduced while yield, ultimate tensile strength (UTS), and compressive strength improved. The ductility of the composite specimens was low due to high porosity and the formation of voids. Additionally, hardness improved at one weight percent of Al2O3 and 10 weight percent of ZrO2. However, for the hardness of the specimen at 1.5–2 weight percent of Al2O3 and 10 weight percent ZrO2 again the hardness value came down [11][21]. G.Karthikeyan selected aluminum LM25 as the parent material, reinforced with 0–15% of zirconium oxide prepared by stir casting route. Wear and tensile specimens were made per ASTM G99 and ASTM B-557-M-94 standard. A surface roughness test was done on wear specimens. The test shows that a rise in ZrO2 particles percentage promotes surface roughness value [12][22]. Using the stir casting method, S. Prajval prepared a metal matrix composite by combining aluminum A356 and titanium dioxide (TiO2) with various mica percentages (1%, 2%, 3%, 4%, and 5%). It has been concluded that the UTS value is highly influenced by the percentage of mica and TiO2 present in the composite. Additionally, the UTS value is noteworthily influenced by the process of heat treatment and aging method. The hardness of the specimens increases when the reinforcement in the composite specimen increases [13][23]. T. Rajmohan studied the property of hybrid A356 metal matrix composite reinforced with mica and SiC particles. Micrographs were investigated with the help of SEM. EDX was used to study the material composition. The results showed that better hardness was obtained for the composition of 10 wt.% of SiC and 3 wt.% of mica. The rise in weight percent of mica enhances the wear-resistant property of the composite [14][24]. R. Raj processed 6061Al-B4C, the composite containing different wt.% of B4C using advanced stir casting method with bottom pouring set-up. The dispersion of particles of B4C in the aluminum matrix, interfacial characteristics, and microstructural features was qualitatively studied using an optical microscope and field emission scanning electron microscope (FESEM). Microstructural characterization revealed that the distribution of B4C in the metal matrix phase was comparatively uniform, and at some locations, small-scale agglomeration and clustering of particles were observed. Particle size distribution has been studied for the quantitative description of agglomeration of B4C particles, revealing small-scale agglomeration of particles. Homogeneity and randomness of B4C particulates across the matrix phase have been calculated by the quadrant method. The results show a random spatial distribution of particles with small-scale clustering [15][25]. B. P Beyrami fabricated composite using A356 and ZrO2 nanoparticles. Samples of composites were made at different percentages of ZrO2 (1.5, 2.5, and 5 vol.%). The casting temperatures were selected as 800–950 °C. Micrographs of composite samples were studied using scanning electron microscopy (SEM) and energy dispersive X-ray spectroscopy (EDS). Mechanical properties such as compressive yield strength, toughness, and hardness were calculated. The experimental results depict that mechanical properties like compressive yield strength and hardness are noticeably picked up by adding ZrO2 particles. The highest values were for samples containing 2.5 vol.% of particles fabricated at 850 °C [16][26]. Two sets of cast composite specimens were prepared by stir casting fixing the 10% of fly ash and varying (5% and 10%) zirconia by weight fraction. S. Malhotra et al. reported that the optimum casting conditions of the composite fabrication were attained with 10 wt.% ZrO2 and 10 wt.% fly ash. There is a considerable increase in tensile, elongation, and hardness value [17][27]. M. Ramachandra synthesized composite using Al 6061 and ZrO2 to study corrosion behavior by the stir casting process. This work reports that the corrosion rate of the parent material is higher than the cast composite, and the best property is achieved in 7.5 wt.% ZrO2 specimen [18][28]. D. M. Patoliya prepared composite using Al 6061 and ZrO2 by the stir casting process. Four specimens were prepared to vary wt.% from 0 to 7.5, keeping all other parameters the same. It is also reported that tensile strength, hardness, and impact strength have been promoted parallel to the rise in weight fraction of zirconium oxide particles in the Al 6061 matrix, but elongation decreased with increase in wt percent of ZrO2 in the Al 6061 matrix [19][29]. P. R Thyla fabricated composite using Al 6061, Gr, SiC, and ZrO2 by the stir casting process. Five different samples were prepared to study the corrosion behavior. It has been reported that the corrosion rate decreased due to the presence of ceramic particles in the matrix material. Specifically, 9% wt percent sample records a very minimum corrosion rate [20][30]. The above works of various researchers show the development of composites using aluminum alloy and various reinforcements with different particle sizes and compositions. It proves the successful development of composite. One of the main objectives of composite is to achieve high strength. Table 1 gives a detailed report of the metal matrix, reinforcement, and the tensile strength achieved.Table 1.
Various tensile strength values of developed composites.
| S.L. No | Author | Metal Matrix | % and Reinforcement | Tensile Strength in MPa | Reference |
|---|---|---|---|---|---|
| 1 | Kalaiselvan (2011) | AA6061 | 12 wt.% B4C | 215 | [21] |
| 2 | Amirkhanlou and Niroumand (2011) | A356 | 5 vol.% SiC | 89 | [22] |
| 3 | Alizadeh (2011) | Al | 2 wt.% B4C | 197 | [23] |
| 4 | Kumar (2012) | AA6061 | 20 wt.% AlN | 241 | [24] |
| 5 | Mazaheri (2013) | Pure Al | 10 vol.% B4C | 132 | [25] |
| 6 | Selvam (2013) | AA6061 | 10 wt.% SiC and 7.5 wt.% flyash | 213 | [26] |
| 7 | Kumar (2013) | A359 | 8 wt.% Al2O3 | 148 | [27] |
| 8 | James, S. J. (2014) | Al 6061 | SiC—10 wt.% | 150.1 | [28] |
| 9 | James, S. J. (2014) | Al 6061 | TiB2—10 wt.% | 195 | [29] |
| 10 | Bharath (2014) | AA6061 | 12 wt.% Al2O3 | 193 | [30] |
| 11 | Yang (2015) | A356 | 6 vol.% Al3Ti | 163 | [31] |
| 12 | Akbari (2015) | A356 | 3 vol.%TiB2 | 308 | [32] |
| 13 | Niranjan (2015) | A356 | 6 wt.% TiB2 | 261 | [33] |
| 14 | James, S (2017) | Al 6061 | SiC—5 wt.%, Al2O3—3 wt.%, TiB2—2 wt.% | 91 | [34] |
| 15 | JohnyJames, S (2017) | Al 6061 | ZrSiO4—10 wt.% | 94 | [35] |
| 16 | Ansar Kareem (2021) | AA 6061 | Iron ore of 2% | 240.5 | [36] |
| 17 | Vipin Kumar Sharma (2019) | AA 6061 | SiC + Al2O3 | 119 | [37] |
| 18 | S Narendranath (2020) | AA6061 | SiC/fly ash—2.5% | 145 | [38] |
| 19 | S. Roseline (2018) | Al6061 | 5% ZrO2 | 118 | [39] |
| 20 | Sharma (2021) | Al–Mg–Si–T6 | SiC (5%) + muscovite (2%) | 96.08 | [40] |
| 21 | Konopatsky (2021) | AlSi10 Mg | BN microflake | 230 | [41] |
| 22 | Sha, Jian-jun (2021) | Al Alloy | Nickel-coated carbon fiber | 70 | [42] |
| 23 | Rao (2021) | Al7075 | 0.5 wt.% SiC | 276 | [43] |
| 24 | Kumar (2021) | Al–SiC | SiC | 64.55 | [44] |
| 25 | Velavan (2021) | Al | 6% B4C + Mica | 72 | [45] |
| 26 | Ezatpour (2014) | Al6061 | Al2O3–1.5 wt.% | 200 | [46] |
| 27 | Ramnath (2014) | Al Alloy | Al2O3–3% B4C–2% | 54.6 | [47] |
| 28 | Amouri, K (2016) | A356 | 0.5 wt.% Nano-SiC | 295 | [48] |
| 29 | El-Sabbagh (2013) | 6061/F500 | SiC–10% | 115.66 | [49] |
| 30 | Yu, L. I., et al. (2016) | AA1100 | 31%–B4C | 160 | [50] |
| 31 | Kandpal (2017) | AA 6061 | Al2O3-5% | 150 | [51] |
| 32 | Sumankant (2017) | A356 | TiB2–6% | 261.84 | [52] |
| 33 | Alaneme (2013) | AA 6063 | Al2O3p–6% | 100 | [53] |
| 34 | Rino (2013) | AA 6064 | 8%–ZrSiO4 + 2%–Al2O3 | 132.98 | [54] |
| 35 | Kumar, G. V (2010) | Al6061 | SiC | 100 | [55] |
| 36 | Singh, V (2004) | AA 6061 | 5 wt.% SiCp | 52.8 | [56] |
| 37 | Mazaheri, Y (2013) | Al | TiC–B4C | 123 | [25] |
Figure 1. Graph of several reinforcements versus tensile strength [21][22][23][24][25][26][27][28][29][30][31][32][33][34][35][36][37][38][39][40][41][42][43][44][45][46][47][48][49][50][51][52][53][54][55][56][31,32,33,34,35,36,37,38,39,40,41,42,43,44,45,46,47,48,49,50,51,52,53,54,55,56,57,58,59,60,61,62,63,64,65,66].