Your browser does not fully support modern features. Please upgrade for a smoother experience.
Please note this is a comparison between Version 2 by Camila Xu and Version 3 by Camila Xu.
β-Thalassemia is the most prevalent single gene blood disorder, while the assessment of its susceptibility to coronavirus disease 2019 (COVID-19) warrants it a pressing biomedical priority.
- β-thalassemia
- risk
- coronavirus
1. Introduction
Identifying medical conditions with a high or potentially deadly impact on the disease caused by severe acute respiratory syndrome coronavirus 2 (SARS-CoV-2), is a critical initial step towards containment of associated morbidity and mortality risks. Given that viral stress from SARS-CoV-2 elicits anabolic responses supported by increasing blood pressure to meet enhanced oxygen needs of vital organs and organ systems, hypoxemia is rendered a high-risk medical condition [1][2]. As the most common blood disorder affecting approximately one third of the global population, anemia presents a low tolerance to hypoxemia and may have either acquired polysystemic or inherited poly- or monogenic background [3]. Monogenic anemia—which is caused by abnormal hemoglobin—is a rather prevalent medical disorder with 270 million carriers worldwide [4][5][6]. β-Thalassemia is the most common inherited single gene disorder in the world. Approximately one-third of all hemoglobinopathies and/or nearly 1.5% of the global population carry the β-thalassemia trait [7]. In this context, β-thalassemia heterozygosity is a strong candidate condition for assessing an individual’s susceptibility to COVID-19.
2. Associations
Association of β-thalassemia heterozygosity with severe and critical COVID-19 symptoms. Considering the clinical spectrum of COVID-19 as a primary outcome, patients were categorized into three groups (asymptomatic and mild/ moderate/ severe and critical). No difference in chest X ray or CT scan was observed among study participants. In univariate analysis, sex (p = 0.047), age (p < 0.001), atrial fibrillation (p = 0.022), coronary disease (p = 0.041), hyperlipidemia (p = 0.014), hypertension (p < 0.001), and being heterozygous for thalassemia (p = 0.004) were associated with severe COVID-19 symptoms (Table 1). In multivariate analysis, male sex (p = 0.023), increased age (p < 0.001), and being heterozygous for thalassemia (p = 0.002) were identified as independent risk factors for severe and critical clinical COVID-19 symptoms. Specifically, males had a 1.81 times (95% CI, 1.09 to 3.01) increased possibility for severe or critical clinical symptoms; increased age was associated with increased odds of severe and clinical symptoms with OR = 1.06 (95% CI, 1.04 to 1.08). A finding of great interest is that patients who were heterozygous for thalassemia were 2.89 times (95% CI, 1.49 to 5.62) more likely to have severe and critical clinical symptoms of COVID-19 (Figure 1).Table 1. Characteristics and COVID-19 clinical spectrum.
| Severity | Univariate | Multivariate Ordinal Logistic Regression (Severe and Critical vs. Others) | |||
|---|---|---|---|---|---|
| Mild (%) | Moderate (%) | No (%)Severe and Critical (%) | p-Value | ||
Table 3. Characteristics and ICU admission due to COVID-19.
| ICU | Univariate | MultivariateBinary Logistic Regression | |||||||||||||||
|---|---|---|---|---|---|---|---|---|---|---|---|---|---|---|---|---|---|
| p | -Value | p | -Value | aOR with 95% CI | |||||||||||||
| OR with 95% CI | RR with 95% CI | p | -Value | aOR with 95% CI | |||||||||||||
| Yes (%) | No (%) | p-Value | OR with 95% CI | RR with 95% CI | p-Value | aOR with 95% CI | |||||||||||
| Sex (M/F) | 34/34 | 67/46 | 52/22 | 0.047 * | 0.023 | 1.81 (1.09–3.01) | |||||||||||
| Sex (M/F) | 50/20 | 103/82 | 0.022 * | 1.99 (1.10–3.61) | 1.67 (1.06–2.64) | 0.036 | 2.09 (1.05–4.18) | ||||||||||
| Sex (M/F) | 36/17 | 117/85 | 0.186 * | 1.54 (0.81–2.92) | 1.41 (0.84–2.37) | 0.305 | 1.45 (0.72–2.93) | ||||||||||
| Age (median, IQR) | 51.5 (34) | 64.0 (17) | 70.5 (15) | <0.001 ± | <0.001 | 1.06 (1.04–1.08) | |||||||||||
| Age (median, IQR) | 72.5 (15) | 61.0 (24) | <0.001 ± | ||||||||||||||
| Age (median, IQR) | 66.2 (17) | 60.4 (24) | 0.030 | - | ± | -- | -<0.001 | 1.06 (1.03–1.09) | |||||||||
| 0.649 | 1.01 (0.98–1.04) | Atrial Fibrillation | 17 (25.0) | 32 (28.3) | 33 (44.6) | 0.022 * | 0.787 | 0.92 (0.49–1.71) | |||||||||
| Atrial Fibrillation | 33 (47.1) | 49 (26.5) | 0.002 * | 2.48 (1.40–4.39) | 1.88 (1.28–2.78) | 0.201 | 1.64 (0.77–3.48) | 0.191* | Respiratory Disease | 5 (7.4) | 13 (11.5) | ||||||
| Atrial Fibrillation | 21 (36.9) | 61 (30.2) | 1.52 (0.81–2.84) | 1.39 (0.85–2.25) | 0.966 | 0.98 (0.43–2.23) | Respiratory Disease14 (18.9) | 0.104 * | 0.325 | 1.47 (0.68–3.15) | |||||||
| 14 (20.0) | 18 (9.7) | 0.027 | * | 2.32 (1.08–4.97) | 1.74 (1.11–2.74) | 0.297 | 1.61 (0.66–3.95) | ||||||||||
| Respiratory Disease | 11 (20.8) | 21 (10.4) | 0.043 * | 2.26 (1.01–5.04) | 1.83 (1.05–3.17) | 0.205 | 1.80 (0.73–4.46) | Coronary Disease | 7 (10.3) | 23 (20.4) | 20 (27.0) | 0.041 * | 0.955 | 1.02 (0.50–2.09) | |||
| Coronary Disease | 20 (28.6) | 30 (16.2) | 0.027 * | 2.07 (1.08–3.96) | |||||||||||||
| Coronary Disease | 16 (30.2) | 34 (16.8) | 1.64 (1.08–2.49) | 0.808 | 0.90 (0.39–2.09) | 0.029 * | 2.14 (1.07–4.27) | 1.77 (1.08–2.92) | 0.393 | 1.48 (0.61–3.59) | Diabetes | 10 (14.7) | 25 (22.1) | 18 (24.3) | 0.331 * | 0.619 | 0.85 (0.45–1.60) |
| Diabetes | 18 (25.7) | 35 (18.9) | 0.233 * | 1.48 (0.77–2.84) | 1.32 (0.85-2.05) | 0.758 | 0.87 (0.41–1.91) | ||||||||||
| Diabetes | 10 (18.9) | 43 (21.3) | 0.699 * | 0.86 (0.40–1.85) | 0.87 (0.48–1.64)Neoplasia | 7 (10.3) | 11 (9.7) | 11 (14.9) | 0.529 * | 0.209 | 0.61 (0.28–1.32) | ||||||
| Neoplasia | 10 (14.3) | 19 (10.3) | 0.367 * | 1.46 (0.64-3.31) | 1.30 (0.75–2.24) | 0.395 | 0.67 (0.26–1.70) | Hyperlipidemia | 21(30.9) | 60 (53.1) | 32 (43.2) | 0.014 * | 0.138 | 0.65 (0.37–1.15) | |||
| 0.098 | 0.49 (0.21–1.14) | ||||||||||||||||
| Neoplasia | 4 (7.5) | 25 (12.4) | 0.466 † | 0.58 (0.19–1.74) | 0.64 (0.25–1.63) | 0.102 | 0.37 (0.11–1.22) | Hyperlipidemia | 30 (42.9) | 83 (44.9) | 0.773 * | 0.92 (0.53–1.61) | 0.94 (0.63–1.41) | 0.008 | 0.38 (0.19–0.78) | ||
| Hyperlipidemia | 22 (41.5) | 91 (45.0) | 0.644 * | 0.87 (0.47–1.60) | 0.89 (0.55–1.45) | Hypertension | |||||||||||
| 0.033 | 0.44 (0.21–0.94) | Hypertension24 (35.3) | 62 (54.9) | 56 (75.7) | |||||||||||||
| Hypertension | 42 (79.2) | 100 (49.5) | < | 0.001 * | <0.104 | 0.0011.67 (0.90–3.08) | |||||||||||
| * | 3.90 (1.90–7.99) | 3.04 (1.64–5.63) | 0.001 | 5.12 (2.04–12.87) | β-Thalassemia Heterozygotes | 5 (7.4) | 19 (16.8) | 21 (28.4) | 0.004 * | 0.002 | 2.89 (1.49–5.62) | ||||||
* Chi-square test, ± Mann–Whitney test; Bold is for the statistically significant results (p-value < 0.05).
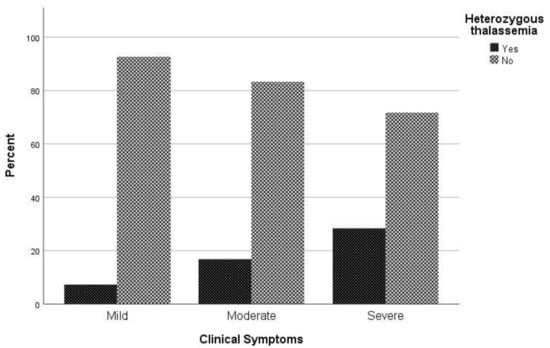
Figure 1. Proportion of β-thalassemia heterozygotes relative to non-carriers regarding clinical symptoms to COVID-19.
2.1. Association of β-Thalassemia Heterozygotes with Mortality Due to COVID-19
Regarding mortality associated with COVID-19 infection, in univariate analysis sex (p = 0.022), age (p < 0.001), atrial fibrillation (p = 0.002), respiratory disease (p = 0.027), coronary disease (p = 0.027), hypertension (p < 0.001), and being heterozygous for thalassemia (p = 0.005) were associated with mortality (Table 2). In logistic regression analysis, male patients had a 2.09 times (95% CI, 1.05 to 4.18) greater possibility of dying and patients with increased age were 1.06 times (95% CI, 1.03 to 1.09) more likely to die. It is worth noting that hyperlipidemia plays a beneficial role in COVID-19 mortality, as the odds ratio of mortality in patients with hyperlipidemia is 0.65 (95% CI 0.37–1.15). It should be highlighted that patient who are heterozygous for thalassemia have a 2.79 times (95% CI, 1.28 to 6.09) greater possibility of dying than other patients (Figure 2).
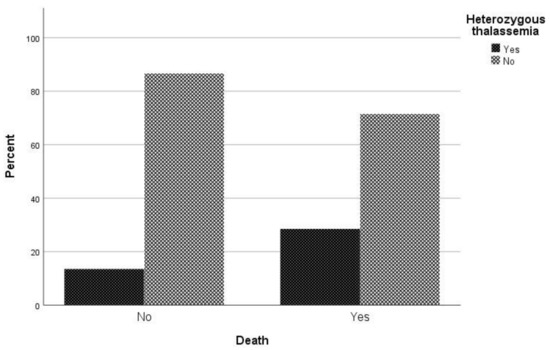
Table 2. Characteristics and mortality due to COVID-19.
| Mortality | Univariate | MultivariateBinary Logistic Regression | |||||
|---|---|---|---|---|---|---|---|
| Yes (%) | |||||||
| 52 (74.3) | |||||||
| 90 (48.6) | |||||||
| < | |||||||
| 0.001 | |||||||
| * | |||||||
| 3.05 (1.66–6.60) | 2.30 (1.43–3.70) | 0.198 | 1.67 (0.77–3.62) | ||||
| β-Thalassemia Heterozygotes | 20 (28.6) | 25 (13.5) | 0.005 * | 2.56 (1.31–4.99) | 1.87 (1.24–2.80) | 0.010 | 2.79 (1.28–6.09) |
* Chi-square test, ± Mann–Whitney test; Bold is for the statistically significant results (p-value < 0.05).
Figure 2. Proportion of β-thalassemia heterozygotes relative to non-carriers regarding mortality due to COVID-19.
2.2. Admission of COVID-19 Infected β-Thalassemia Heterozygotes to the ICU
Regarding the requirement for ICU care, it was found through univariate analysis that age (p = 0.03), respiratory disease (p = 0.043), coronary disease (p = 0.029) and hypertension (p < 0.001) were associated with ICU admission (Table 3). Through logistic regression analysis, patients with hypertension had 5.12 times (95% CI, 2.04 to 12.87) greater risk of requiring ICU care than patients without hypertension. On the contrary, hyperlipidemia was identified as a protective factor against ICU admission, with OR = 0.44 (95% CI, 0.21 to 0.94). Furthermore, in relation to the requirement for ICU care, being heterozygous for thalassemia had no effect on the possibility of admission to the ICU (
| β-Thalassemia Heterozygotes | |||
| 11 (20.8) | |||
| 34 (16.8) | |||
| 0.505 * | |||
| 1.29 (0.61–2.77) | 1.22 (0.68–2.18) | 0.508 | 1.33 (0.57–3.06) |
* Chi-square test, ± Mann–Whitney test, † Fisher’s exact test; Bold is for the statistically significant results (p-value < 0.05).
2.3. Length of Hospitalization until Death
When comparing the median length of hospitalization (days) between patients being heterozygous for thalassemia and non-carriers, a statistically significant difference was observed (p = 0.046) (Figure 3). More specifically, the median duration of hospitalization among carriers and non-carriers was 12 and 17.5 days, respectively.
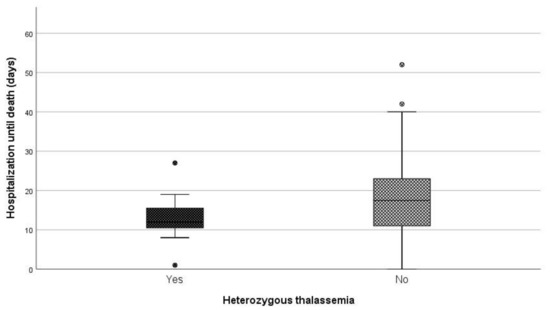
Figure 3.
Days of hospitalization until death between carries and non-carriers.
2.4. Length of Hospitalization among Patients Who Survived
Regarding days of hospitalization among patients that survived COVID-19, the median duration was eight days for patients that were heterozygous for thalassemia and six days for non-carriers (p = 0.014) (Figure 4).
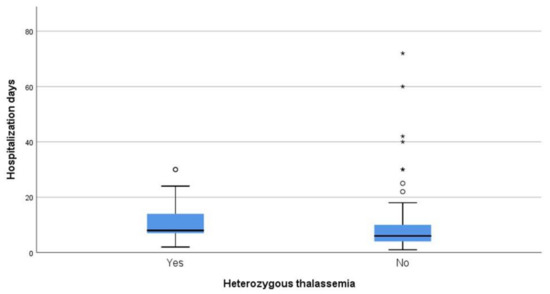
Figure 4. Days of hospitalization between carries and non-carriers that survived.
References
- Gheblawi, M.; Wang, K.; Viveiros, A.; Nguyen, Q.; Zhong, J.-C.; Turner, A.J.; Raizada, M.K.; Grant, M.B.; Oudit, G.Y. Angiotensin-Converting Enzyme 2: SARS-CoV-2 Receptor and Regulator of the Renin-Angiotensin System. Circ. Res. 2020, 126, 1456–1474.
- Rahman, A.; Tabassum, T.; Araf, Y.; Al Nahid, A.; Ullah, A.; Hosen, M.J. Silent hypoxia in COVID-19: Pathomechanism and possible management strategy. Mol. Biol. Rep. 2021, 48, 3863–3869.
- Lopez, A.; Cacoub, P.; Macdougall, I.C.; Peyrin-Biroulet, L. Iron deficiency anaemia. Lancet 2015, 387, 907–916.
- Samara, M.; Chiotoglou, I.; Kalamaras, A.; Likousi, S.; Chassanidis, C.; Vagena, A.; Vagenas, C.; Eftichiadis, E.; Vamvakopoulos, N.; Patrinos, G.P.; et al. Large-scale population genetic analysis for hemoglobinopathies reveals different mutation spectra in Central Greece compared to the rest of the country. Am. J. Hematol. 2007, 82, 634–636.
- De Sanctis, V. β-thalassemia distribution in the old world: A historical standpoint of an ancient disease. Mediterr. J. Hematol. Infect. Dis. 2016, 9, e2017018.
- Williams, T.N.; Weatherall, D.J. World Distribution, Population Genetics, and Health Burden of the Hemoglobinopathies. Cold Spring Harb. Perspect. Med. 2012, 2, a011692.
- Whetheral, D.J. The thalassemias. In Williams Hematology, 5th ed.; Beutler, E., Lichtman, M.A., Coller, B.S., Kipps, T.J., Eds.; McGraw-Hill: New York, NY, USA, 1995.
More