The Wandong cattle breed is recently recognized in Fangyang County, Anhui Province, China, by the National Commission for Livestock and Poultry Genetic Resources. The breed was domesticated in the watershed region between the Huai River and Yangtze River approximately 500 years ago, and mainly found in two kinds of coat color, yellow and brown. This is one of the best breed reared in Anhui China, and very popular for high quality meat production. The breed survives with extreme weather and raw feed as well as resistant to tick born diseases. Additionally, the animals raised in ecological environment in the hilly areas. The statistical data showed 1000,000 heads of Wandong cattle in the 1990s. However, now the breed population is significantly decrease and calculated 10,000 heads recently. Consequently, there is an urgent need to protect this local precious genetical assets.
1. Introduction
Improvement in the reproductive efficiency of local cattle bull via genetic selection is crucial, as individual bulls can breed multiple numbers of cows
[1]. Advances in livestock genomics, such as transcriptomics, proteomics and single-nucleotide polymorphism genotypes studies, are predicted the direct increasing rate of genetic gain in a generation
[2][3][2,3]. Thus, it demands an extensive use of molecular tools to improve the reproductive traits of Chinese native cattle.
Mammalian spermatogenesis takes place by the subsequent division of the cell: self-restoration of gonocytes, mitotic proliferation of spermatogonia, meiotic division of primary spermatocytes and post-meiotic differentiation of secondary spermatocytes. Finally, the haploid spermatids transform into another process called spermiogenesis
[4]. The process of spermatogenesis is more curious and involves several transcriptional factors that regulate by the testis-specific genes at the transcriptional and post transcriptional levels
[5][6][5,6]. The interactive network of lncRNAs and mRNAs is thought to be involved in mammalian reproduction system regulation and sperm quality parameters
[7].
The lncRNA profiles are comprehensively analyzed and identified at the 3-day-old neonatal and 13-month-old mature stages of Angus cattle
[8]. The detailed catalog of known and novel lncRNAs was also identified at four different developmental stages, including 60, 90, 120 and 150 days in boar testes
[9]. Non-coding RNAs (ncRNAs) with biological functions were identified nearly 60 years ago, and other functional ncRNAs were considered to occur as early as the 1980s
[10]. Later, ncRNAs such as Xist were discovered to control the chromosome structure. Since then, the number of novel and potentially usable ncRNAs has grown dramatically
[11][12][11,12]. However, new literature suggests that ncRNAs such as microRNAs
[12], PIWI-interacting RNAs, small interfering RNAs and long non-coding RNAs (lncRNAs) play a wide range of functions
[13][14][15][16][13,14,15,16]. These massive quantities of transcript species are referred to as ncRNAs.
In several animal species, the identification and functional validation of lncRNAs have been performed and characterized in spermatogenesis and testicular development
[17][18][17,18]. Many lncRNAs have been found in mouse (e.g., 8265 lncRNAs and 18,563 mRNAs), Drosophila (128 testis-specific lncRNAs), pig (15,528 lncRNAs), chicken (2597 lncRNAs and 17,690 mRNAs) and in sheep (6460 lncRNAs and 42,300 mRNAs) at various stages of testis development and spermatogenesis
[19][20][21][22][23][19,20,21,22,23].
Recently, lncRNAs have been recognized in various developmental stages of testes and spermatogenesis in rat, mouse and human models. The lncRNA link genes Membrane protein related to HSP30 (
MRH1), testis-specific X-linked gene (
TSX), DNA methylation regions (
DMR) and HONGRES2 are predicted to have critical roles in testicular growth and spermatogenesis
[24][25][24,25]. The
DMRT1 protein has been shown with a role in spermatogonial growth and avoiding premature meiosis in spermatogonia, implying that the lncRNA Dmr could be involved in the transition between mitosis and meiosis during spermatozoa development
[26]. The testis-specific X-linked lncRNAs were found to be expressed exclusively in pachytene spermatocytes but not in the spermatogonia or round spermatids, implying a regulatory role in germline meiotic division
[23].
2. Outline of lncRNAs and mRNAs Sequencing in Calf and Bull Testes
The raw reads were filtered and classified into different segments; consequently, 98.95% (70,333,218 clean reads) of the sequencing data was screened, containing N 0.05% (38,769) reads, low-quality 0.18% (126,760) reads and adopter-related 0.82% (584,096) reads for the bulls, and similar classifications were done for the calve, including clean reads (70,218,119, 98.48%), containing N (37,396, 0.05%), low-quality (141,228, 0.20%) and adopter-related (905,921, 1.27%) (
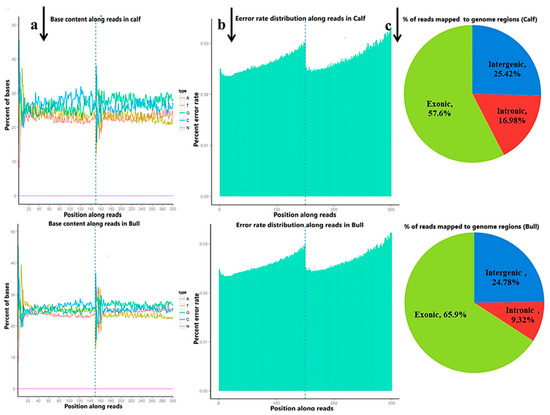
Figure S5). The raw reads for the total samples were found between 118,785,372 and 142,165,686, while the clean reads per sample were 116,004,150 and 140,666,436. Thus, the raw reads and clean reads yielded together 90 GB data, and the GC contents were 47.09–53.57% (
Figure 1a). The sequencing process itself has the possibility of machine errors. The distribution check of the sequencing error rate can reflect the quality of the sequencing data, and the sequencing error rate distribution test is used to detect the error % in the sequencing of samples (
Figure 1b). All the % Q20 values of the subjected reads in six samples were surpassed by 97%, and all the details are shown in
Table S3. More than 95.5% of the clean reads were aligned to
B taurus UMD3.1 and are shown in (
Figure 1c).
Figure 1. The quality summary of the clean reads used in the subsequent analysis were obtained after the original data filtering, sequencing error rate checking and GC content distribution checking. (a) The abscissa shows the base position of the reads, and the ordinate is the proportion of a single base, whereas different colors represent different base types. (b) The abscissa represents the bases position of the reads, and the ordinate is the average error rate of all the reads at this location. The 0~150 bp to the left of the dotted line is the error rate distribution of read1, while the 150~300 bp to the right is the error rate distribution of read2. (c) The percentage of the total number of clean reads mapped to the reference genome. The proportion of reads in the exon region, intron region and intergene region of the genome were calculated.
2.1. Identification and Characterizations of lncRNAs and mRNAs
3.3. Identification and Characterizations of lncRNAs and mRNAs
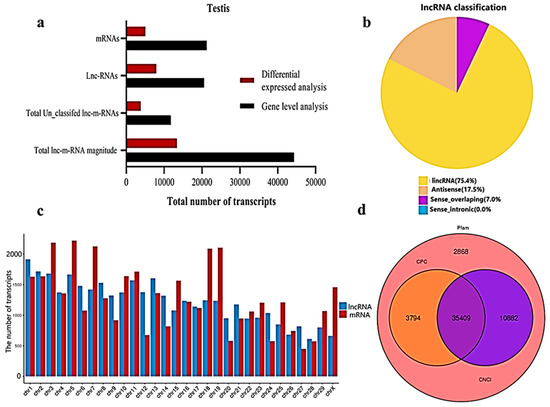
We classified and identified lncRNAs based on the position and direction of their genomic regions relative to mRNAs. A total lnc-mRNA magnitude of 44,279 was found in the calf and bull testes, where, at the gene level analysis, 21,250 mRNAs and 20,533 lncRNAs are identified (
Figure 2a). We established an accurate putative lncRNAs and mRNAs network from the assembled transcripts with a stringent pipeline. Based on the structural characteristics and genomic position, the lncRNAs were classified into four subclasses, though denoted as lincRNA (75.4%), antisense (17.6%), sense-overlapping (7.0%) and sense-intronic (0.0%) (
Figure 2b). The lncRNAs were overlapped in same or in the opposite direction with the exonic or intronic parts of the coding gene; thus, they became exonic-sense, exonic-antisense, intronic-sense or intronic-antisense, respectively. The genomic locus that was more than 1 kb from any mRNA-encoding genomic region was considered as a long intergenic ncRNA (lincRNA). According to this classification scheme, we found that most testis-specific lncRNAs (75.4%) were lincRNA. We examined the chromosomal localization of the testicular lncRNAs and mRNAs and identified the loci that expressed these transcripts. Our research confirmed that the transcripts were uniformly spread throughout the chromosomes of the bulls and calves (
Figure 2c). The coding potential of the lncRNA and mRNA were analyzed by using CPC2, CNCI and Pfam software, and a total of 35,409 coding transcripts were identified (
Figure 2d).
Figure 2. General properties of the lncRNAs and mRNAs in the premature and mature bovine testes were identified. (a) The transcripts were categorized as the total magnitude, unclassified and specified lncRNAs and mRNAs while analyzed at the gene level and differentially expressed patterns. (b) The distribution of lncRNAs at the genome region at a high magnitude were identified from the exon, intergenic and intron parts of the genome. (c) The distribution of testis mRNAs and lncRNAs in bovine chromosomal sets. (d) Venn diagram showing the coding potential results of the lncRNAs and intersection of the coding tools, such as CNCI, PFAM and CPC2.
3. Characteristics Comparison between lncRNAs and mRNAs
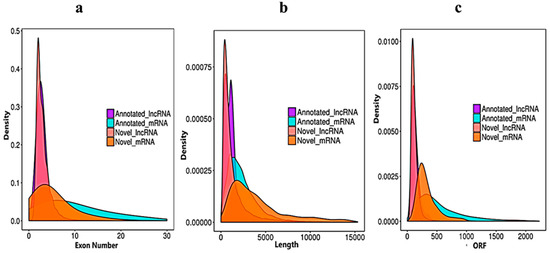
We verified the general characteristics of the novel lncRNAs and mRNAs by comparing the transcript length, exon number and ORF length, which also differentiated between the lncRNAs and mRNAs. The number of exons of mRNAs about (30) was higher than of the lncRNAs (10). The majority of lncRNAs have three or less than three exons, whereas mRNAs have five or more exons (
Figure 3a). In the length comparison, we observed that the lncRNAs (an average of 2000 bp) were significantly shorter than the mRNAs (an average of 3000 bp), as shown in (
Figure 3b). The open reading frame (ORF) is the normal nucleotide sequence of a structural gene. From the initiation codon to the termination codon, the open reading frame encodes a complete polypeptide chain, without any interruption in the translation. When we compared the lncRNA with mRNA ORFs, the sequences of annotated mRNAs and annotated lncRNAs were extracted by annotations of the known gene structure. The obtained ORF sequence was converted into a protein sequence, and the length distribution was obtained (
Figure 3c).
Figure 3. Sequencing characteristics of the lncRNAs and mRNAs have shown. (a) Exon number distribution of the annotated and novel lncRNAs (purple and pink) vs. the mRNAs denoted blue and dark yellow. (b) Transcript length comparisons of the annotated and novel lncRNAs (purple and pink) vs. the mRNAs (blue and dark yellow). (c) Open reading frame nucleotide sequence comparisons of the annotated and novel lncRNAs (purple and pink) vs. the mRNAs (blue and dark yellow).
4. Differentially Expressed Gene-Level lncRNAs and mRNAs in Testicular Tissues
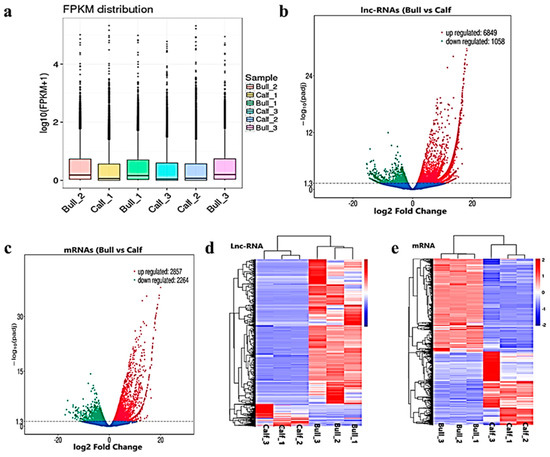
After the quantification process, the expression pattern of the lncRNAs and mRNAs were identified through the cuff-diff and Ballgown tools. The average transcripts expression level was higher in the bulls compared to the calves group (
Figure 4a). Thus, we recorded the differentially expressed (DE) lncRNAs and mRNAs between immature and mature testes by using Ballgown. The significant levels of lncRNAs and mRNAs among the testes samples were calculated, and the parameter of significance was taken into account, whereas the log2-fold change was considered higher than two or equal to and
p-adjusted
< 0.05. As a result, 7908 lncRNAs and 5122 mRNAs were found to be differentially expressed (DE) in immature and mature bovine testes. Further, we identified 6849 lncRNAs substantially upregulated and 1058 are downregulated in the testes (
p-value
< 0.05). In the adult testes group,
p-adjust
< 0.05 revealed that 2857 mRNAs were upregulated and 2264 were downregulated. These up and down highlights are displayed in volcanic plots (
Figure 4b,c), respectively. We also analyzed the DE lncRNAs and mRNAs by using the hierarchical clustering method, and the clustering was another way to display the DE genes, which bring together genes with similar expression patterns that may have common functions or participate in common metabolic and signaling pathways. The genes cluster on the left side was made due to similar expressions (fold change >2,
p < 0.05), and the calves and bulls were represented by columns, while the expression from blue to red represented them gradually upregulated (
Figure 4d,e).
Figure 4. Differential expressed level of the transcripts and protein-coding genes in the testes. (a) The distribution of the expression levels of the genes or transcripts in different samples is shown by a box graph. The boxplot of each region corresponds to five statistics, e.g., the maximum, upper quartile, median, lower quartile and minimum, respectively. (b) The volcanic map visualizes the overall distribution of the lncRNAs genes with significant differences in their expression. (c) Differential mRNA expressions between the calves and bulls. The upregulated genes are represented by red dots, downregulated genes by green dots and the blue dots are genes without significant changes. (d) Clustering map of DE lncRNAs among the calf and bull testes sample. (e) Clustering map of the DE mRNAs among the samples. Red indicates upregulated coding genes, and blue indicates downregulated gene products.
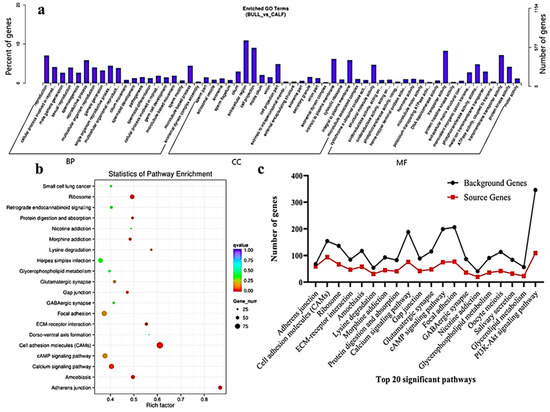
5. Functional Annotation and Enrich KEGG Pathways Analysis of DE mRNAs
The transcriptome level examination showed 3857 DE mRNAs (2352 upregulated and 1504 downregulated) were marked, and these mRNAs were preferred for the enrichment analysis. The DE mRNAs were substantially enriched in GO terms, including the reproduction, male gamete generation, spermatogenesis, multicellular organism reproduction, single-organism reproductive process, spermatids differentiation, spermatids development and sexual reproduction, which were the top eight GO annotations terms (
Figure 5a). Detailed descriptions of the GO terms are available in
Table S4. As for as the statistics of the pathway enrichment, the DE mRNAs were enriched in the top twenty KEGG-rich factors pathways, such as adherens junctions, cell adhesion molecules (CAMs) and lysine degradation (
Figure 5b).
Table S5 represents the top 10 most significant enriched pathways regulated by mRNAs in Wandong testes development. A total of 5122 DE genes (2857 upregulated and 2264 downregulated), which were regulated by mRNAs, were enriched in the GO terms related to reproduction and spermatogenesis. Some genes were (
FSCN3, HOXA11, CCDC155, LOC528479, CCNB1IP1, OCA2, DMRTC2, ADIG and
PACRG) highly related to spermatogenesis, while genes like
KIF18A, FNDC3A, KITLG, SOX8, HOXA11, UBB, SFRP1, KLHL10 and
WNT2B were found actively in male gonad development. The top 20 statistically enriched pathways (
p < 0.05) were assessed, and the source genes were found in the signaling pathways, such as lysine degradation, cell cycle, propanoate metabolism, adherens junction and cell adhesion molecules (
Figure 5c).
Figure 5. GO and KEGG functional validation of DE mRNAs. (a) GO enrichment analysis of DE mRNA genes between immature and mature Wandong cattle testes. DE mRNAs genes are divided into the following three biological segments: biological process (BP), cellular components (CC) and molecular function (MF), while the left and right y-axis showed the percentage and numbers of mRNA host genes. (b) Top 20 enriched pathways of DE mRNA host genes in the immature and mature phases of testicular growth. (c) Top 20 most relevant pathways for reproduction and representing the total background genes and significant source genes of mRNAs in the pathways.
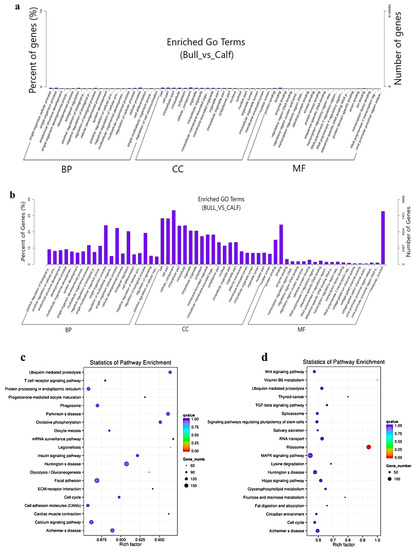
6. LncRNAs Co-Location and Co-Expression Regulated Target Genes
The target gene prediction was performed based on the correlation between the lncRNAs and transcription factors, and the screening condition suggested that the correlation coefficient should be greater than 0.95. For the elucidation of lncRNA functions during the biological process, we predicted the targets of the lncRNAs. For the co-location-related target gene analysis, a
cis-target gene prediction was performed while screening range was within 100 Kb, and DE
cis-acting lncRNAs were shown
(Table 1). The co-expression network built for bull and calf testes comprised 1168 mRNAs and 410 lncRNAs, which have regulatory potential. Taking 100 Kb as the cutoff, 410 out of 550 lncRNAs were found as the nearest neighbors of 1168 mRNAs. The findings of the GO enrichment study revealed that there were 70 GO descriptions significantly observed (
p-adj-value
< 0.05). The top five GO terms were cellular process, cell, cell part, cellular component and regulation of the biological process (
Figure 6a). The top 10 significantly enriched GO descriptions of BP, CC and MF, which regulated the target genes of the lncRNAs, are shown in
Table S6. We also studied the co-location target genes in a
trans way for the lncRNAs. A total of 550 lncRNAs and 11,470 genes were detected using Pearson correlation 0.95 as the cutoff. The GO enrichment analysis for co-located target genes identified 190 significant GO terms (
p < 0.05), while the top five GO terms were spermatogenesis, sexual reproduction, male gamete generation, gamete generation and reproduction (
Figure 6b). The KEGG analysis for co-expression identified 10 pathways (
p < 0.05), and the top 20 pathways are shown in (
Figure 6c), such as the T-cell receptor signaling pathway, Ubiquitin-mediated proteolysis, mRNA surveillance pathway, ECM−receptor interaction, focal adhesion and cell cycle pathway.
Table S7 shows the top 10 most significant enriched pathways regulated by lncRNAs in Wandong testes development. Concerning the pathways, the co-located
trans-target genes for the lncRNAs were supplemented in several KEGG pathways—for example, the ribosome pathway, Lysine degradation, fructose and mannose metabolism, Vitamin B6 metabolism and TGF-beta signaling pathway (
Figure 6d).
Figure 6. The co-location and co-expression methods were used and identified the lncRNA cis- and trans-regulated genes. (a) The scheme represents the co-expressed (trans-regulated) genes of the lncRNAs. (b) Co-located (cis-regulated) genes of the lncRNAs. (c) The top 20 significant enriched KEGG pathways for co-expressed lncRNA target genes are listed. (d) The top 20 significant enriched KEGG pathways for co-located lncRNA target genes are listed.
Table 1. Top 20 DE cis-acting long non-coding RNAs in calf and bull testes.
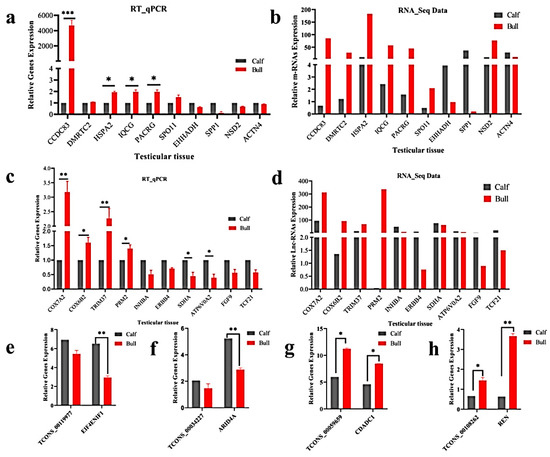
63.18. Validation of Differentially Expressed LncRNAs and mRNAs
ResWe
archers randomly selected 10 DE mRNA-predicted genes (e.g.,
CCDC83,
DMRTC2,
HSPA2,
IQCG,
PACRG,
SPO11,
EHHADH,
SPP1,
NSD2 and
ACTN4) and 10 lncRNA-predicted genes (
COX7A2,
COX6B2,
TRIM37,
PRM2,
INHBA,
ERBB4,
SDHA,
ATP6VOA2,
FGF9 and
TCF21) for the immature and mature testes samples, using RT-qPCR for the purpose of validating the genes that identified in RNA-Seq results. The RT-qPCR relative expression results were parallel to the RNA-seq results as shown (
Figure 7a–d), whereas the primer details are available in
Table S2. The achieved results demonstrated that the RNA-seq data was valid and dependable, with a specificity in the bull testes developmental stages. To further elucidate the
cis-acting potential of the lncRNAs and their target genes in the testicular growth of bulls, four candidate lncRNA: TCONS_00119977, TCONS_00034227, TCONS_00059659 and TCONS_00108262, along with cis-acting genes:
EIF4ENIF1,
ARID4A,
CDADC1 and
REN were selected, while the RT-qPCR and the obtained results were in line with the RNA-Seq findings (
Figure 7e–h).
Figure 7. Validation of the RNA-Seq results via RT-qPCR in the immature and mature stages of bulls. The penal figures (a–d) compared the DE mRNA and lncRNA sequencing results and the RT-qPCR findings. The penal figures (e–h) showed the expression decoration of four lncRNAs and their cis-acting genes in two different developmental stages. The data were measured by the 2−ΔΔCt method, and GAPDH was used as the housekeeping gene. The data are presented as the mean ± SEM, where * p < 0.05, ** p < 0.01, *** p < 0.001.