Your browser does not fully support modern features. Please upgrade for a smoother experience.
Please note this is a comparison between Version 1 by Thomas Missimer and Version 2 by Bruce Ren.
Brackish water desalination, using the reverse osmosis (BWRO) process, has become common in global regions, where vast reserves of brackish groundwater are found (e.g., the United States, North Africa).
- brackish water reverse osmosis (BWRO) desalination
- capital cost of BWRO
- operating cost of BWRO
- impacts of feedwater quality on cost
- impacts of capacity on cost
Note: The following contents are extract from your paper. The entry will be online only after author check and submit it.
1. Introduction
Many regions of the world have limited freshwater supplies to meet the combined demands of human consumption, agriculture, and industry [1]. Limitations on the development and use of fresh groundwater resources have led to assessments on the use potential of saline groundwater. Saline groundwater occurs in abundance in many global locations [2]. Brackish water, with total dissolved solids (TDS) less than about 8000 mg/L, is used as a water supply source in many regions, such as North Africa, central Saudi Arabia, Jordan, and others, in combination with desalination using the brackish water reverse osmosis process [3][4][3,4].
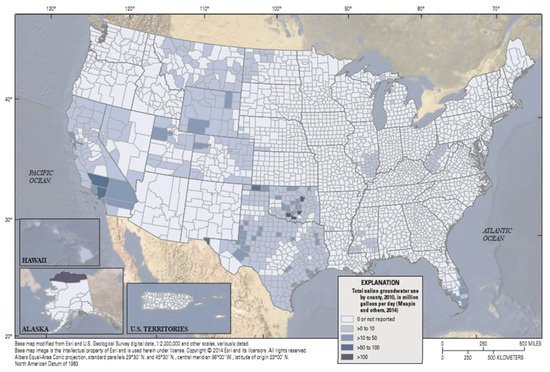
In the United States, there are extensive saline groundwater sources that contain total dissolved solid (TDS) concentrations between 1000 and 10,000 mg/L [5][6][7][8][9][10][11][12][13][5,6,7,8,9,10,11,12,13]. The volume of brackish groundwater that is available for use is quite large and geographically extensive. Saline (brackish) water use by county, in the United States in 2010, is shown in Figure 1. Brackish groundwater is used for irrigation in some regions, when the TDS is under 1500 mg/L, and the vegetation is tolerant to that salinity and the resulting soil salt buildup [14][15][16][14,15,16].
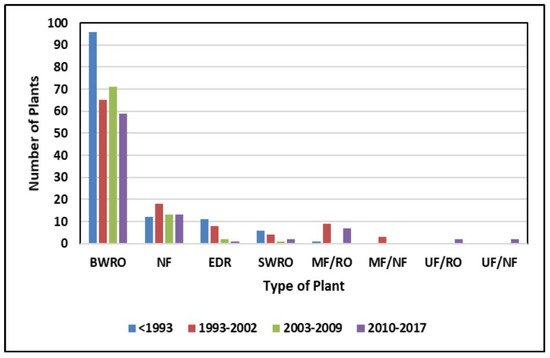
Brackish groundwater is also a source of feedwater for many brackish water reverse osmosis (BWRO) desalination plants that produce potable water [8][12][17][18][8,12,17,18]. In 2010, nearly 250 municipal membrane treatment facilities operated in the United States, and this grew to 406 in 2018 [18][19][18,19] (Figure 2). Of this number, 295 are BWRO facilities with capacities over 95 m3/d [16].
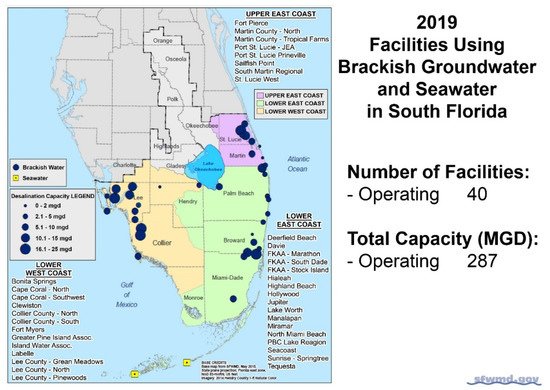
The largest concentration of BWRO desalination plants in the United States occurs in Florida [20][21][20,21]. Other states, such as Texas, are planning to add many additional BWRO facilities to those that are currently operating [22]. In Southern Florida, in 2019, 40 BWRO and 3 seawater reverse osmosis desalination plants operated, with a total capacity of 1.09 million m3/d [21] (Figure 3).
Because of the global growth rate in the use of brackish water desalination, there is great interest in the capital and operating costs of these facilities, but few data compilations have been published using actual data. One of the purposes of this research is to provide factual data associated with specific facilities and the methods of operation that contribute to the OPEX costs. The costs associated with a total of seven BWRO desalination water treatment facilities, based on cost per cubic meter (m³) in the Southwest Florida region of the United States of America, have been compiled, to allow detailed examination. In Southwest Florida, fresh source water supplies are becoming increasingly hard to develop because of the explosive population growth, impacts on the environment, pumping-induced saltwater intrusion, competition with the use of public or private wells, limited surface-water resources, and climate change issues. The combined results of these factors reduce the available freshwater resources for use and increase the demand for potable water.
In addition to assessing the capital (CAPEX) and operating costs (OPEX) for the Southwest Florida facilities, an evaluation of BWRO costs was made, by comparing these detailed costs with the global data, to construct some basic graphs. These graphs can estimate the unit costs for various capacity plants and the impact of groundwater TDS on these costs. Where possible, the electrical cost was factored into the analysis. Most cost data for BWRO facilities have been estimated, rather than developed from the compilation of actual plant data. The inflation associated with the CAPEX and OPEX of the facilities, has been provided for the US facilities.
Most CAPEX and OPEX cost information on BWRO facilities operating costs is currently estimated using curves, models, or a set of assumptions [24][25][26][27][28][29][30][31][32][33][34][35][36][37][38][39][40][41][24,25,26,27,28,29,30,31,32,33,34,35,36,37,38,39,40,41]. It is a goal of this research to obtain real cost information for the existing BWRO plans, for comparison to the past estimates. Little consideration has been given to innovations in real plant operations, which reduce electrical usage and the overall cost of treatment. Some examples of innovative cost control measures include the blending of raw water with treated water, to raise the pH and to reduce the cost to the consumer; the use of energy recovery devices in BWRO; the blending of the raw water with some limited freshwater, to reduce the salinity of the feedwater (where available); and the implementation of specialized maintenance techniques that extend the lifetime of the membranes, from 5 up to 15 years (e.g., City of Cape Coral).
2. CAPEX Cost Variation
The CAPEX costs for BWRO facilities vary in the extreme, based on what is included in the project and land costs. The highest cost documented value of over USD 2947/m3 is the North City of Cape Coral, Florida facility. Based on the consumer price index over the years, since the construction of the project, the 2020 cost would be about USD 4067. The detailed breakdown of this cost shows that a large urban land purchase was required to build the BWRO facility, and to accommodate other utility infrastructure at the same location. The building was sized to meet the buildout capacity for the service area of the plant. Also, spare pumps were purchased in addition to other equipment that was needed to provide operational security. The raw water contained hydrogen sulfide, which had to be removed before the treated water could be discharged into the distribution system, so a degassing system had to be designed and constructed. The concentrate disposal for the plant was a deep-well injection, so that the cost was also included in the CAPEX. The Cape Coral North facility is an excellent example of why using cost curves to estimate CAPEX, for new BWRO facilities, can produce inaccurate estimates. Many projects involving BWRO design and construction also include multiple components that cannot be easily separated from the primary project goal. Commonly, distribution system improvements are also contained with these project budgets (e.g., storage tanks, pumping stations, and pipeline improvements). The use of cost curves for the estimation of strictly the BWRO component of a project is reasonable, if it can be separated from the other components of the project.
Perhaps the most consistent data set on BWRO CAPEX is that from Texas. These projects had a rather narrow set of goals and objectives that follow the general trend of reducing CAPEX/m3 with increasing plant capacity. The one possible exception is the largest capacity plant in El Paso (Figure 4). This facility uses a high-pressure deep injection well system for concentrate disposal.
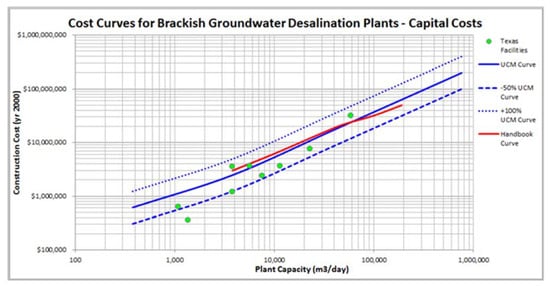
Figure 4. Comparison of the CAPEX costs for nine BWRO plants in Texas to the cost curves developed by Unified Costing Model [42][53] and the Desalting Handbook for Planners [33]. This cost model has not been corrected for the consumer cost increase from when the model was created to the current cost.
3. OPEX Cost Variation
Some important general observations can be made in analyzing the complied OPEX data from various BWRO facilities. First, the local electrical cost is one of the key factors that controls BWRO treatment costs in facilities that treat raw water, within a TDS range of 2000 to 8000 mg/L, and do not have major pretreatment and concentrate disposal challenges. The OPEX costs for BWRO facilities in Florida are generally higher than in Texas, because the average electrical cost is about USD 0.6/kWh in Texas versus USD 0.125/kWh in Florida. The Florida rate is primarily for residential electric use, and industrial or utility rates are lower based on the negotiated rates, considering factors such as interruptible power (on-site generators) and peak load reduction. Most BWRO facilities in Florida must also post-treat the potable water to remove hydrogen sulfide. The international facility costs are lower, which could result from various types of subsidies, or other unknown reasons. At locations where the pretreatment costs only include an antiscalant and acid to reduce the pH, the costs are generally lower. Where any additional control of the substances in the raw water is required, such as silica, iron, or manganese, the costs can be quite high compared to the pretreatment that is used to solely control calcium carbonate scaling.
In general, the cost for BWRO plants capacities, ranging from 10,000 to 70,000 m3/d, is 0.39 to 0.66 USD/m3 based on the time when the data were collected. These data are not corrected for inflation, because the individual utilities do not raise the consumer rates annually and may lag behind real cost recovery. A graph showing all of the compiled OPEX data based on plant capacity (m3/d) versus cost in USD/m3 is given in Figure 5. Note that there is extreme scatter when plotting all of the data that were collected. The variations are caused primarily by the differences in energy costs, pretreatment of the feedwater, and post-treatment of the finished water. There is no distinct pattern of reducing unit costs with increasing plant capacity for all of the data combined. Still, the trend line shows a negative slope, indicating a reduction in OPEX as the capacity increases. The Texas data show a tighter fit to the capacity versus cost scaling line. A second plot of the plant capacity in m3/d versus the cost per day in USD produces less scatter, and a trend line can be drawn with a better correlation (Figure 6). Since the slope of the line is less than one-to-one, as shown in the regression equation, the scaling factor that indicates a lower unit cost as the capacity increase is again confirmed.
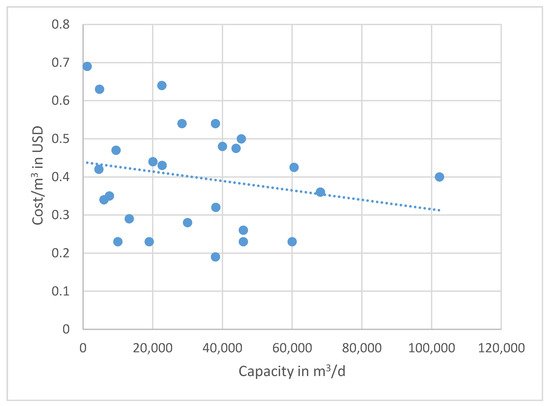
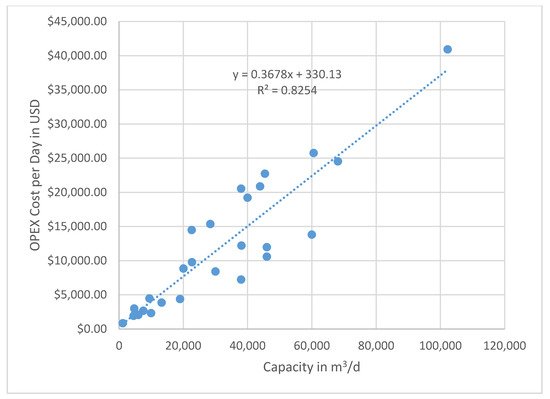
Figure 5. U.S. and global OPEX cost for various plant capacities. Note the extreme scatter of data based on the arithmetic plot. The R2 value of the trend line is poor, with the data having a standard deviation of 0.13 m2/d, but shows a reducing unit cost as capacity increases. Note that these costs are not corrected for local inflation, which may not directly correlate with increased costs to consumers (e.g., foreign water subsidies).
Figure 6. Plot of capacity versus total OPEX cost/day. Note that this plot shows a better fit to the trend line with a high R2 value. The equation for the trend line has a slope of less than one-to-one, which is indicative of a lower unit cost with a larger capacity. Therefore, scaling of capacity is an important economic factor. Note that these costs are not corrected for local inflation, which may not directly correlate with increased costs to consumers (e.g., foreign water subsidies).
4. Impacts of Energy Recovery Systems in BWRO
In the past, energy recovery systems were not considered to be effective in cost savings in BWRO plants, because of the low operating pressure, high recovery, and the use of blending with raw water. However, many BWRO plants are now being designed with energy recovery systems or retrofitted with these systems.
An evaluation of two types of energy recovery systems for a BWRO plant showed that both turbocharger and isobaric systems might save electric energy costs, especially when the conversion rate is <84% [43][44][45][57,58,59]; as the conversion rate declines, the electrical energy saving increases [46][60]. The key method in deciding on the use of energy recovery systems on BWRO plants is to conduct a complete life cycle analysis (LCA) [47][61].
A large number of BWRO facilities exhibit long-term increases in feed water salinity [48][49][50][51][52][62,63,64,65,66]. The use of energy recovery systems to mitigate electric energy costs increases as the feedwater salinity increases, which should be considered. This would potentially mitigate higher energy consumption, to treat higher TDS feedwater. Some recent research on the use of energy recovery in BWRO has suggested integrating a supercapacitor with capacitive deionization into the process [53][67].
5. Impacts of Feedwater Chemistry Issues That Can Potentially Affect the Economics of Brackish-Water Desalination
Feedwater chemistry can significantly impact BWRO costs if additional pretreatment is required to prevent membrane scaling and fouling [54][68]. In BWRO, the most common problem is scaling and not fouling, although some fouling has been reported at the City of Cape Coral North BWRO facility. There are four common types of scaling in BWRO plants, which are impacted by the feedwater chemistry. This includes scaling with calcium carbonate, calcium sulfate, iron, and silica [55][69].
Calcium carbonate scaling is commonly controlled using standard pretreatment methods, as described in this paper at the City of Cape Coral facilities. The pH of the inflow water is lowered using acid, and a polyphosphate or polyacrylate is added. Some recent research has been conducted on the use of polyaspartic acid as a pretreatment additive [56][70]. Unless the hardness of the feedwater is exceptionally high, the standard pretreatment process that is used to control calcium carbonate scaling does not add a higher cost to BWRO desalination. In feedwater with a very high hardness, the additional concentration of acid required could increase OPEX cost.
The control of calcium sulfate scaling (gypsum) can be considerably more complex [57][58][71,72]. The closer to saturation that occurs in the feedwater, the greater the difficulty of the pretreatment. A zwitterionic coating on the thin-film composite membranes has been suggested as a means for slowing gypsum scaling [59][73]. The addition of carboxymethyl cellulose in the feed may also reduce the rate of scaling [60][74]. The use of sulfuric acid to lower the pH is not recommended, but hydrochloric acid is more effective and does not add additional sulfate to the feedwater. However, hydrochloric acid is more expensive and tends to increase the treatment costs. When the feedwater chemistry contains a high relative concentration of sulfate-to-chloride ratio, the potential for scaling rises and increases the potential for gypsum scaling, the recovery using the RO process must be reduced, thereby significantly increasing the treatment cost [61][75]. In certain cases, it is more effective to treat this type of feedwater using electrodialysis or electrodialysis reversal if the overall TDS concentration is not too high [62][63][64][76,77,78]. In Florida, this issue occurs in Sarasota County.
The control of iron scaling in BWRO is commonly mitigated by the reduction in the feedwater pH, similar to calcium carbonate. However, if the dissolved iron concentration is too high or the feedwater varies between anoxic and oxic, the iron must be removed at considerable expense. In this case, it may be necessary to add a tray aerator, add a coagulant polymer, and then use a plate settler to remove the iron [65][79]. An alternative would be to use chlorine dioxide, a plate settler, micro-sand filtration, and then an oxidant remove stage to remove the iron [65][79]. Therefore, if the dissolved iron must be removed, the BWRO desalination process rises in cost.
Perhaps the most difficult potential scaling issue is that with silica. Most natural groundwater sources do not have high silica concentrations, but in aquifers with elevated temperatures (geothermal), silica concentrations can approach saturation or they can contain silica colloids. Because the scaling of silica on BWRO membranes may not be able to be removed, it is quite important that it be prevented from occurring. Two factors seem to dictate the scaling of silica on the membrane, which include the initial concentration in the feedwater (combined dissolved and colloids) and the surface condition of the membranes [66][67][80,81]. The surface electrostatic charge and the occurrence of certain organic materials can either accelerate or inhibit silica deposition. The typical pretreatment methods to prevent scaling are pH adjustment or to add an antiscalant solution [68][69][82,83]. These methods are common and do not generally add significant costs to the pretreatment. However, if pretreatment of the feedwater is required, then the costs can become quite high. Expensive pretreatment techniques, such as electrocoagulation, can be used to remove the silica from the brackish water before primary membrane treatment [70][84].
6. Impacts of Zero Liquid Discharge on the Economics of BWRO
Disposal of the concentrate after the BWRO process has also become a potentially large cost factor within the interior facility locations, where surface disposal into the ocean or the use of deep injection wells is not possible. In some locations, the use of zero liquid discharge (ZLD) is the only means of concentrate disposal. Within the realm of seawater desalination, the use of ZDL for large-capacity plants is likely a myth [71][85]. In small- to medium-capacity BWRO systems, ZLD is feasible, but requires a means of salt disposal, which causes increased costs for both the additional energy for treatment and the solid waste disposal [72][73][74][86,87,88]. A number of methods have been proposed to lower the energy consumption and costs for ZLD, by combining various membrane and thermal processes [75][76][77][78][79][80][89,90,91,92,93,94]. All of the methods, either used or designed to date, cause a major increase in power consumption, resulting in higher water production costs [81][95]. Perhaps mitigation methods could be used to co-locate inland BWRO plants, where a number of industries require very-high-quality water for makeup water to produce steam or where valuable metals could be extracted from the waste stream.
7. Comparative Costs between BRWO and Seawater RO (SWRO) Costs
Over the past decade, the cost of SWRO has steadily decreased, based on the common use of energy recovery devices and the scale factor that is associated with the design and construction of very-large-capacity facilities [38]. The OPEX cost of some seawater plants has now fallen below BWRO OPEX costs for some of the larger facilities, in the 100,000 to 1,000,000 m3/d range. A key difference between the SWRO and BWRO facilities is the chemistry differences in the raw water supply, and the ability to design and construct very-large-capacity SWRO plants above 200,000 m3/d. The issue of concentrate disposal is another factor favoring a lower seawater desalination cost, where the disposal is back into the ocean. While equivalent-capacity plants will continue to show higher OPEX costs for BWRO, the trend will continue to reduce SWRO costs as the capacities grow. It is interesting to note that the use of seawater from groundwater sources should significantly reduce pretreatment, due to the lack of organic carbon in groundwater. However, the possible occurrence of hydrogen sulfide in the feedwater will necessitate its removal after membrane treatment, and thereby could cause an increase in the overall treatment cost.