In a Fourier Transform InfraRed (FTIR) spectrometer, some of the infrared (IR) radiation is absorbed by the sample, and some of it is passed through (transmitted). The resulting molecular absorption and transmission response can be used to identify the components of the sample and their concentration.
- FTIR
- NDIR
- NDUV
- CLA
- NH
- formaldehyde
- acetaldehyde
- PEMS
1. Introduction
One method that can measure many compounds is FTIR (Fourier transform infrared) spectroscopy (= study of the interaction between light with matter) [1][3]. Many compounds absorb infrared energy at an intrinsic wave number (or wavelength) proportionally to their concentration. In an FTIR spectrometer, some of the infrared (IR) radiation is absorbed by the sample, and some of it is passed through (transmitted). The resulting molecular absorption and transmission response can be used to identify the components of the sample and their concentration. FTIR, compared to other IR techniques, can measure many components in real-time due to the use of an interferometer that allows the collection of a broad range of wavelengths. By contrast, non-dispersive infrared (NDIR) analyzers measure one compound due to the use of an optical filter that allows the selection of a narrow wavelength area, specific to the compound of interest.
1.1. FTIR Description
The heart of every FTIR instrument is an optical device called an interferometer (Figure 1) [1][3]. The oldest and most common type is the Michelson interferometer. The infrared source is usually a heated ceramic (at ca. 1200 °C). A collimating mirror collects light from the source and makes its rays parallel. A beamsplitter (in KBr) transmits approximately half of the light incident upon it and reflects the remaining half. A fraction of the light transmitted travels to a fixed mirror, while the other fraction travels to a moving mirror (see Figure 1). The lights are reflected by the two mirrors back to the beamsplitter, where they are recombined into a single light beam. This light beam interacts with the sample (exhaust gas) in a gas cell and finally strikes the detector. A multireflection cell is used to obtain a long optical path length with the minimum possible volume of the cell [2][111].
Because the path that one beam travels is a fixed length and the other is constantly changing as its mirror moves, the signal which exits the interferometer is the result of these two beams “interfering” with each other. The resulting signal is called an interferogram (i.e., a plot of light intensity versus optical path difference). The interferograms measured are then Fourier transformed to yield a spectrum (i.e., a plot intensity versus frequency/wavenumber). There is also a laser (not shown in the figure) whose light follows the infrared beam. This laser light is used to measure the optical path difference of the interferometer. The spectral resolution (in cm−1) depends on the inverse of the optical path difference.
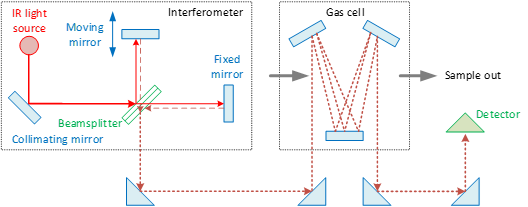
Figure 1. Principle of operation of FTIR (Fourier transform infrared) spectroscopy. IR = infrared.
1.2. FTIR in the Vehicle Exhaust Regulations
Vehicle emissions are regulated since the 1970s [3][1]. The measurements are conducted on chassis dynamometers (light-duty vehicles) or in engine test cells (heavy-duty engines). The instruments described in the regulations are sampling from the full dilution tunnel, where the whole exhaust gas is diluted, or directly from the tailpipe (undiluted exhaust). The control of the regulated pollutants (e.g., CO, NOx ) with advanced aftertreatment devices [4][2] has led in some cases to increased emission of non-regulated pollutants (e.g., N2O, NH3).
The measurement techniques for regulated pollutants are well-defined in the regulation (e.g., non-dispersive infrared (NDIR) for CO and CO2). For non-regulated pollutants, only recently, a Global Technical Regulation for light-duty vehicles (GTR 15) prescribes possible measurement techniques.
GTR 15 allows the use of FTIR for ethanol, formaldehyde, acetaldehyde, and N2O only from the dilution tunnel. This is because there is no exhaust gas measurement to determine the emissions from the tailpipe. Only NH3 has to be measured from the tailpipe. At the moment, there is a limit only for heavy-duty engines (in ppm) in the EU regulation (not in GTR). Such specifications would need two FTIRs for the measurement of non-regulated pollutants (e.g., one for NH3 at the tailpipe and one at the dilution tunnel for the other pollutants). Permitting measurement of all pollutants from the tailpipe would simplify the setup. Furthermore, FTIR could be used instead of other analyzers. For example typically NDIR analyzers are used for CO and CO2, chemiluminescence detectors (CLD) for NOx, and flame ionization detectos (FID) for hydrocarbons. Indeed, the use of FTIR at the tailpipe is a commonly accepted technique for research and development.
1.3. FTIR for Vehicle Exhaust Research
FTIR spectroscopy is used in geology, chemistry, materials, medicine, and biology research fields on solid, liquid, and gaseous samples. FTIR has been used in a wide range of air pollution-related studies in both ambient air and environmental chambers. Already in the late 1970s, an FTIR system was installed in a van for air pollution measurements for the Environmental Protection Agency (EPA) of the United States of America (USA).
FTIR spectroscopy has been used for the measurement of gas concentrations for various studies, e.g., soot oxidation [5][35], or SCR (selective catalytic reduction for NOx ) [6][7][36,37] and catalyst evaluation [8][9][10][38,39,40] with synthetic gases. It has also been used in engine test beds to assess ethanol [11][12][41,42], biodiesel [13][43] such as Jatropha [14][44], dimethyl ether (DME) [15][45], or hydro-treated vegetable oil (HVO) [16][46], homogeneous charge compression ignition (HCCI) engines [17][47], gasoline compression ignition engine [18][48], post injection effect on emissions [19][49], NH3 sensors [20][50], or even modeling of emissions [21][51]. FTIR instruments have also been used on chassis dynamometers: Small gasoline engines [22][52] or even diesel trucks [23][24][53,54]. For example, for exhaust gas recirculation (EGR) [25][55], alternative fuels [26][27][56,57], reactive nitrogen compounds [28][29][58,59], impact of low temperature on non-regulated pollutants [30][60], and retrofit evaluation [31][32][61,62] of diesel vehicles. Similarly, chassis dynamometer studies with gasoline vehicles [33][63] focused on unregulated emissions [34][35][36][37][38][64,65,66,67,68], NH3 [39][40][41][42][43][69,70,71,72,73], effect of exhaust gas reforming on emissions [44][74], low temperature [30][45][46][60,75,76], alternative fuels [35][47][65,77], and hybrids [48][49][50][78,79,80]. Motorcycles’ non-regulated pollutants emissions have also been assessed with FTIR [51][52][53][54][55][81,82,83,84,85].
The on-road application started in 2000 [56][86]. Since then other researchers measured emissions on the road [57][58][59][87,88,89], greenhouse gases (GHG) [60][90], nitrogen species [61][91], cold start emissions [62][63][64][65][66][92,93,94,95,96] of gasoline vehicles and the impact of ambient temperature [67][97]. A few also studied compressed natural gas (CNG) [68][98], diesel fueled vehicles [69][70][71][99,100,101] and their non-regulated pollutants [72][102].
2. Results and Discussion
2.1. Comparison with Other Methods
2.2. FTIR and Interferences
3. Conclusions
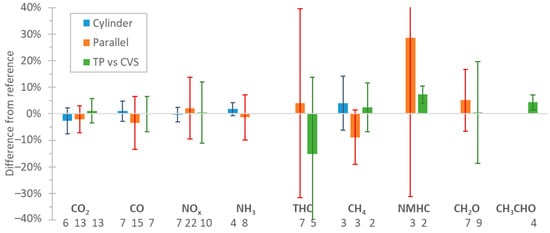
Based on studies that assessed FTIRs performance on the measurement of vehicle exhaust emissions, the mean differences compared to regulated or other methods were around ±2.5% for CO2, CO, NOx, and NH3 with a variability (one standard deviation) of 5% for CO2 and 10% for CO, NOx , and NH3. For CH4, acetaldehyde, and formaldehyde, the mean differences were ±10% (variability 10–20%), but for total hydrocarbons, much higher differences were noticed. The differences were similar regardless of the sampling location of the FTIR (dilution tunnel or tailpipe). Assessment of prototype portable FTIRs on the road confirmed these findings also on-board, but for a narrow range of environmental and driving conditions. Based on these results, FTIRs may be an alternative for on-road testing. However, more studies with commercial portable systems are necessary to cover a wider range of environmental and driving conditions. The introduction of FTIRs in the regulation will require strict technical and performance requirements and procedures based on recently developed standards.