1. Introduction
On 31 December 2019, the World Health Organization (WHO) first reported an outbreak of a new coronavirus (COVID-19) illness in Wuhan, China. A few days later (in January 2020), the first death as a result of the new virus was registered in Wuhan, and just 48 h later, a case was reported in Thailand. By the end of January, cases had been identified in the USA, followed by Europe and Latin America in February. The WHO declared a global health emergency, and countries began adopting measures to contain the spread of the virus and mitigate its danger by eliminating or restricting social proximity. In general, by March, with the exception of essential services (e.g., trash collecting, medical services, electricity, water and public security), across the world, companies, industries and private and public institutions were closed, and a large proportion of the population was quarantined or subject to serious restrictions on mobility
[1] (p.1). Nevertheless, much variation exists between countries and even within different regions of a single country. The measures also varied across time, with countries sometimes relaxing or intensifying, for example, their social distancing protocols.
In Mexico, the Health Ministry declared a national health emergency (“Jornada Nacional de Sana Distancia”:
https://www.gob.mx/cms/uploads/attachment/file/541687/Jornada_Nacional_de_Sana_Distancia.pdf, accessed on 23 March 2020), when the country was transitioning from phase one of the pandemic (imported cases) to phase two (community spread of the virus). This involved limiting large concentrations of people, suspending the public sector (except essential services such as the police and health services), closure of all educational institutions, closures of cultural sites such as museums, cultural centers and archaeological areas and limitations on recreational sites, such as cinemas, theaters, restaurants and bars. The initiative aimed to “encourage” the population to avoid physical contact and included a call to voluntarily “stay at home”. These measures were later intensified with the suspension of all non-essential activity across all economic sectors, with the threat of fines, closures and criminal charges in the event of non-compliance (although this rarely occurred). By the end of March, Mexico City was practically paralyzed, with the closure of shopping malls, offices and businesses. In May, the “Plan to Return to Normality” ("Plan de Vuelta a la Normalidad":
https://covid19.cdmx.gob.mx/nuevanormalidad, accessed on 26 March 2020) was enacted, which set out steps for the gradual resumption of social and economic activities using a “traffic light” system that would progressively restart non-essential economic activities while taking into consideration new rates of infection, hospital occupancy and the percentage of positive cases.
These measures had a significant impact on crime behavior, particularly on the volume and distribution of crime
[2]. For any public policy regarding security during the pandemic, it is important to understand the impact of these social distancing measures on crime. Such an understanding may also provide crucial information on crime in general. In fact, there is a growing body of literature that studies the effects of COVID-19-related lockdowns on crime and violence
[3][4][5][6][3,4,5,6]. Results vary according to the type of crime and location under study (and in some cases, on the empirical information available, such as that in Latin America
[7][8][9][7,8,9]).
One pending issue is the particular effect of the quarantine and lockdown on gun violence. In the USA, the sudden increase in arms purchases indicated a possible rise in gun violence
[10] and resulted in specific research that studied this issue, either as part of a set of crimes
[11][12][11,12] or on its own
[13][14][15][13,14,15]. In the rest of the American continent, the analysis of gun violence has generally been included in studies of homicides and battery (during the pandemic
[16]), but it is mostly not analyzed as a specific phenomenon (e.g., shootings), possibly due to the lack of official information.
The majority of the emerging studies on COVID-19 and crime are framed within the routine activities approach
[17][18][19][17,18,19]. This framework easily explains the relationship between daily activities and crime behavior and can be explained simply: if the streets are empty, there are no adequate targets for street robbery, and the same applies to public transport, businesses, cars in the street and other environments.
Within this context, we propose a specific analysis of changes in the distribution of shootings (which do not necessarily end in homicides or battery but serve as a proxy for violence). This paper focuses on shootings in Mexico City from 6 October 2019 to 6 October 2020 by analyzing tweets that reported gunshots. Calls to 911 were not used, as people tend to not call the police when they hear gunshots. One possible explanation for this may be that the population, out of distrust or fear, do not generally seek to involve themselves directly by calling the police (see barriers to calling 911 such as fear of becoming involved because of law enforcement or financial or immigration status
[20]); rather, they comment on shootings on Twitter with other social network users and thereby keep their personal details confidential. In Mexico City, Twitter may thus be an alternative source of information regarding this issue to incidents of calls to the police or 911. Of course, it should be remembered that while the abundance of data regarding gunshots on Twitter compared to official data may be an indicator of quality, it may also point to a certain bias (of who is tweeting). Despite any weakness in the information coming from Twitter, it nevertheless complements, to some degree, official information, especially considering that the “dark figure of crime” impacts 92.3% of all crime in Mexico City
[21].
2. Analysis on Results
2.1. Clusters of Tweets about Gunshots in Mexico City
The nearest neighbor ratio calculations estimated a spatial clustering of reports of gunshots in Mexico City with a confidence level greater than 99%, and thus reports of gunshots were spatially clustered in both periods under observation (
Table 13).
Table 13. Nearest neighbor ratio.
Nearest neighbor ratio.
|
NNR
|
Pre-Covid
Octuber 2018- 2019
|
COVID-19
Octuber 2019 –2020
|
|
Nearest Neighbor Ratio
|
0.239556***
|
0.212260***
|
|
Observed Mean Distance
|
265.82 meters
|
278.21 meters
|
|
Expected Mean Distance
|
1,109.65 meters
|
1,310.71 meters
|
|
z-score
|
-17.274584
|
-15.145186
|
|
p-value
|
0.0000001
|
0.0000001
|
| |
|
|
| NNR |
Pre-COVID
October 2018–2019 |
COVID-19
October 2019–2020 |
| Nearest Neighbor Ratio |
0.239556 *** |
0.212260 *** |
| Observed Mean Distance |
265.82 m |
278.21 m |
| Expected Mean Distance |
1,109.65 m |
1,310.71 m |
| z-score |
−17.274584 |
−15.145186 |
| p-value |
0.0000001 |
0.0000001 |
The results obtained in the statistical calculation (NNR) indicate that a distance greater than a kilometer between each reported gunshot was considered to be random. Nevertheless, an average distance of 265.82 m and 278.21 m was registered for the period prior to the COVID-19 pandemic and during lockdown, respectively (Table 13).
Despite the fall in frequency of reports—from 141 to 101 tweets—the distance between points increased slightly. This increase in spatial dispersion during the second period is reflected in the distribution of the distances between the est neighbors. The first quartile increased from 6471.3 to 9002.7 m, the second quartile increased from 10,635.4 to 13,068 m, and the third quartile registered a change from 13,384.4 to 17,322.1 m.
2.2. Spatial Clustering at All Distances
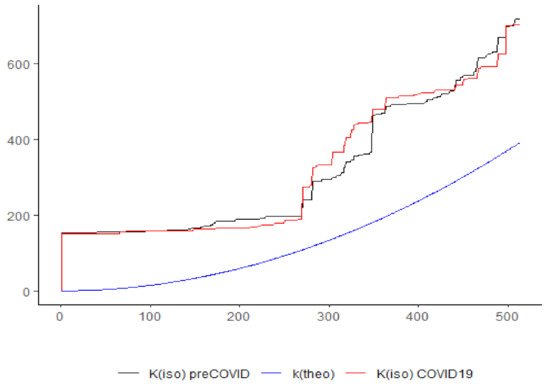
The results of the Ripley’s K function estimation also detected the spatial concentrations for both periods. In Figure 12, Ripley’s isotropic functions are presented, estimated for gunshot reports before the pandemic Kiso preCOVID K^iso preCOVID
(black line) and during lockdown K^isoCOVID19 Kiso preCOVID19(red line). The theoretical model of complete spatial randomness was the same for both periods, Ktheo, Ktheo
, shown in blue.
Figure 12. Ripley’s K function, isotropic. Source: Authors’ own with R software.
In both cases, Ripley’s isotropic K function (black and red lines) was above the random uniform distribution
KtheoKtheo
, suggesting spatial clustering of gunshot reports at any scale within Mexico City, consistent with the nearest neighbor ratio test. The period of lockdown did not appear to affect the spatial patterns of tweets in the city due to the similarity of the estimated functions.
Figure 12 shows the isotropic correction of Ripley’s K function due to the number of tweets and with the assumption of no stationary process. We included in the appendices the estimations of the function with different corrections of the
K^trans Ktrans and
Kbord K^bord
edge effects for both periods
[22][45] (pp. 147, 216).
2.3. Location of Spatial Intensity in Mexico City
2.3. Location of Spatial Intensity in Mexico City
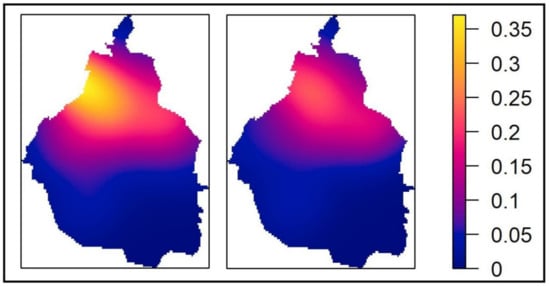
Two maps of intensity were developed with kernel estimation: one for the period before lockdown and one for during the COVID-19 pandemic (
Figure 23). In both images, the areas shaded in yellow show the peaks in intensity of gunshot reports in Mexico City.
Figure 23. Kernel estimate of gunshot prevalence in Mexico City pre-COVID-19 (left) and during COVID-19 (right). Source: Authors’ own with R software.
The period before COVID-19 contained a greater intensity of tweets reporting gunshots in the city than the period during the health emergency. On the left of
Figure 23, the highest intensity peak across the city had an estimated probability of 0.35. In contrast, during the pandemic, the intensity decreased to a probability of 0.22 in the highest peak. The smoothing out detected in the second period dispersed the intensity of reports across a greater area toward the east, corresponding to the central area of the city, although to a lesser degree (right side of
Figure 23). Thus, the location of the greatest intensity of gunshot reports on the left side of
Figure 23 corresponds to the western limit of the city. The pandemic modified the pattern detected by the kernel estimation from the west toward the center of the city on the left side of
Figure 23.
In both periods, reports of gunshots were concentrated in the central area of the city, leaving the northern and southern parts of the city out of the first order intensity detected in both cases. Although the absolute frequency of reports on Twitter was lower in the second period (from 141 to 101 tweets), the spatial dispersion and distance between points during lockdown was greater. The kernel estimation analysis undertaken revealed the displacement of the spatial pattern of intensity of gunshots in Mexico City during the COVID-19 pandemic.
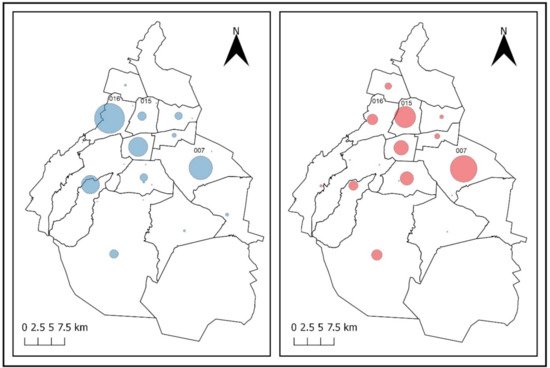
To analyze the underlying criminological processes that could explain the change in the intensity pattern of tweets about gunshots, we present below the locations of the points in the administrative areas that correspond to the 16 municipalities of Mexico City (
Figure 34). This geographic management of data does not consider spatial analysis with polygons but rather serves to contextualize the detected pattern of intensity.
Figure 34. Reports of gunshots pre-COVID-19 (blue) and during COVID-19 (red) in Mexico City. The numbers on the map represent Miguel Hidalgo (016), Cuauhtémoc (015) and Iztapalapa (007). Source: Authors’ own with QGIS software.
2.4. Prevalence by City Municipalities
The peaks in intensity detected by the kernel estimation corresponded to the neighboring municipalities of Miguel Hidalgo (016) for the period prior to the pandemic and Cuauhtemoc (015) during the COVID-19 pandemic (
Figure 34). The highest numbers of tweets were concentrated in these two municipalities, with 29 and 18 tweets, respectively. In both periods, the municipality of Iztapalapa (007) remained constant, with an average of 22 tweets for both periods. The size of the buffers in
Figure 34 corresponds to the number of reports in the municipalities (
Table 24), with the three municipalities mentioned identified by their official codes.
Table 24. Number of tweets per municipality.
| Municipality |
Pre-Covid |
Covid-19 |
| Iztapalapa |
23 |
21 |
| Miguel Hidalgo |
29 |
8 |
| Cuauhtémoc |
12 |
18 |
| Benito Juárez |
18 |
11 |
| La Magdalena Contreras |
17 |
7 |
| Coyoacán |
11 |
11 |
| Tlalpan |
10 |
8 |
| Venustiano Carranza |
8 |
3 |
| Iztacalco |
4 |
4 |
| Xochimilco |
2 |
1 |
| Azcapotzalco |
2 |
5 |
| Tláhuac |
3 |
0 |
| Cuajimalpa de Morelos |
1 |
2 |
| Álvaro Obregón |
1 |
2 |
| Milpa Alta |
0 |
0 |
| Gustavo A. Madero |
0 |
0 |
| Total |
141 |
101 |
Regarding the rest of the city, in the first pre-COVID-19 period (blue), reports were concentrated in the municipalities of Miguel Hidalgo (29), Iztapalapa (23), Benito Juárez (18) and Magdalena Contreras (17). During lockdown (red), tweets were concentrated in the municipalities of Iztapalapa (21), Cuauhtemoc (18) and Benito Juárez (11) (
Table 24). In both periods, the same municipalities did not report gunshots (Gustavo A. Madero and Milpa Alta).
Table 24 shows the decrease in the frequency of gunshot reports in the city by municipality from 141 tweets to 101. The municipalities of Miguel Hidalgo and La Magdalena Contreras registered the greatest decline in reports, from 29 tweets to 8 and from 17 to 7, respectively. In contrast, the municipality of Cuauhtemoc registered more gunshot reports in the second period (18) than before the lockdown. Another atypical value was registered in the municipality of Iztapalapa, with a slight decrease from 23 to 21 tweets, thus not experiencing the pronounced increase or decrease that occurred in other areas of the city. These changes in the frequency of reports by municipality between the two periods were statistically significant (Fisher’s exact test, a non-parametric test with a
p-value of 0.05097; see
Appendix A).
2.5. Tweets per Mmonth, Day of the Week and Hour of the Day
Before the pandemic, tweets about gunshots were predominantly in the last months of the year in 2018 (October, November and December) as well as in February 2019, accounting for 49.64% of the reports. During the pandemic, tweets were concentrated in the months of October 2019 and January, March and June 2020, constituting 52.47% of the reports. Tweets about gunshots were largely a weekend phenomenon; Fridays, Saturdays and Sundays accounted for 57.44% and 54.45% of the reports before and during the pandemic, respectively. They were most frequent on Sundays for both periods. Regarding the hour of the day, tweets were strongly evident at night after 8:00 p.m. and before 6:00 a.m., with a slight decrease during the COVID-19 period (from 76.59% to 71.28%). However, these variations in tweets by month, day of the week and hour of the day or night were not significant. The results of Fisher’s exact test to analyze variations did not allow for the rejection of the hypothesis of randomness of the observed frequencies. The estimated
p-values were 0.2159 for months, 0.5322 for days of the week and 0.3729 for differences between day and night (based on 2000 replicates). In other words, there was no statistical evidence to suggest that the pandemic modified the regularity of reports in the months, days of the week or hours of the day in which the tweets regarding gunshots were generally concentrated in Mexico City.
3. CDiscurrent Insightsssion
One of the most interesting findings of this analysis was that during lockdown in Mexico City, shootings appeared to have moved from one municipality to a neighboring one (
Figure 34). The model suggests that the municipality of Cuauhtemoc (015) had the highest concentration of shootings and experienced a 50% increase in Twitter reports. In contrast, the neighboring municipality of Miguel Hidalgo (016) registered a reduction in the average frequency, with a pronounced fall in reports in the second period of 72.4% (
Table 24). This may have been due to changes in crime patterns in the city.
In contrast to the studies conducted in Baltimore, Buffalo, Chicago, New York and Philadelphia, which found an increase in violence associated with firearms during the pandemic in comparison with 2019
[14][23][24][14,32,34], in Mexico City, an overall decrease in reports of gunshots was reported on Twitter across the two periods. This finding also differs from those studies that did not find significant increases in shootings in 25 large cities in the USA in general
[11] or in Los Angeles
[12].
The decrease in shootings in Mexico City is consistent with the significant decrease in other types of crimes in the city during the pandemic, such as robberies of public transport
[8], burglary and vehicle theft
[9]. On an international level, this study coincides with the effects of the pandemic on crime: an overall decrease, as indicated by, for example, Shayegh and Malpede (2020)
[25][23] in San Francisco, by Mohler et al. (2020)
[26][22] in Los Angeles and Indianapolis and by Campedelli (2020)
[12] in Los Angeles.
Interestingly, this study shows not only a decrease in the reports of shootings but also a change in the spatial intensity of these reports. The kernel estimation spatial analysis shows that this decrease in frequency of reports was accompanied by a change in the spatial pattern of the intensity of tweets in the city. The change detected during the pandemic (right side of
Figure 23) showed an evening out of intensity across the area, resulting in an almost equal probability of tweets in the central area of Mexico City as in the west. As illustrated in
Figure 34, the municipalities of Miguel Hidalgo (016) and Cuauhtemoc (015) share an administrative border, and they registered the greatest frequency of reports for both periods. One explanation for the changes in the number of tweets may be that the municipalities border each other, and according to the first law of geography, “everything is related to everything else, but near things are more related than distant things”
[27][51] (p.236).
One possible explanation for this phenomenon, based on the spatial proximity of the municipalities and the routine activities approach, is the differing financial capacity of potential victims of crimes committed with firearms to comply with lockdown measures. The municipality of Cuauhtemoc (015), which includes the historical center of the city, has many street vendors and informal businesses who, as a result of the severe decline in their income, struggled to respect the health lockdown (that is, they continued with their activities despite the restrictions). Furthermore, 48.07% of the occupied population in the municipality work in the informal sector
[28][52]. In contrast, in the municipality of Miguel Hidalgo (016), which includes some of the highest income neighborhoods in the city (Polanco and Lomas de Chapultepec), the “stay-at-home” measures were relatively easier to follow, as businesses had the capacity to endure the closures (
Figure 34). At the same time, there is less informal work (street vendors) in the municipality, with 40.50% of the population employed in the formal sector
[28][52]. The decrease in commercial and pedestrian activity possibly gave rise to the displacement of crimes committed with firearms from Miguel Hidalgo (016) to Cuauhtemoc (015), where activity continued and criminal opportunities did not decrease significantly.
This explanation is further supported by the different income levels and business costs between municipalities. The proportion of employees reporting an income of more than 5 times the minimum wage in Miguel Hidalgo (016) is 14.64%, compared with 10.99% in the municipality of Cuauhtemoc (015) (the minimum wage in Mexico City is USD 7
[28][52]). The annual per capita income also reflects this difference between the municipalities. Miguel Hidalgo (016) has an average income of USD 8748.64 in comparison with that of Cuauhtemoc (015), which reports an average income of USD 6164
[29][43]. This difference plays out in all areas. For example, the monthly rental for a 100 m
2 commercial property has an average cost of USD 1960.00 in Miguel Hidalgo (016), while in the Cuauhtemoc (015), such a property would go for two thirds of this cost at USD 1330.00
[30][53]. These figures illustrate the greater income opportunities available in the municipality of Miguel Hidalgo (016) in comparison with the Cuauhtemoc (015).
An alternative hypothesis regarding the increase in reports of gunshots in Cuauhtemoc (015) during the pandemic relates to the activities of drug trafficking organizations and their disputes over local markets (see spatial patterns and drug hotspots in Mexico City in Vilalta
[31][54]). However, a recent study found that crimes associated with organized crime, such as robbery, kidnapping and homicides, remained at similar levels in Mexico City before and during the COVID-19 pandemic
[9]. As activity levels of organized crime remain constant (for example, for homicide), then it is likely that a significant portion of the increase in tweets reporting gunshots in the municipality of Cuauhtemoc (015) was due to the displacement of other crimes committed with firearms from the neighboring municipality of Miguel Hidalgo (016). The notable fall in reports registered by the latter and the spatial proximity that modified the pattern of spatial intensity in the city, detected by the kernel estimation, supports this explanation.