There has been increased interest in the care and housing of cows with concerns for cow welfare given the increasing size of the average dairy herd across developed countries [1]. Animal welfare concerns are commonly directed at farm animals, and in particular housed and more intensive production systems with large numbers of animals [2]. With larger herds the expectation is often that each dairy stockperson will look after more animals as farms either seek to reduce labor costs or find it difficult to source skilled labor.
- dairy cows
- behavior
- birth
- observations
- management
1. Introduction
Close monitoring at calving is required by the stockperson to ensure the survival of the mother and her offspring, with problems potentially impacting on future lifetime performance. While some idea of expected calving date is often known, or estimated from time of insemination and gestation length, this estimate is often imprecise and requires some subjective judgement by the farmer with regular checks during late pregnancy to ensure a successful outcome for the mother and offspring. To assist a stockperson at calving, and given the importance of a successful birth and potential need for intervention, a number of sensor technologies have been developed. These technologies have largely been based on accelerometers and movement detection [3,4][1][2], or an alternative is computer vision [5,6][3][4], which have been developed to support farm management and improve animal health and wellbeing, and ultimately productivity. The frequency of lying, standing and tail movements of an animal have been found to change in the period prior to calving in both dairy [7][5] and beef cattle [8][6], and may give some indication of the need for assistance. Dystocia is fairly common in dairy cows and is a major cause of calf mortality [9,10][7][8]. Barrier et al. [10][8] found that calves which survived dystocia had poorer welfare in the neonatal period and possibly beyond, with lower passive immunity transfer, higher mortality and higher indicators of physiological stress. Although preventing dystocia is close to impossible, quick and timely intervention will help avoid the risk of poor health outcomes. Individual evaluation and continuous monitoring of dairy cows around the time of calving is important to identify any need for intervention or health problems as early as possible. The impact on lifetime performance and labor cost is estimated to range from £110 to £400 per assisted calving [11][9].
2. Analysis on Results


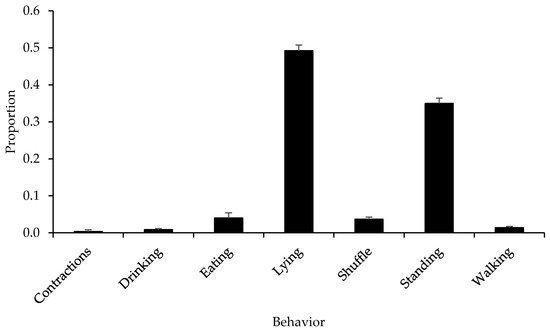
| Variable | Mean (s.e.) | df | F Statistic | p Value | ||||||||
|---|---|---|---|---|---|---|---|---|---|---|---|---|
| Parity | Primiparous | 0.04 (0.01) | 1 | 0.02 | 0.877 | |||||||
| Multiparous | 0.04 (0.01) | |||||||||||
| Time period | ||||||||||||
| Multiparous | 0.06 (0.01) | 1 | ||||||||||
| Time period 1Period 1 | 0.03 (0.02) | 2 | 0.2 | Period 10.795 | ||||||||
| 0.06 (0.01) | 2 | 1.7 | 0.191 | Period 2 | 0.05 (0.01) | |||||||
| Period 3 | ||||||||||||
| Period 2 | 0.07 (0.01) | |||||||||||
| Period 30.05 (0.01) | ||||||||||||
| 0.06 (0.01) | Assistance 2 | |||||||||||
| Assistance Assisted | 2 | Assisted0.05 (0.01) | 1 | 0.2 | 0.631 | |||||||
| 0.07 (0.01) | 1 | 0.2 | 0.630 | Unassisted | 0.04 (0.01) | |||||||
| Unassisted | 0.06 (0.01) | Behavior 3 | ||||||||||
| Behavior | 3 | 6 | 130 | 6 | 140<0.001 | |||||||
| <0.001 | Time period × assistance | Period 1/Assisted | 0.04 (0.02) | 2 | 0.5 | 0.631 | ||||||
| Time period × assistance | Period 1/Assisted | 0.07 (0.01) | 2 | 2.1 | 0.119 | Period 1/Unassisted | 0.03 (0.03) | |||||
| Period 1/Unassisted | 0.05 (0.02) | Period 2/Assisted | 0.06 (0.02) | |||||||||
| Period 2/Assisted | 0.08 (0.01) | Period 2/Unassisted | 0.04 (0.01) | |||||||||
| Period 3/Assisted | 0.04 (0.02) | |||||||||||
| Period 3/Unassisted | 0.05 (0.01) | |||||||||||
| Assistance × behavior | Assisted/Contractions | 0.01 (0.01) | 6 | 0.9 | 0.515 | |||||||
| Assisted/Drinking | 0.01 (0.01) | |||||||||||
| Assisted/Eating | 0.03 (0.02) | |||||||||||
| Assisted/Lying | 0.47 (0.03) | |||||||||||
| Assisted/Shuffle | 0.04 (0.01) | |||||||||||
| Assisted/Stand | 0.36 (0.03) | |||||||||||
| Assisted/Walking | 0.02 (0.01) | |||||||||||
| Unassisted/Contractions | 0.002 (0.004) | |||||||||||
| Unassisted/Drinking | 0.01 (0.01) | |||||||||||
| Unassisted/Eating | 0.06 (0.01) | |||||||||||
| Unassisted/Lying | 0.52 (0.01) | |||||||||||
| Period 2/Unassisted | 0.07 (0.01) | |||||||||||
| Period 3/Assisted | 0.05 (0.01) | |||||||||||
| Period 3/Unassisted | 0.07 (0.01) | |||||||||||
| Assistance × behavior | Assisted/Contractions | 0.05 (0.01) | 6 | 1.3 | 0.257 | Unassisted/Shuffle | 0.03 (0.01) | |||||
| Unassisted/Stand | ||||||||||||
| Assisted/Drinking | 0.01 (0.004) | |||||||||||
| Assisted/Eating | 0.01 (0.01) | 0.34 (0.01) | ||||||||||
| Unassisted/Walking | 0.01 (0.003) | |||||||||||
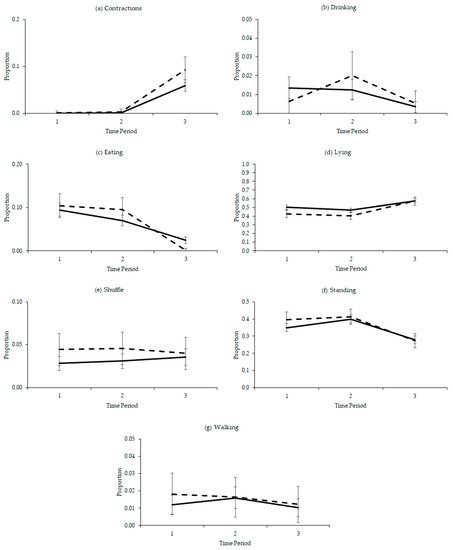
| Time period × behavior | Period 1/Contractions | 0 (0.001) | 12 | 4.4 | <0.001 | |||||||
| Period 1/Drinking | 0.01 (0.01) | |||||||||||
| Assisted/Lying | 0.07 (0.01) | |||||||||||
| Assisted/Shuffle | 0.24 (0.02) | |||||||||||
| Assisted/Stand | 0.34 (0.02) | |||||||||||
| Assisted/Walking | 0.09 (0.01) | |||||||||||
| Unassisted/Contractions | 0.01 (0.01) | |||||||||||
| Unassisted/Drinking | 0.01 (0.002) | |||||||||||
| Unassisted/Eating | 0.03 (0.004) | |||||||||||
| Unassisted/Lying | 0.06 (0.01) | Period 1/Eating | 0.10 (0.02) | |||||||||
| Period 1/Lying | 0.47 (0.03) | |||||||||||
| Period 1/Shuffle | 0.04 (0.01) | |||||||||||
| Unassisted/Shuffle | 0.27 (0.01) | |||||||||||
| Unassisted/Stand | 0.38 (0.01) | |||||||||||
| Unassisted/Walking | 0.09 (0.01) | Period 1/Stand | 0.37 (0.03) | |||||||||
| Period 1/Walking | 0.02 (0.01) | Period 2/Contractions | 0.002 (0.002) | |||||||||
| Period 2/Drinking | 0.02 (0.01) | |||||||||||
| Period 2/Eating | 0.08 (0.01) | |||||||||||
| Period 2/Lying | 0.44 (0.03) | |||||||||||
| Period 2/Shuffle | 0.04 (0.01) | |||||||||||
| Period 2/Stand | 0.41 (0.03) | |||||||||||
| Period 2/Walking | 0.02 (0.01) | |||||||||||
| Period 3/Contractions | 0.07 (0.01) | |||||||||||
| Period 3/Drinking | 0.004 (0.003) | |||||||||||
| Period 3/Eating | 0.01 (0.01) | |||||||||||
| Period 3/Lying | 0.58 (0.03) | |||||||||||
| Period 3/Shuffle | 0.04 (0.01) | |||||||||||
| Period 3/Stand | 0.28 (0.02) | |||||||||||
| Period 3/Walking | 0.01 (0.01) | |||||||||||
| Time period × behavior × assistance 4 | 12 | 0.4 | 0.966 |


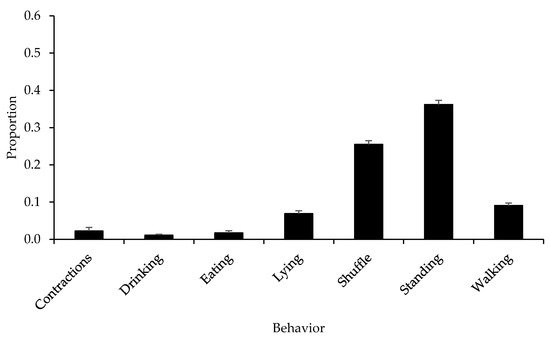
| Variable | Mean (s.e.) | df | F Statistic | p Value | |
|---|---|---|---|---|---|
| Parity | Primiparous | 0.06 (0.01) | 1 | 0.00003 | 0.996 |
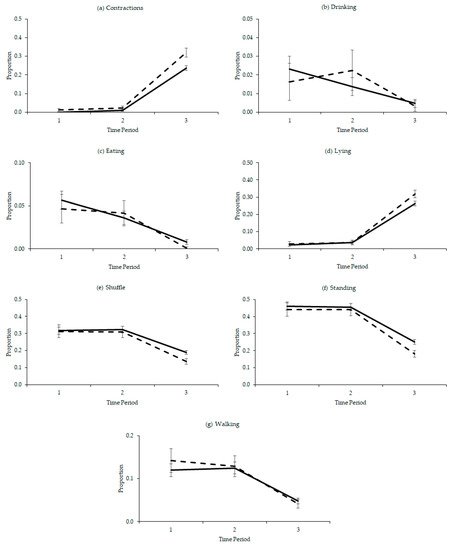
| Time period × behavior | |||||
| Period 1/Contractions | |||||
| 0.002 (0.003) | |||||
| 12 | |||||
| 40.2 | |||||
| <0.001 | |||||
| Period 1/Drinking | |||||
| 0.02 (0.01) | |||||
| Period 1/Eating | 0.05 (0.01) | ||||
| Period 1/Lying | 0.03 (0.01) | ||||
| Period 1/Shuffle | 0.31 (0.02) | ||||
| Period 1/Stand | 0.45 (0.02) | ||||
| Period 1/Walking | 0.13 (0.02) | ||||
| Period 2/Contractions | 0.01 (0.01) | ||||
| Period 2/Drinking | 0.02 (0.01) | ||||
| Period 2/Eating | 0.04 (0.01) | ||||
| Period 2/Lying | 0.04 (0.01) | ||||
| Period 2/Shuffle | 0.31 (0.02) | ||||
| Period 2/Stand | 0.45 (0.02) | ||||
| Period 2/Walking | 0.13 (0.01) | ||||
| Period 3/Contractions | 0.28 (0.01) | ||||
| Period 3/Drinking | 0.004 (0.002) | ||||
| Period 3/Eating | 0.003 (0.002) | ||||
| Period 3/Lying | 0.29 (0.01) | ||||
| Period 3/Shuffle | 0.16 (0.01) | ||||
| Period 3/Stand | 0.21 (0.01) | ||||
| Period 3/Walking | 0.04 (0.01) | ||||
| Time period × behavior × assistance 4 | 12 | 0.5 | 0.926 |
3. Discussion
References
- Rutten, C.J.; Kamphuis, C.; Hogeveen, H.; Huijps, K.; Nielen, M.; Steeneveld, W. Sensor data on cow activity, rumination, and ear temperature improve prediction of the start of calving in dairy cows. Comput. Electron. Agric. 2017, 132, 108–118.
- Giaretta, E.; Marliani, G.; Postiglione, G.; Magazzù, G.; Pantò, F.; Mari, G.; Formigoni, A.; Accorsi, P.A.; Mordenti, A. Calving time identified by the automatic detection of tail movements and rumination time, and observation of cow behavioral changes. Animal 2021, 15, 100071.
- Cangar, Ö.; Leroy, T.; Guarino, M.; Vranken, E.; Fallon, R.; Lenehan, J.; Mee, J.; Berckmans, D. Automatic real-time monitoring of locomotion and posture behavior of pregnant cows to calving using online image analysis. Comput. Electron. Agric. 2008, 64, 53–60.
- Bell, M.J.; Tzimiropoulos, G. Novel monitoring systems to obtain dairy cattle phenotypes associated with sustainable production. Front. Sustain. Food Syst. 2018, 2, 31.
- Miedema, H.M.; Cockram, M.S.; Dwyer, C.M.; MacRae, A.I. Changes in the behaviour of dairy cows during the 24h before normal calving compared with behaviour during late pregnancy. Appl. Animal Behav. Sci. 2011, 131, 8–14.
- Hyslop, J.; Ross, D.; Bell, M.; Dwyer, C. Observations on the time course of calving events in unassisted multiparous spring calving suckler cows housed in a straw bedded yard. In Proceedings of the British Society of Animal Science; Cambridge University Press: Cambridge, UK, 2008; p. 158.
- Lombard, J.E.; Garry, F.B.; Tomlinson, S.M.; Garber, L.P. Impacts of Dystocia on Health and Survival of Dairy Calves. J. Dairy Sci. 2007, 90, 1751–1760.
- Barrier, A.C.; Haskell, M.J.; Birch, S.; Bagnall, A.; Bell, D.J.; Dickinson, J.; Macrae, A.I.; Dwyer, C.M. The impact of dystocia on dairy calf health, welfare, performance and survival. Vet. J. 2013, 195, 86–90.
- McGuirk, B.J.; Forsyth, R.; Dobson, H. Economic cost of difficult calvings in the United Kingdom dairy herd. Vet. Rec. 2007, 161, 685–687.
- Schuenemann, G.M.; Nieto, I.; Bas, S.; Galvão, K.N.; Workman, J. Assessment of calving progress and reference times for obstetric intervention during dystocia in Holstein dairy cows. J. Dairy Sci. 2011, 94, 5494–5501.
- Weary, D.M.; Huzzey, J.M.; von Keyserlingk, M.A.G. Board-invited review: Using behavior to predict and identify ill health in animals. J. Anim. Sci. 2009, 87, 770–777.
- Smid, A.-M.C.; Weary, D.M.; von Keyserlingk, M.A.G. The influence of different types of outdoor access on dairy cattle behavior. Front. Vet. Sci. 2020, 7, 257.
- Diosdado, J.; Barker, Z.; Hodges, H.; Amory, J.; Croft, D.; Bell, N.; Codling, E. Classification of behavior in housed dairy cows using an accelerometer-based activity monitoring system. Anim. Biotelemetry 2015, 3, 15.
- Rahman, A.; Smith, D.; Little, B.; Ingham, A.; Greenwood, P.; Bishop-Hurley, G. Cattle behavior classification from collar, halter, and ear tag sensors. Inf. Process. Agric. 2018, 5, 124–133.
- Benaissa, S.; Tuyttens, F.; Plets, D.; Pessemier, T.; Trogh, J.; Tanghe, E.; Martens, L.; Vandaele, L.; Van Nuffel, A.; Joseph, W.; et al. On the use of on-cow accelerometers for the classification of behaviors in dairy barns. Res. Vet. Sci. 2019, 125, 425–433.
- Huzzey, J.M.; von Keyserlingk, M.A.G.; Weary, D.M. Changes in Feeding, Drinking, and Standing Behavior of Dairy Cows during the Transition Period. J. Dairy Sci. 2005, 88, 2454–2461.
- Munksgaard, L.; Jensen, M.B.; Pedersen, L.J.; Hansen, S.W.; Matthews, L. Quantifying behavioural priorities—Effects of time constraints on behaviour of dairy cows, Bos taurus. Appl. Anim. Behav. Sci. 2005, 92, 3–14.
