Forest connectivity is critical for the long-term persistence and range shifts of forest-dependent species. In the face of contemporary climate change, the climate connectivity of forested areas is one of the most important factors that determine species’ ability to track suitable climate niches. Climate connectivity is defined as the degree to which a landscape allows species to shift their ranges to suitable habitats that are the same or cooler than their current habitats as the climate warms. Improving climate connectivity is both a necessary action and a viable solution to reduce the likelihood of local extinctions and biodiversity loss. This is particularly urgent considering the rapid rate of climate change, which is expected to cause large shifts in the distributions of species in European forests.
- climate change
- species migration
- landscape connectivity
- European forests
1. Introduction
2. Identify Forest Patches
The study area covered 43 European countries for which forest-cover data were obtained from Corine land-cover datasets for the year 2018 (https://land.copernicus.eu/pan-european/corine-land-cover/clc2018, accessed on 22 May 2021). Three forest types were taken into account: broad-leaved forests, coniferous forests, and mixed forests. We classified the raster data of land cover to either forested or non-forested cells and resampled the forest-cover map to a resolution of 1 km. As our study considered climate change the main driver of species range shifts, the forested cells were partitioned into forest patches based on their temperatures. Climate data were obtained from the WorldClim Version 2 database [28] (https://www.worldclim.org, accessed on 22 May 2021). We used the annual mean temperature data at a spatial resolution of 30 seconds for the years 1970–2000 as current temperature data. We then projected the temperature data in our study area to the projection of the land-cover data—the Lambert azimuthal equal-area (ETRS_1989_LAEA) projection—and resampled them to a resolution of 1 km, using bilinear interpolation. By overlapping the current temperature map and the forest-cover map, the forested cells were assigned to their current temperature values, which were then reclassified to 1 °C increments over a full range of −3 to 20 °C. The resulting raster data were converted into polygons to aggregate neighbouring forested cells in the same temperature increment into forest patches (Figure 1a). To facilitate the following computation of inter-patch distances, we removed patches smaller than 10 km2. These patches may be too small to allow sufficient population sizes for long-term persistence and range shifts [1]. The same patch-size threshold has been used in previous analyses on climate connectivity at regional and continental scales [11,12,27][11][12][27].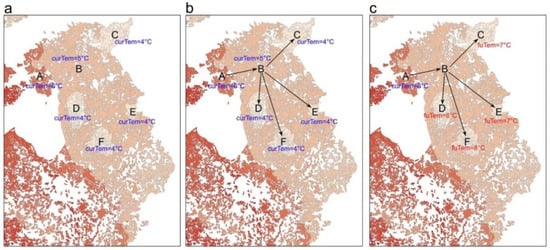
3. Evaluate Climate Connectivity
The distributions of terrestrial species have been found to be related to latitudinal shifts in isotherms [29]. Therefore, our method assumed that species trace suitable climate conditions through directional paths traversing gradients of hotter to cooler patches. Patches within 2 km of each other are assumed to be connected enough for species to move across non-forest areas [11,27][11][27]. This assumption allows for an assessment of the structural connectivity between forested areas for terrestrial species to reach future habitats. In this way, the dispersal abilities of species are not considered in the study, in contrast to those studies that focus on functional connectivity [4,12][4][12]. Here, we used an ArcGIS extension, Conefor Input tool, to calculate the pairwise (Euclidean) distances between edges of forest patches within a distance threshold of 2 km. Based on the current temperatures of forest patches, we identified directional paths between patches from hotter to cooler (Figure 1b), using the Python NetworkX package. We then built a directed graph with all the directional paths and used Dijkstra’s method to compute the shortest directional paths between all patches in the graph. After that, we identified the coolest destination in the future that can be reached from each patch as a designated destination for the origin patch (Figure 1c). For patches that are not connected to cooler neighbours, their destinations were assigned as themselves. According to the definition of climate connectivity, our study aimed to measure the extent to which European forest cover allows species to reach suitable habitats that are the same or cooler in the future than the temperatures they currently experience. To this end, climate connectivity can be measured as the maximum temperature difference between each patch and its destinations along temperature gradients. More specifically, the climate connectivity of each forest patch was calculated as its current temperature minus the future temperature of its coolest reachable patch. Higher values indicate better climate connectivity. Zero or positive values of climate connectivity suggest a success to achieve enough connectivity for climate-driven range shifts, while patches with negative values indicate a failure at achieving climate connectivity.References
- Haddad, N.M.; Brudvig, L.A.; Clobert, J.; Davies, K.F.; Gonzalez, A.; Holt, R.D.; Lovejoy, T.E.; Sexton, J.O.; Austin, M.P.; Collins, C.D.; et al. Habitat fragmentation and its lasting impact on Earth’s ecosystems. Sci. Adv. 2015, 1, e1500052.
- Watson, J.E.M.; Evans, T.; Venter, O.; Williams, B.; Tulloch, A.; Stewart, C.; Thompson, I.; Ray, J.C.; Murray, K.; Salazar, A.; et al. The exceptional value of intact forest ecosystems. Nat. Ecol. Evol. 2018, 2, 599–610.
- Betts, M.G.; Wolf, C.; Ripple, W.J.; Phalan, B.; Millers, K.A.; Duarte, A.; Butchart, S.H.M.; Levi, T. Global forest loss disproportionately erodes biodiversity in intact landscapes. Nature 2017, 547, 441–444.
- Littlefield, C.E.; McRae, B.H.; Michalak, J.L.; Lawler, J.J.; Carroll, C. Connecting today’s climates to future climate analogs to facilitate movement of species under climate change. Conserv. Biol. 2017, 31, 1397–1408.
- Guo, F.; Lenoir, J.; Bonebrake, T.C. Land-use change interacts with climate to determine elevational species redistribution. Nat. Commun. 2018, 9, 1315.
- Honnay, O.; Verheyen, K.; Butaye, J.; Jacquemyn, H.; Bossuyt, B.; Hermy, M. Possible effects of habitat fragmentation and climate change on the range of forest plant species. Ecol. Lett. 2002, 5, 525–530.
- Walther, G.R.; Post, E.; Convey, P.; Menzel, A.; Parmesan, C.; Beebee, T.J.; Fromentin, J.M.; Hoegh-Guldberg, O.; Bairlein, F. Ecological responses to recent climate change. Nature 2002, 416, 389–395.
- Pecl, G.T.; Araújo, M.B.; Bell, J.D.; Blanchard, J.; Bonebrake, T.C.; Chen, I.-C.; Clark, T.D.; Colwell, R.K.; Danielsen, F.; Evengård, B.; et al. Biodiversity redistribution under climate change: Impacts on ecosystems and human well-being. Science 2017, 355, eaai9214.
- Lenoir, J.; Svenning, J.-C. Climate-related range shifts—A global multidimensional synthesis and new research directions. Ecography 2015, 38, 15–28.
- Dullinger, S.; Dendoncker, N.; Gattringer, A.; Leitner, M.; Mang, T.; Moser, D.; Mucher, C.A.; Plutzar, C.; Rounsevell, M.; Willner, W.; et al. Modelling the effect of habitat fragmentation on climate-driven migration of European forest understorey plants. Divers. Distrib. 2015, 21, 1375–1387.
- McGuire, J.L.; Lawler, J.J.; McRae, B.H.; Nunez, T.A.; Theobald, D.M. Achieving climate connectivity in a fragmented landscape. Proc. Natl. Acad. Sci. USA 2016, 113, 7195–7200.
- Su, J.; Yin, H.; Kong, F. Ecological networks in response to climate change and the human footprint in the Yangtze River Delta urban agglomeration, China. Landsc. Ecol. 2020, 36, 2095–2112.
- Keeley, A.T.H.; Ackerly, D.D.; Cameron, D.R.; Heller, N.E.; Huber, P.R.; Schloss, C.A.; Thorne, J.H.; Merenlender, A.M. New concepts, models, and assessments of climate-wise connectivity. Environ. Res. Lett. 2018, 13, 073002.
- Parks, S.A.; Carroll, C.; Dobrowski, S.Z.; Allred, B.W. Human land uses reduce climate connectivity across North America. Glob. Chang. Biol. 2020, 26, 2944–2955.
- Steinacker, C.; Beierkuhnlein, C.; Jaeschke, A. Assessing the exposure of forest habitat types to projected climate change-Implications for Bavarian protected areas. Ecol. Evol. 2019, 9, 14417–14429.
- Kullman, L. 20th Century Climate Warming and Tree-limit Rise in the Southern Scandes of Sweden. Ambio 2001, 30, 72–80.
- Devictor, V.; van Swaay, C.; Brereton, T.; Brotons, L.; Chamberlain, D.; Heliölä, J.; Herrando, S.; Julliard, R.; Kuussaari, M.; Lindström, Å.; et al. Differences in the climatic debts of birds and butterflies at a continental scale. Nat. Clim. Chang. 2012, 2, 121–124.
- Penteriani, V.; Zarzo-Arias, A.; Novo-Fernandez, A.; Bombieri, G.; Lopez-Sanchez, C.A. Responses of an endangered brown bear population to climate change based on predictable food resource and shelter alterations. Glob. Chang. Biol. 2019, 25, 1133–1151.
- Araujo, M.B.; Alagador, D.; Cabeza, M.; Nogues-Bravo, D.; Thuiller, W. Climate change threatens European conservation areas. Ecol. Lett. 2011, 14, 484–492.
- Wessely, J.; Hülber, K.; Gattringer, A.; Kuttner, M.; Moser, D.; Rabitsch, W.; Schindler, S.; Dullinger, S.; Essl, F. Habitat-based conservation strategies cannot compensate for climate-change-induced range loss. Nat. Clim. Chang. 2017, 7, 823–827.
- Virkkala, R.; Heikkinen, R.K.; Fronzek, S.; Kujala, H.; Leikola, N. Does the protected area network preserve bird species of conservation concern in a rapidly changing climate? Biodivers. Conserv. 2012, 22, 459–482.
- Rüter, S.; Vos, C.C.; van Eupen, M.; Rühmkorf, H. Transboundary ecological networks as an adaptation strategy to climate change: The example of the Dutch—German border. Basic Appl. Ecol. 2014, 15, 639–650.
- Hamann, A.; Roberts, D.R.; Barber, Q.E.; Carroll, C.; Nielsen, S.E. Velocity of climate change algorithms for guiding conservation and management. Glob. Chang. Biol. 2015, 21, 997–1004.
- Brito-Morales, I.; Garcia Molinos, J.; Schoeman, D.S.; Burrows, M.T.; Poloczanska, E.S.; Brown, C.J.; Ferrier, S.; Harwood, T.D.; Klein, C.J.; McDonald-Madden, E.; et al. Climate Velocity Can Inform Conservation in a Warming World. Trends Ecol. Evol. 2018, 33, 441–457.
- Dobrowski, S.Z.; Parks, S.A. Climate change velocity underestimates climate change exposure in mountainous regions. Nat. Commun. 2016, 7, 12349.
- Carroll, C.; Parks, S.A.; Dobrowski, S.Z.; Roberts, D.R. Climatic, topographic, and anthropogenic factors determine connectivity between current and future climate analogs in North America. Glob. Chang. Biol. 2018, 24, 5318–5331.
- Senior, R.A.; Hill, J.K.; Edwards, D.P. Global loss of climate connectivity in tropical forests. Nat. Clim. Chang. 2019, 9, 623–626.
- Fick, S.E.; Hijmans, R.J. WorldClim 2: New 1-km spatial resolution climate surfaces for global land areas. Int. J. Climatol. 2017, 37, 4302–4315.
- Chen, I.C.; Hill, J.K.; Ohlemuller, R.; Roy, D.B.; Thomas, C.D. Rapid range shifts of species associated with high levels of climate warming. Science 2011, 333, 1024–1026.