Polyploidy has played an important evolutionary role in the genus Festuca (Poaceae), and several ploidy levels (ranging from 2n = 2x = 14 to 2n = 12x = 84) have been detected to date. Our understanding of ploidy diversity has greatly improved over the last two decades owing to the usage of flow cytometry (FCM). This valuable method makes it possible to not only estimate the genome size in a large number of individuals and populations but also infer ploidy levels. FCM has been used successfully in Festuca and its use is very useful in detecting a possible overlooked cytogenetic diversity that is generally manifested in the morphological variability exhibited in some of its taxa.
- Festuca
- flow cytometry
- genome size
- nuclear DNA content
- Poaceae
1. Introduction
| Subspecies (According to Devesa et al., [13]) | 2n | Method | References |
|---|---|---|---|
| F. yvesii subsp. yvesii | 2n = 6x = 42 * | Counting 1 | [19] |
| 2n = 8x = 56 | Counting 1 | [17] | |
| F. yvesii subsp. altopyrenaica | 2n = 4x = 28 | Counting 2 | [20] |
| F. yvesii subsp. summilusitana | 2n = 6x = 42 | Counting 3,4 | [17][18] |
| 2n = 10x = 70 | Counting and FCM 4 | [12][17] | |
| 2n = 12x = 84 | Counting and FCM 4 | [12] | |
| F. yvesii subsp. lagascae | 2n = 6x = 42 | Counting 5 | [17] |
| 2n = 8x = 56 | Counting 1 | [17] |
1 F. yvesii, 2 F. altopyrenaica, 3 F. gredensis, 4 F. summilusitana, 5 F. curvifolia.
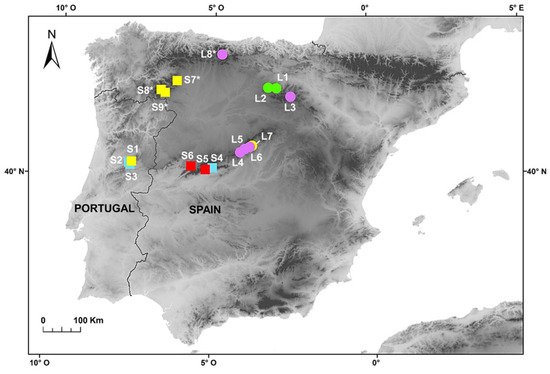
2. Plant Material and Geographical Origin
3. Cytogenetic Variation
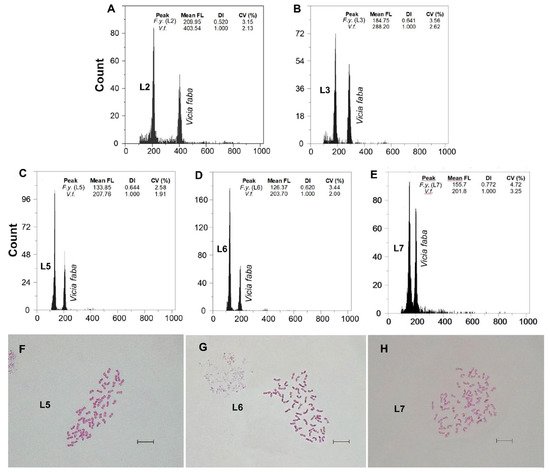
Fluorescence histograms of relative nuclear DNA content showed high-quality G1 peaks. The coefficients of variation (CVs) for fresh fescue samples were all within the normal range, below 5.0% (mean CVs = 3.48%), indicating reliable estimations (Figure 2A–E and Figure 3A–E). Genome size data for each subspecies and population are shown in Table 2.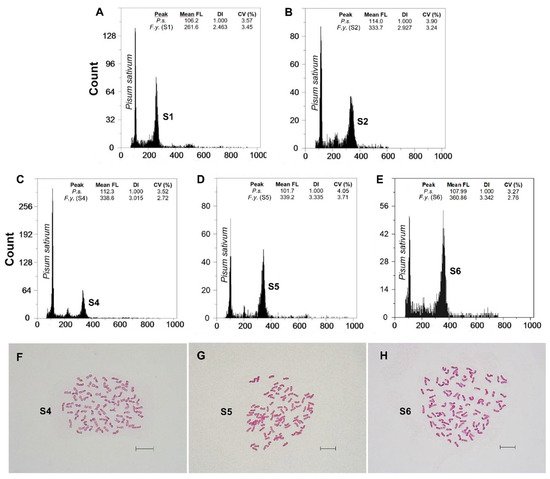
| Taxon | Mountain Range | Locality | n | 2C Mean ± SD (pg) | 2C Range (pg) | Material | DNA-Ploidy Level | 2n |
|---|---|---|---|---|---|---|---|---|
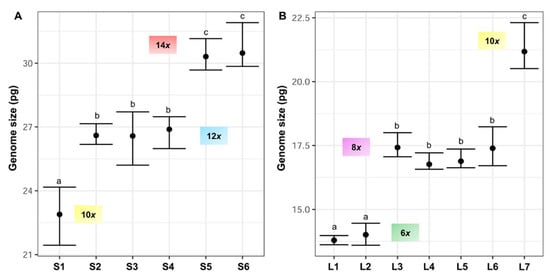
| F. yvesii subsp. summilusitana | W range: Serra da Estrela (Portugal) | S1: Castelo Branco, Manteigas | 9 | 22.89 ± 0.96 | 21.44–24.17 | F | 10x | - |
| S2: Castelo Branco, Sabugueiro | 8 | 26.60 ± 0.35 | 26.18–27.15 | F | 12x | - | ||
| S3: Castelo Branco, Torre | 6 | 26.58 ± 0.87 | 25.20–27.71 | F | 12x | - | ||
| C-W range: Sierra de Gredos and Candelario (Spain) | S4: Ávila, Puerto del Pico | 5 | 26.89 ± 0.55 | 25.98–27.48 | F | 12x | 84 | |
| S5: Ávila, Plataforma de Gredos | 7 | 30.31 ± 0.49 | 29.68–31.16 | F | 14x | 98 | ||
| S6: Salamanca, La Covatilla | 6 | 30.48 ± 0.73 | 29.85–31.91 | F | 14x | 98 | ||
| NW mountains (Spain) | S7: León, Villalibre de Somoza | 3 | 24.67 ± 1.47 | 23.01–25.84 | D | 10x | - | |
| S8: Zamora, Sierra Segundera | 1 | 24.11 | D | 10x | - | |||
| S9: Zamora, Alto de San Juan | 1 | 24.82 | D | 10x | - | |||
| F. yvesii subsp. lagascae | n range: Sierra de la Demanda and Cebollera (Spain) | L1: Logroño, Valdezcaray | 6 | 13.79 ± 0.15 | 13.62–13.98 | F | 6x | - |
| L2: Burgos, Trigaza | 10 | 14.01 ± 0.32 | 13.60–14.46 | F | 6x | - | ||
| L3: Logroño/Soria, Puerto de Piqueras | 10 | 17.42 ± 0.29 | 17.06–18.00 | F | 8x | - | ||
| C range: Sierra de Guadarrama (Spain) | L4: Madrid, Puerto de Guadarrama | 7 | 16.76 ± 0.22 | 16.57–17.21 | F | 8x | 56 | |
| L5: Madrid, Puerto de Navacerrada | 7 | 16.88 ± 0.24 | 16.63–17.36 | F | 8x | 56 | ||
| L6: Madrid, Puerto de la Morcuera | 4 | 17.39 ± 0.65 | 16.71–18.23 | F | 8x | 56 | ||
| L7: Madrid, Puerto de Canencia | 9 | 21.18 ± 0.62 | 20.51–22.31 | F | 10x | 70 | ||
| North range: Cantabrian mountains (Spain) | L8: Puerto de San Glorio | 2 | 19.31 ± 0.41 | 19.02–19.59 | D | 8x | - |
4. Morphological Variation
In general, the largest sizes for all the characters were found in the subsp. summilusitana, with the exception of the auricle and awn lengths. In both subspecies, most of the morphological traits increased in size with increasing ploidy; however, no significant differences were observed with respect to all ploidy levels. The lemma, upper glume and seed lengths in particular responded significantly to changes in ploidy in both subspecies. The differences observed in the arithmetic mean obtained for most of the characters are significant only among the most extreme cytotypes of each subspecies, and even in these cases, the ranges of variation overlap.
References
- Soltis, D.E.; Soltis, P.S. Polyploidy: Recurrent formation and genome evolution. Trends Ecol. Evol. 1999, 14, 348–352.
- Otto, S.P.; Whitton, J. Polyploidy incidence and evolution. Annu. Rev. Genet. 2000, 34, 401–437.
- Soltis, D.E.; Visger, C.J.; Marchant, D.B.; Soltis, P.S. Polyploidy: Pitfalls and paths to a paradigm. Am. J. Bot. 2016, 103, 1146–1166.
- Stebbins, G.L. Chromosomal Evolution in Higher Plants; Edward Arnold: London, UK, 1971; pp. 1–216.
- Beaulieu, J.M.; Leitch, I.J.; Patel, S.; Pendharkar, A.; Knight, C.A. Genome size is a strong predictor of cell size and stomatal density in angiosperms. New Phytol. 2008, 179, 975–986.
- Balao, F.; Herrera, J.; Talavera, S. Phenotypic consequences of polyploidy and genome size at the microevolutionary scale: A multivariate morphological approach. New Phytol. 2011, 192, 256–265.
- Rios, E.F.; Kenworthy, K.E.; Munoz, P.R. Association of phenotypic traits with ploidy and genome size in annual ryegrass. Crop Sci. 2015, 55, 2078–2090.
- Levy, A.A.; Feldman, M. The impact of polyploidy on grass genome evolution. Plant Physiol. 2002, 130, 1587–1593.
- Watson, L.; Dallwitz, M.J. The Grass Genera of the World; CAB International: Wallingford, UK, 1992; pp. 1–1038.
- Clayton, W.D.; Vorontsova, M.S.; Harman, K.T.; Williamson, H. GrassBase—The Online World Grass Flora 2006 onwards. Available online: (accessed on 14 April 2021).
- Malik, C.P.; Thomas, P.T. Karyotypic studies in some Lolium and Festuca species. Caryologia 1966, 19, 167–196.
- Loureiro, J.; Kopecký, D.; Castro, S.; Santos, C.; Silveira, P. Flow cytometric and cytogenetic analices of Iberian Peninsula Festuca spp. Plant Syst. Evol. 2007, 269, 89–105.
- Devesa, J.A.; Martínez-Sagarra, G.; López Nieto, E.; Muñoz Rodríguez, A.; Cebolla, C.; Ortúñez, E. Festuca L. In Flora Iberica; Devesa, J.A., Romero Zarco, C., Buira, A., Quintanar, A., Aedo, C., Eds.; Real Jardín Botánico, CSIC: Madrid, Spain, 2020; Volume 19, pp. 200–373.
- Martínez Sagarra, G.; Devesa, J.A. Sobre el nombre Festuca yvesii subsp. graniticola (Kerguélen & Morla) Mart.-Sagarra & Devesa. Acta Bot. Malac. 2021, 46.
- Kerguélen, M.; Morla, C. Festuca graniticola, nueva especie del noroeste de la Península Ibérica. Anales Jard. Bot. Madrid 1985, 42, 155–158.
- Fuente, V.; Ortúñez, E. Nueva especie de Festuca, L. sección Festuca (Poaceae) en la Península Ibérica. Lazaroa 2000, 21, 3–6.
- Fuente, V.; Ferrero, L.M.; Ortúñez, E. Chromosome counts in the genus Festuca L. section Festuca (Poaceae) in the Iberian Peninsula. Bot. J. Linn. Soc. 2001, 137, 385–398.
- Ortúñez, E.; Fuente, V. Reports (394-400) in Mediterranean chromosome number reports. Fl. Medit. 1995, 5, 261–265.
- Kerguélen, M. Les Gramineae (Poaceae) de la flore française. Essai de mise au point taxonomique et nomenclaturale. Lejeuniaser. 2 1975, 75, 1–343.
- Fuente, V.; Ortúñez, E. A new species of Festuca L. (Poaceae) from Pyrenees (Spain). Fontqueria 1994, 40, 35–42.