Urban development is one of the leading causes of biodiversity change. Understanding how soil microorganisms respond to urbanization is particularly important because they are crucial for the provisioning of ecosystem functions and services. Our results showed that microbial richness and community composition exhibited nonsignificant changes over time regardless of the location. Soil fungal richness was lower in moderately and highly urbanized locations, but soil bacterial/archaeal richness was not significantly different among locations. Both bacteria/archaea and fungi exhibited significant differences in community composition across locations. After inferring potential functional groups, soils in the highly urbanized location had lower proportions of arbuscular mycorrhizal fungi and soil saprotrophic fungi but had higher proportions of bacterial taxa involved in aromatic compound degradation, human pathogens, and intracellular parasites. Furthermore, ammonia-oxidizing bacteria were more abundant in the highly urbanized location, but ammonia-oxidizing archaea were more abundant in lowly and moderately urbanized locations. Together, these results highlight the significant changes in belowground microbial communities across an urbanization gradient, and these changes might have important implications for aboveground–belowground interactions, nutrient cycling, and human health.
1. Introduction
Urban development is modifying natural landscapes, as well as altering biodiversity and ecosystem services, at an unprecedented rate [
1]. Currently, 55% of the global population is living in urban areas, and this proportion is projected to increase to 68% by 2050 [
2]. Residents of urban landscapes live at high densities and built structures cover most of the land surface, resulting in significant modifications to the natural environment [
3]. For example, in arid ecosystems, green-space fragmentation can impact biodiversity through natural habitat reduction and net primary production changes [
4]. One major ecological consequence of urbanization is biotic homogenization, in which ecological communities become progressively more similar due to human-induced landscape simplification or species invasions [
5]. Most research has focused primarily on understanding how plants and animals either adapt or go extinct due to urban pressures such as increased nutrient inputs, atmospheric pollution, and habitat degradation [
6]. However, the consequences of urbanization on microbial communities have received little attention (but see [
7]).
Studying how microorganisms respond to urbanization is particularly relevant given their fundamental roles in maintaining ecosystem functions and services [
8], notably human health and well-being [
9]. On the one hand, some microbes can cause infectious diseases to humans by acting as important pathogens [
10]. On the other hand, it has been proposed that the positive health effects of proximity to nature might be attributable to the exposure to microbial diversity that builds up the antigenic repertoire of the immune system [
11].
Urbanization can have significant impacts on microbial richness and community composition. Previous studies have shown that urbanization often leads to decreasing geographic variability in microbial community composition [
12,
13]. However, the effects of urbanization can vary among microbial taxonomic groups. For example, soil fungal richness was found to decrease in highly urbanized areas, but bacterial richness showed no response [
13]. Another soil study showed that fungal richness and community composition did not differ with urban stress, whereas bacterial community composition did [
14]. Furthermore, urban development in arid ecosystems can alter soil microbial carbon and nutrient cycling by shaping the types of microorganisms found in urban habitats [
15]. While these studies have provided significant insights into the ecological impacts of urbanization on microbial communities, it remains largely unknown whether or not the temporal dynamics of microbial communities change across urbanization gradients. It has been argued that the richness and community composition of microorganisms can vary across days, seasons, and years [
16,
17,
18,
19]. Such temporal changes in microbial communities can reflect community stability and have important implications for predicting microbial responses to disturbances [
20]. Therefore, a better understanding of the ecological impacts of urbanization on microorganisms requires longitudinal studies that examine how the temporal dynamics of microbial communities vary across urbanization gradients.
Globally, arid ecosystems constitute 41% of the land surface and are home to over 38% of the human population, and these numbers are likely to increase substantially as a consequence of desertification and the projected population growth [
21]. The arid Southwestern USA is experiencing one of the fastest population growths in the country [
22]. Denser populations in arid areas with higher urbanization pressure require solutions that consider the role of environmental microorganisms. Here, we collected monthly soil samples over one year across three locations representing an urbanization gradient in Tucson, Arizona, USA (
Figure 1). We characterized the soil bacterial/archaeal and fungal communities by sequencing environmental DNA in order to examine if the soil microbial richness and community composition, as well as their temporal dynamics, change across the urbanization gradient.
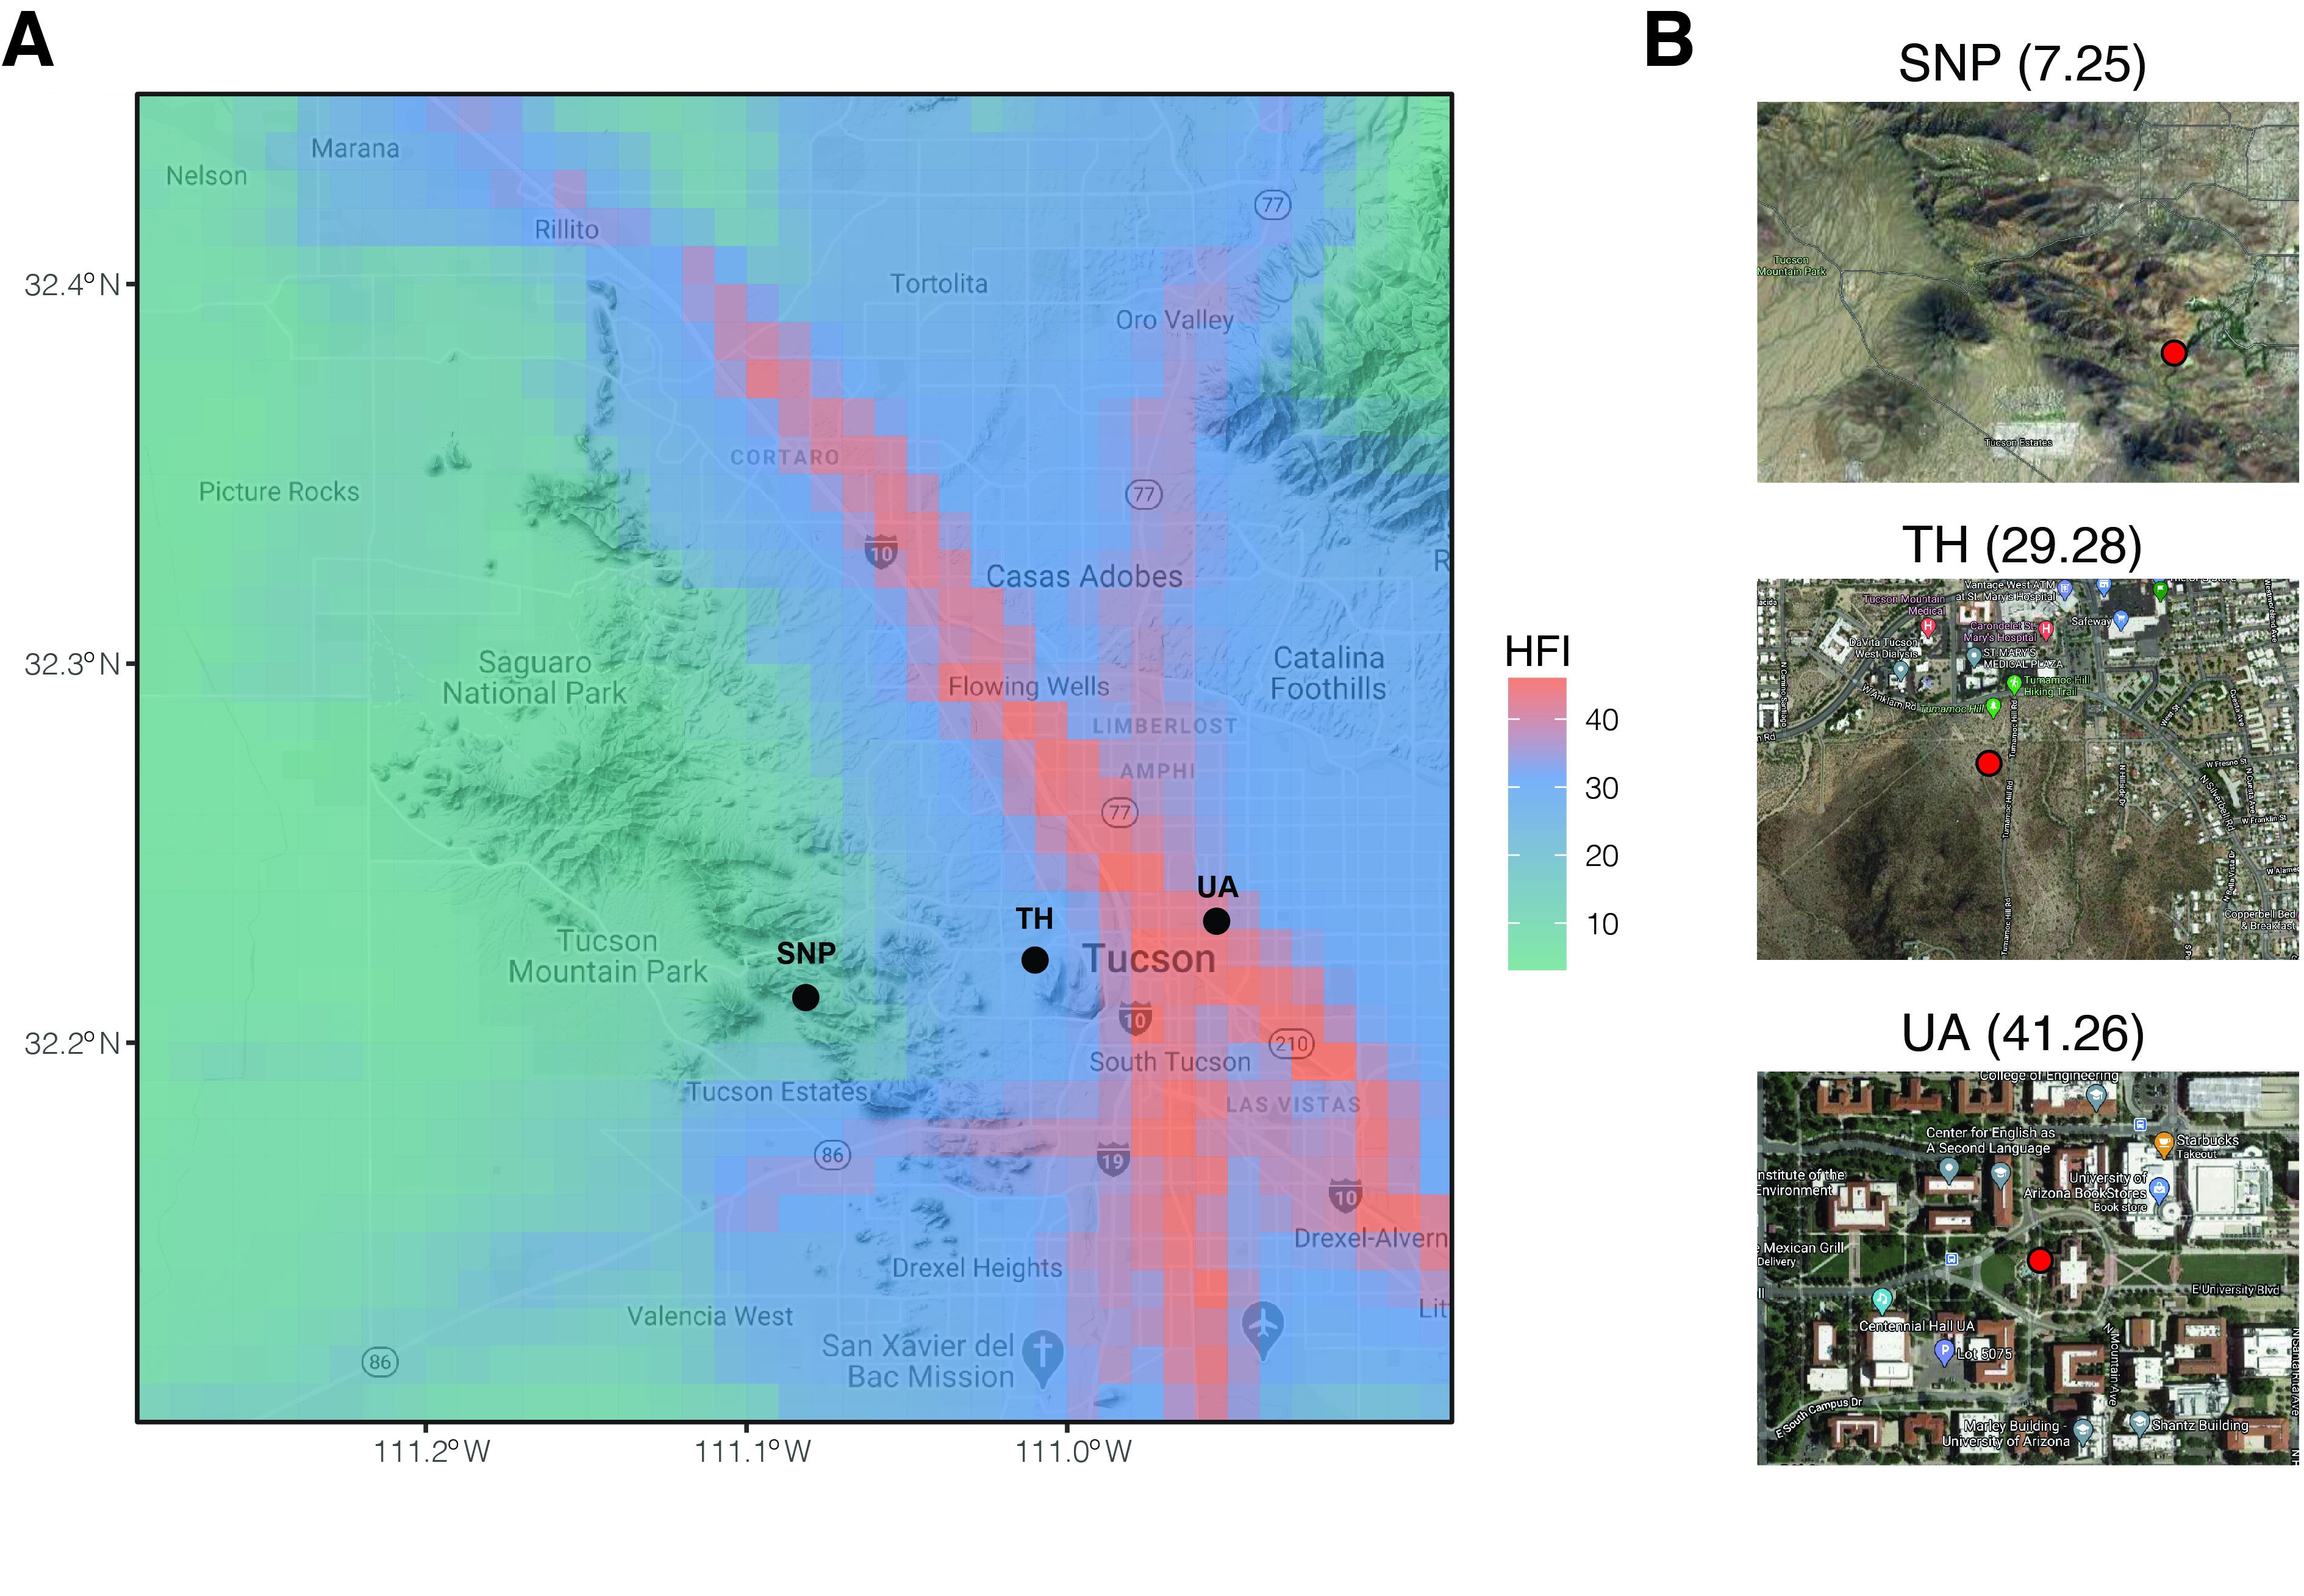
Figure 1. Sampling locations in this study. (A) Map is overlayed by human footprint index (HFI). Black points denote sampling locations. (B) A zoomed view of each sampling location. Red points denote sampling plots. Numbers in brackets are human footprint index. SNP: Saguaro National Park. TH: Tumamoc Hill. UA: University of Arizona.
2. General Description of Microbial Communities
2. General Description of Microbial Communities
After quality filtering, we obtained 8,648,018 sequences for soil bacteria/archaea and 5,858,931 sequences for soil fungi. These sequences were assembled into a total of 31,887 bacterial/archaeal phylotypes (
Table S1) and 6832 fungal phylotypes (
Table S2). On average, 1558 bacterial/archaeal phylotypes and 240 fungal phylotypes were detected per sample, with the range being 438–2443 for bacteria/archaea and 86–503 for fungi. At the class level, soil bacterial communities were dominated by
Alphaproteobacteria (range: 9.0–38.5%),
Actinobacteria (range: 6.4–25.8%),
Thermoleophilia (range: 3.0–21.7%),
Gammaproteobacteria (range: 1.9–8.5%), and
Rubrobacteria (range: 0.7–15.4%) across all samples (
Table S3). For fungal communities, the classes
Dothideomycetes (range: 9.2–76.6%),
Sordariomycetes (range: 7.3–67.6%),
Agaricomycetes (range: 0.06–49.6%), and
Eurotiomycetes (range: 0.06–14.7%) were the dominant lineages across all samples (
Table S4).
3. Effects of Location and Time on Predicting Microbial Richness and Community Composition
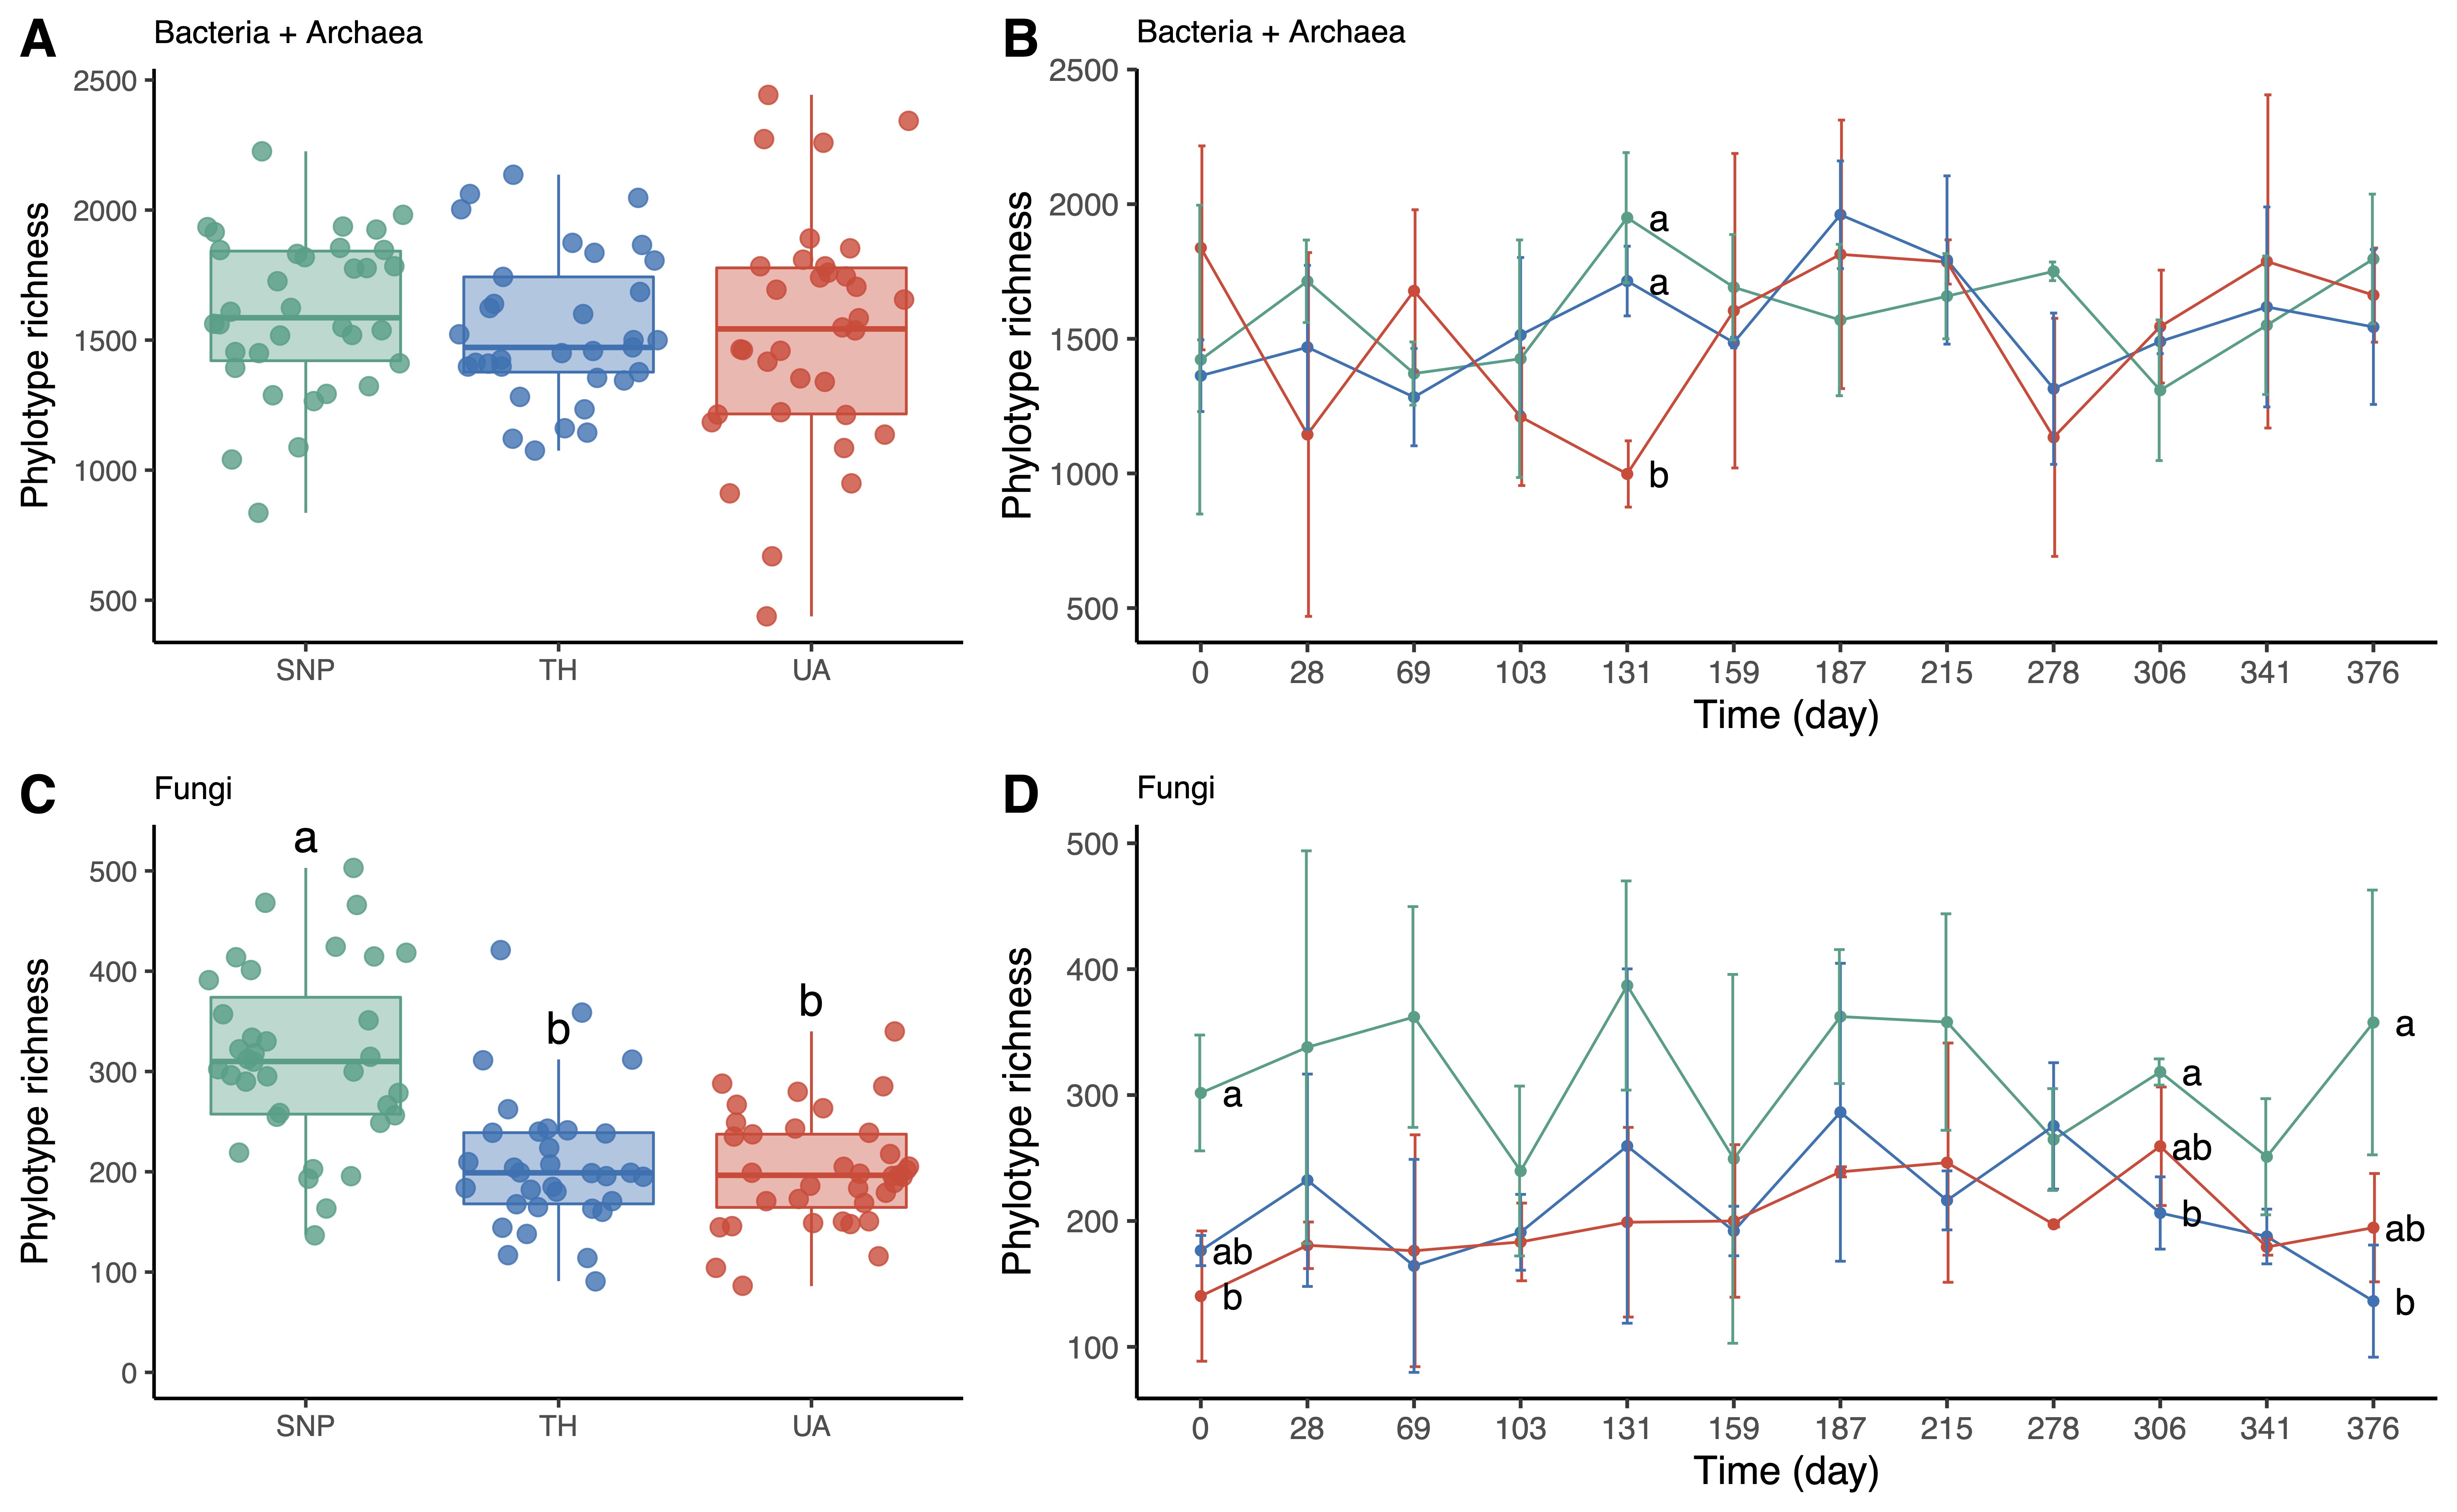
Soil bacterial/archaeal phylotype richness was not significantly different among locations or time (two-way ANOVA: location:
F2,95 = 0.43,
p = 0.65, time:
F1,95 = 1.44,
p = 0.23, location × time:
F2,95 = 0.08,
p = 0.93;
Figure 2A,B). Only at the 131st day of sampling, soil bacterial/archaeal communities were less diverse in the University of Arizona than in Tumamoc Hill and Saguaro National Park (
Figure 2B). In contrast, soil fungal phylotype richness was significantly different among locations but not time (two-way ANOVA: location:
F2,98 = 27.38,
p = 3.6 × 10
−10; time:
F1,98 = 0.11,
p = 0.74; location × time:
F2,98 = 0.96,
p = 0.39;
Figure 2C,D). Soil fungal richness was lower in the University of Arizona and Tumamoc Hill than in Saguaro National Park (
Figure 2C). This pattern was also observed at the beginning and near the end of the sampling period (the 0th, 306th, and 376th days;
Figure 2D).
Figure 2. Changes in microbial richness across locations. Different letters indicate significant difference (p < 0.05) based on Tukey’s HSD test. (A,C) Phylotype richness difference across locations. (B,D) Temporal change in phylotype richness. Horizontal axis denotes sampling day. Points are means of phylotype richness per day and error bars are standard deviations of the mean. Location abbreviations are the same as those in Figure 1.
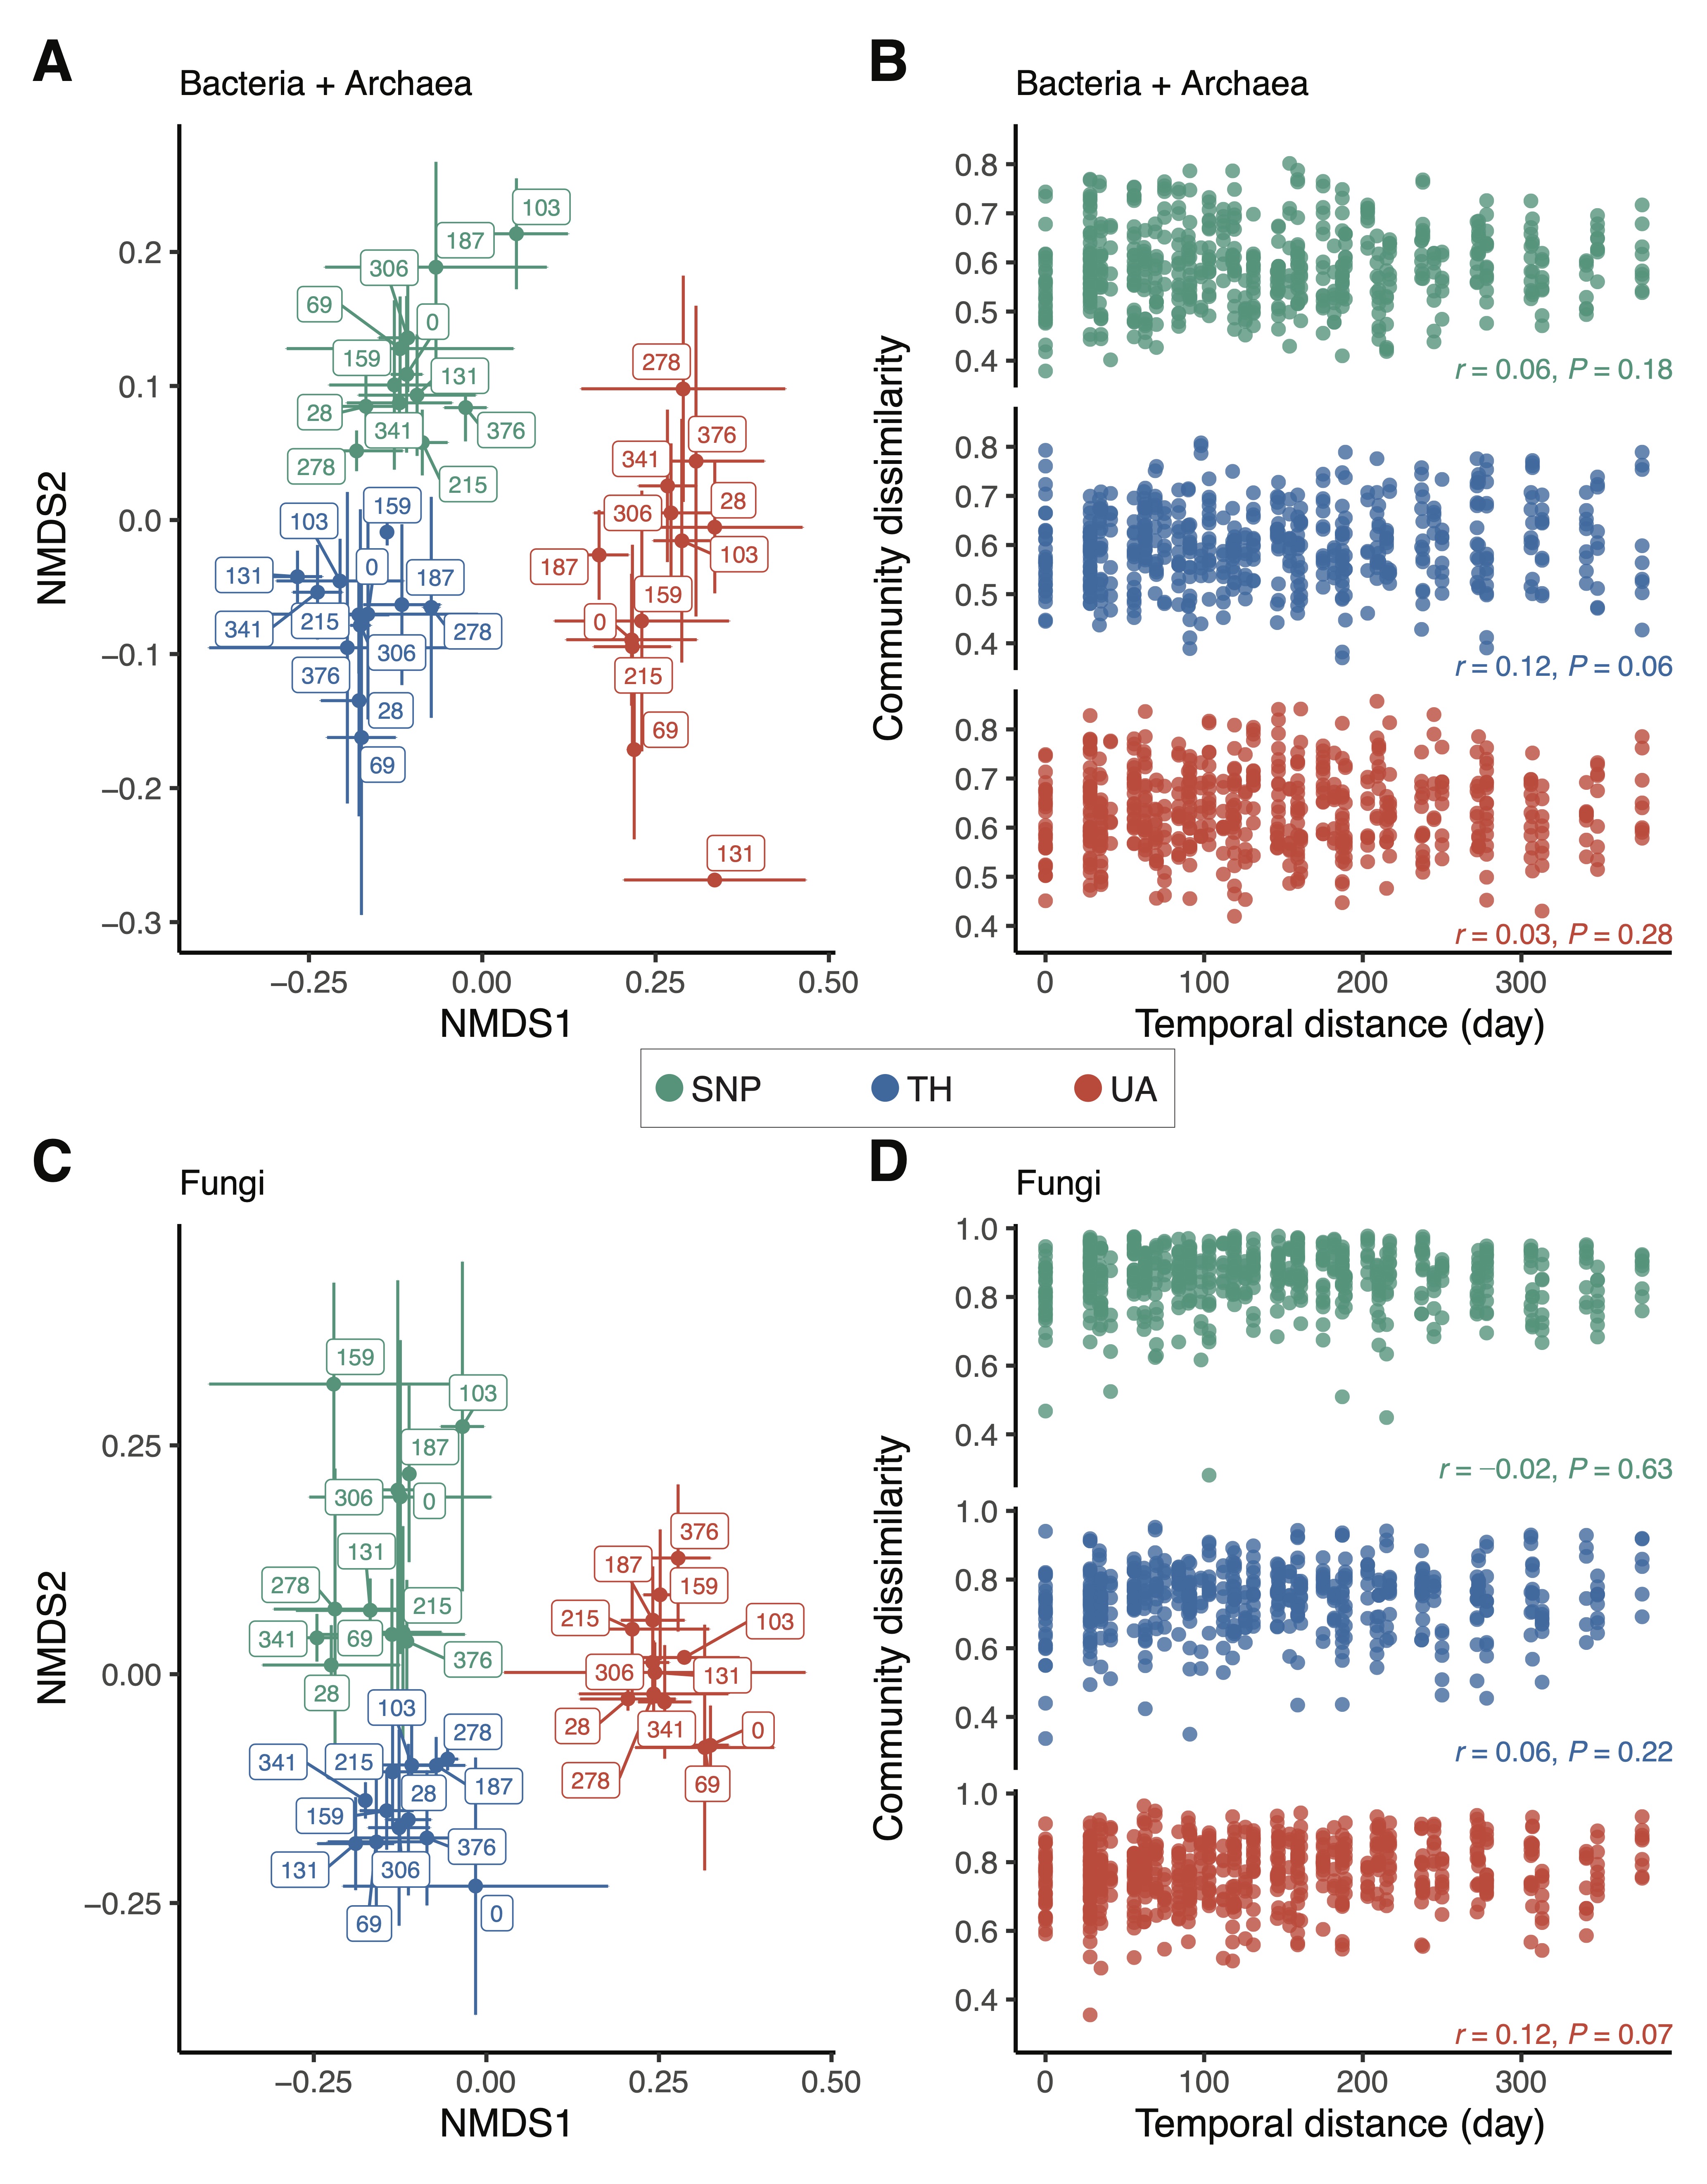
Location explained a much larger variation in bacterial/archaeal community composition than time (two-way PERMANOVA: location:
F2,95 = 19.40,
p = 0.001,
R2 = 0.28, time:
F1,95 = 2.28,
p = 0.008,
R2 = 0.02, location × time:
F2,95 = 1.50,
p = 0.04,
R2 = 0.02;
Figure 3A). There was no directional change in bacterial/archaeal community composition over time; samples collected closer in time did not have similar bacterial/archaeal community compositions (
Figure 3A), and there was no significant correlation between bacterial/archaeal community dissimilarity and temporal distance (Mantel test:
p > 0.05 in all locations;
Figure 3B). Likewise, location was more important than time in predicting fungal community composition (two-way PERMANOVA: location:
F2,98 = 11.40,
p = 0.001,
R2 = 0.18, time:
F1,98 = 1.22,
p = 0.12,
R2 = 0.01, location × time:
F2,98 = 1.28,
p = 0.07,
R2 = 0.02;
Figure 3C). Soil fungal community composition did not change in any particular direction over time (Mantel test:
p > 0.05 in all locations;
Figure 3D). The significant effect of location on predicting microbial community composition was also mirrored by the proportional changes of the dominant microbial lineages across the three locations. Compared to Tumamoc Hill and Saguaro National Park, soil bacterial communities from the University of Arizona exhibited higher proportions of
Alphaproteobacteria and
Gammaproteobacteria, but lower proportions of
Thermoleophilia and
Rubrobacteria (
Figure S1A). For fungi, soils from the University of Arizona had lower proportions of
Dothideomycetes,
Eurotiomycetes, and
Pezizomycetes, but a higher proportion of
Tremellomycetes (
Figure S1B).
Figure 3. Changes in microbial community composition across locations. (A,C) Nonmetric multidimensional scaling (NMDS) ordinations show that samples are well-clustered by location. Label numbers denote sampling days. Points are means of NMDS axes per day and error bars are standard deviations of the mean. (B,D) Relationship between community dissimilarity and temporal distance. Mantel test (Pearson method) statistics are shown. Location abbreviations are the same as those in Figure 1.
4. Proportional Changes in Microbial Functional Groups across Locations
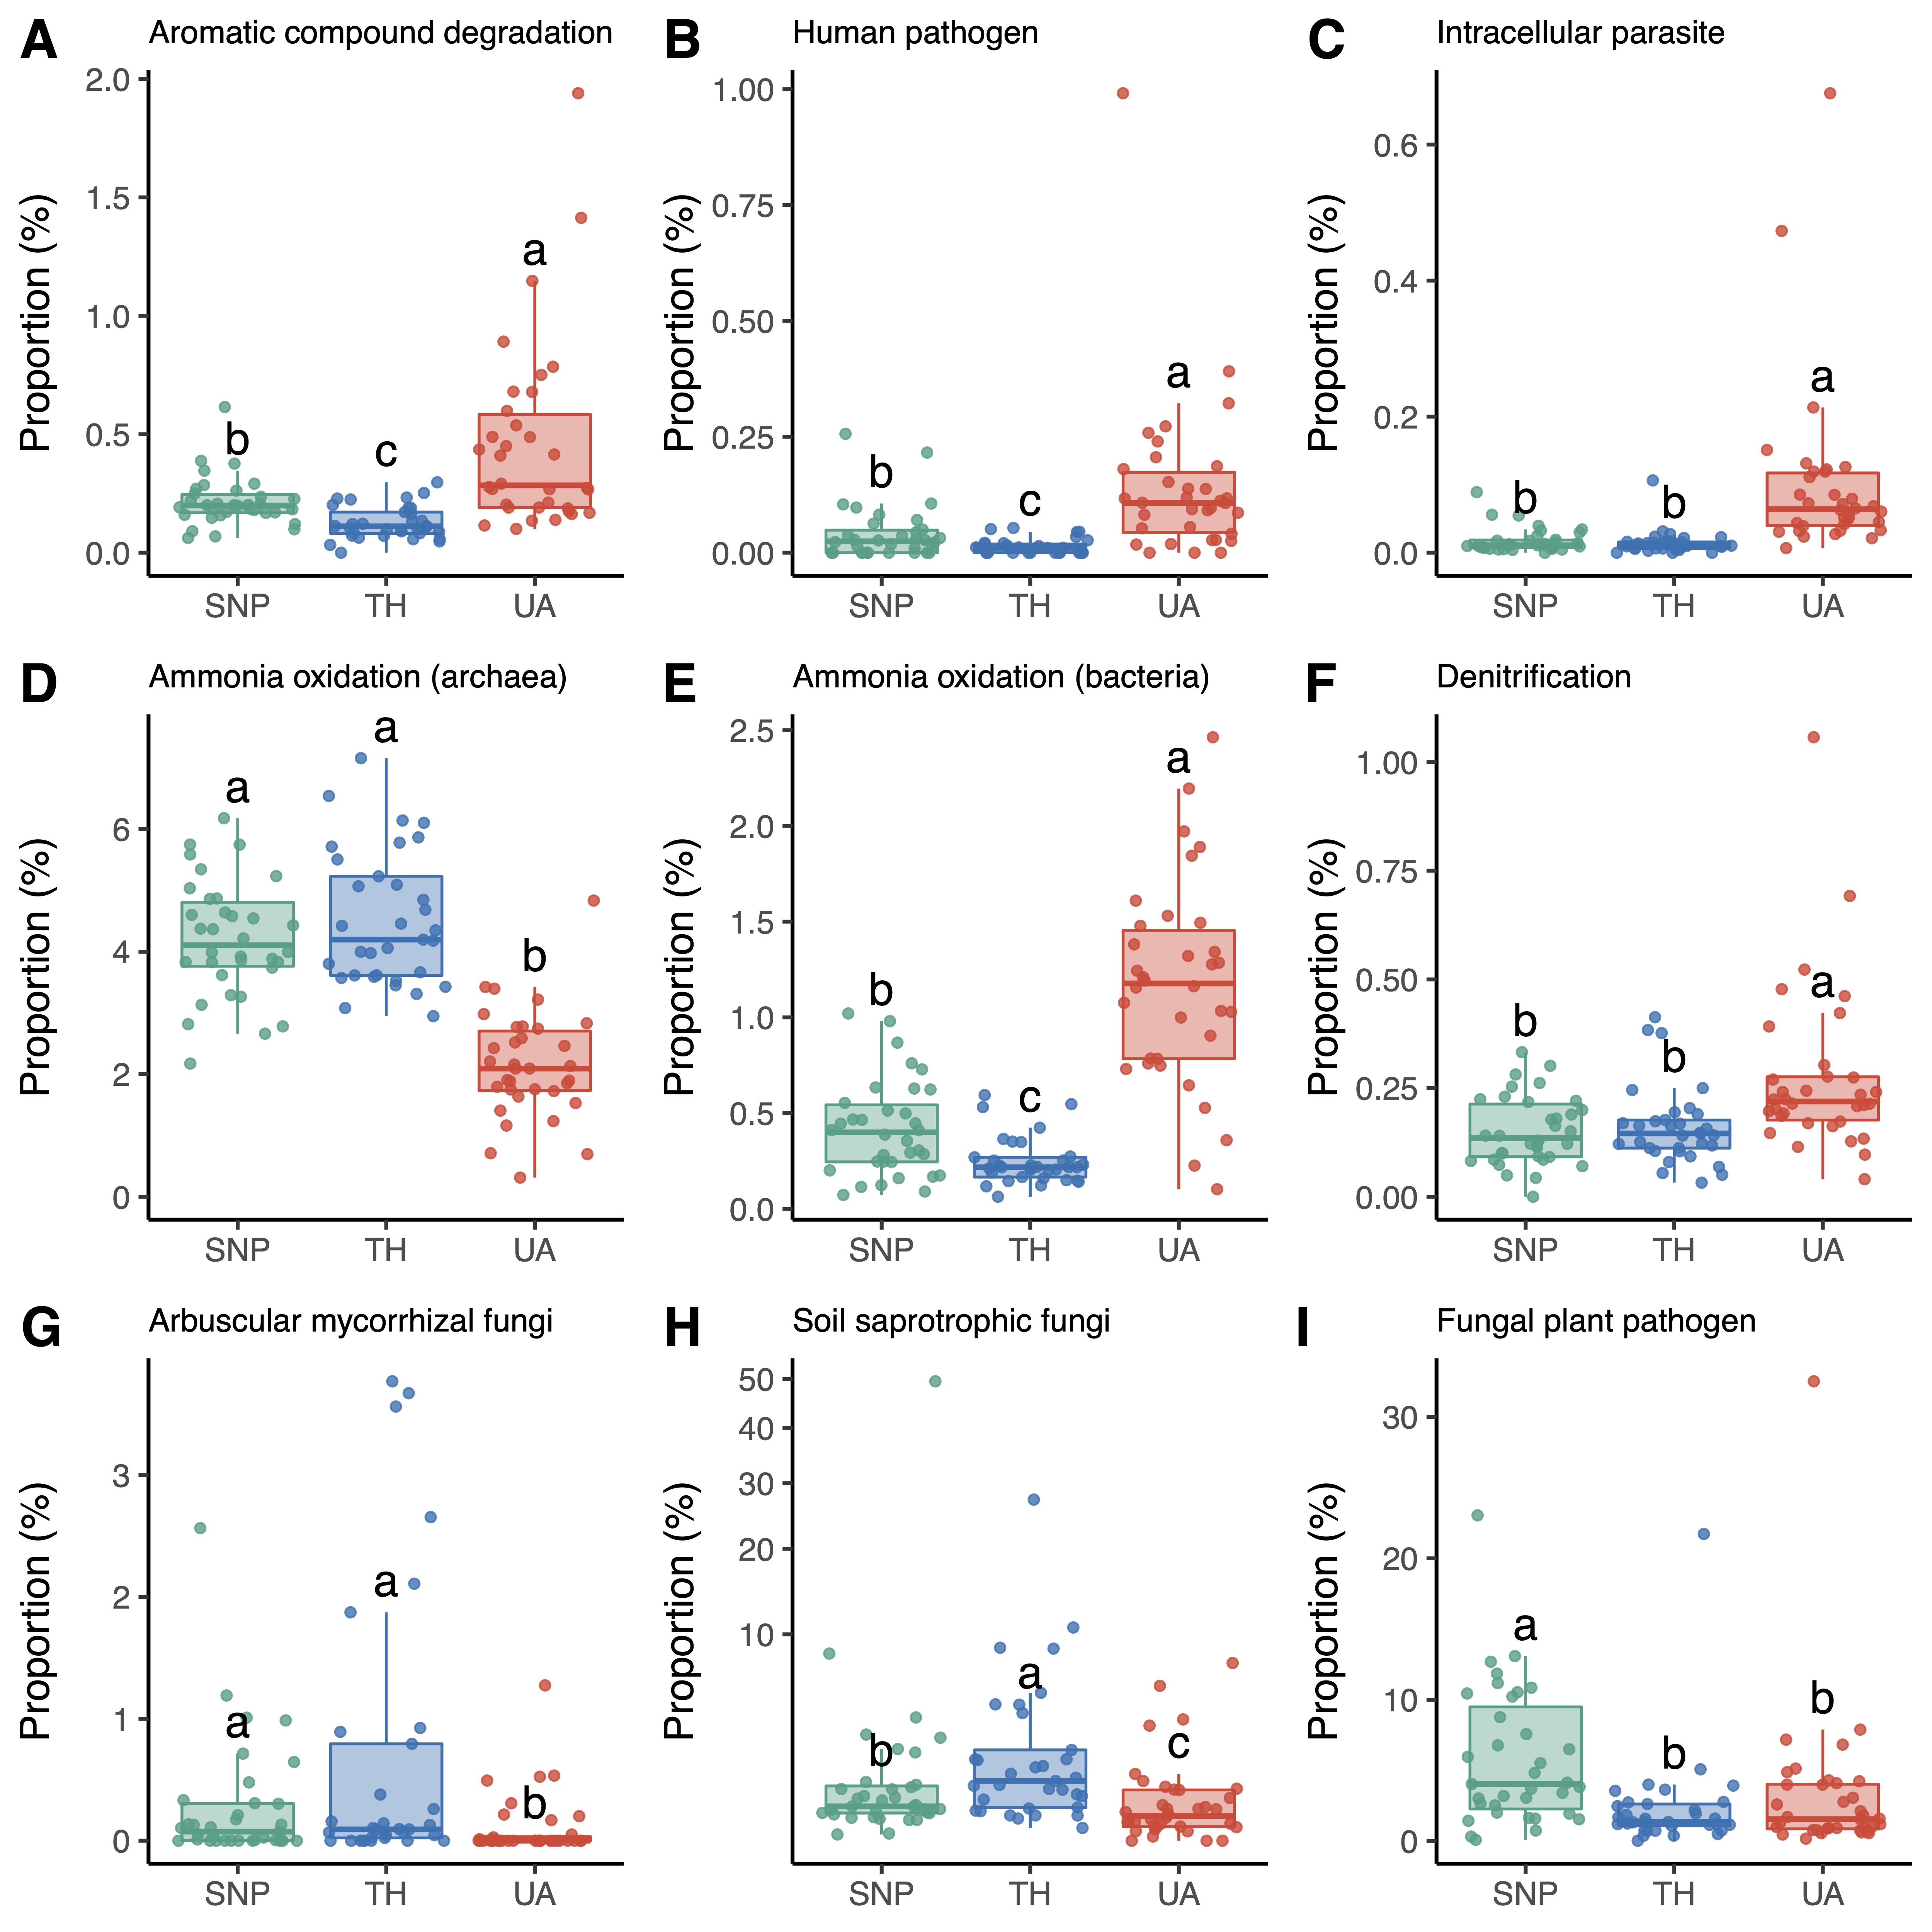
The proportions of soil microbial functional groups also exhibited significant differences across the three locations (
Figure 4,
Figures S2 and S3). For the inferred functional groups of bacteria/archaea, soils from the University of Arizona had a higher proportion of bacteria associated with aromatic compound degradation (mainly
Nocardioides sp.;
Figure 4A), human pathogens (mainly
Roseomonas sp. and
Coxiella sp.;
Figure 4B), and intracellular parasites (mainly
Rickettsiales sp. and
Legionella sp.;
Figure 4C). In addition, archaea associated with ammonia oxidation (mainly the family
Nitrososphaeraceae) were more abundant in Saguaro National Park and Tumamoc Hill (
Figure 4D), whereas bacteria associated with ammonia oxidation (mainly the family
Nitrosomonadaceae) were more abundant in the University of Arizona (
Figure 4E). Soils from the University of Arizona also had a higher proportion of bacteria associated with denitrification (mainly
Rhodoplanes sp.;
Figure 4F). For the inferred functional groups of fungi, soils from the University of Arizona had lower proportions of arbuscular mycorrhizal fungi (mainly
Rhizophagus sp. and
Funneliformis sp.) and soil saprotrophic fungi (mainly
Tulostoma sp.) than those from Tumamoc Hill and Saguaro National Park did (
Figure 4G,H). In addition, the proportion of fungal plant pathogens (mainly
Thanatephorus sp.,
Monosporascus sp., and
Curvula sp.) was significantly lower in soils from the University of Arizona than in those from Saguaro National Park (
Figure 4I).
Figure 4. Changes in the proportions of microbial functional groups across locations. Different letters indicate significant differences (
p < 0.05) based on Dunn’s test. (
A–
F) Dominant bacterial/archaeal functional groups. (
G–
I) Dominant fungal functional groups. Results of other functional groups are provided in
Supporting information (Figures S2 and S3). Location abbreviations are the same as those in
Figure 1.
6. Conclusions
By characterizing the temporal dynamics of belowground microbial communities in three locations representing an urbanization gradient, we found that microbial communities did not exhibit significant changes over time but changed significantly across locations. These changes in belowground microbial communities might have important implications for critical ecosystem functions and services. Our study was conducted at a local scale in the arid Southwestern USA, and thus, the generalizability of our results needs to be further examined using data collected at larger scales and in other habitats. Urbanization necessitates the development of a research agenda on soil microbiomes to inform policy and management.