Vitamin C is an essential nutrient that must be obtained through the diet in adequate
amounts to prevent hypovitaminosis C, deficiency and its consequences—including the potentially
fatal deficiency disease scurvy. Global vitamin C status and prevalence of deficiency has not previously
been reported, despite vitamin C’s pleiotropic roles in both non-communicable and communicable
disease. This entry highlights the global literature on vitamin C status and the prevalence of
hypovitaminosis C and deficiency. Related dietary intake is reported if assessed in the studies.
Overall, the entry illustrates the shortage of high quality epidemiological studies of vitamin C status
in many countries, particularly low- and middle-income countries. The available evidence indicates
that vitamin C hypovitaminosis and deficiency is common in low- and middle-income countries and
not uncommon in high income settings.
- vitamin C status
- hypovitaminosis C
- vitamin C deficiency
- low and middle income
- LMIC
- vitamin C intake
1. Definition
Currently, there are no internationally accepted cut off values to define hypovitaminosis C and vitamin C deficiency. Therefore, the most commonly used values have been used, e.g., ≤23–28 µmol/L for hypovitaminosis C and ≤11 µmol/L for deficiency.
2. Introduction2. Introduction
Vitamin C intakes of 100–200 mg/day will maintain blood concentrations at adequate to saturating status i.e., 50–75 µmol/L[1] [11]. When blood concentrations fall to the hypovitaminosis C range (i.e., <23 µmol/L), symptoms of vitamin C insufficiency may become apparent, such as fatigue, lethargy and mood changes, e.g., irritability and depression[1] [11]. People with hypovitaminosis C are at high risk of developing vitamin C deficiency (defined as <11 µmol/L), putting them at risk of developing clinical scurvy, which is fatal if left untreated[2] [12].
3. Global Vitamin C Status and Prevalence of Insufficiency
3.1. High Income Countries
Several large epidemiological studies assessing vitamin C status and/or prevalence of deficiency in adults have been carried out in Europe and North America (Table 1). The largest study to have measured vitamin C status globally is the European EPIC-Norfolk study carried out in England (1993–1997)[3][4] [16,17]. This study assessed >22,400 participants (aged 40–79 years), revealing a weighted mean of 54 µmol/L vitamin C (48 and 59 µmol/L for men and women, respectively), and a prevalence of deficiency of 1.4% (2.2% for men and 0.8% for women). Dietary intakes of vitamin C, determined using 7-day food diaries, were 85 mg/day for the cohort (83 and 87 mg/day for men and women, respectively). The smaller National Diet and Nutrition Survey carried out in 1994/1995 in the UK (England and Scotland) in >1300 elderly participants (aged ≥65 years) showed a lower vitamin C status (44 ± 25 µmol/L), and a higher prevalence of deficiency (14%)[5] [18], more comparable to the French POLA study of the same age group (see below). The third MONICA study, carried out in Glasgow, Scotland in 1992 in >1200 adults, indicated an even higher prevalence of deficiency of 20% for the cohort (26% for men and 14% for women)[6] [19].
Table 1.
Vitamin C status and prevalence of deficiency and hypovitaminosis C in adults from high-income countries.
Country (Region) Sampling Dates | |||||
Population (Age Range) | |||||
Vitamin C Status ( | µ | mol/L) a | |||
Deficiency (% <11 | µ | mol/L) | |||
Hypovitaminosis C (% <23 or 28 µmol/L) | |||||
Dietary Intake (mg/day) | a | ||||
References | |||||
Europe | |||||
| |||||
| |||||
| |||||
| |||||
| |||||
| |||||
England (Norfolk) 1993–1997 | |||||
22,474 total (40–79 years) | |||||
10,267 males | |||||
12,207 females | |||||
54 | b | ||||
48 | b | ||||
59 | b | ||||
1.4 | |||||
2.2 | |||||
0.8 | |||||
12 | |||||
17 | |||||
8 | |||||
85 | b | ||||
83 | b | ||||
87 | b | [ | |||
[16,17] | |||||
UK (England and Scotland) 1994–1995 | |||||
1310 elderly (≥65 years) | |||||
44 (25) | |||||
14 | |||||
– | |||||
– | [ | ] |
|||
[18] | |||||
Scotland (Glasgow) 1992 | |||||
1267 total (25–74 years) | |||||
632 males | |||||
635 females | |||||
– | |||||
– | |||||
– | |||||
20 | |||||
26 | |||||
14 | |||||
44 | |||||
52 | |||||
36 | |||||
– | |||||
– | |||||
– | [ | ] |
|||
[19] | |||||
France (all regions) 1994–1995 | |||||
12,741 total (35–60 years) | |||||
5028 males | |||||
7713 females | |||||
56 | b | ||||
50 (23) | |||||
60 (31) | |||||
1.0 | |||||
1.8 | |||||
0.4 | |||||
– | |||||
– | |||||
– | |||||
100 | b | ||||
103 (48) | |||||
98 (44) | [ | ][8] |
|||
[20,21] | |||||
France (South; Sète) 1995–1997 | |||||
1987 total (>60 years) | |||||
874 elderly males | |||||
1113 elderly females | |||||
36 | b | ||||
32 | |||||
40 | |||||
9 | b | ||||
13 | b | ||||
6 | b | ||||
– | |||||
– | |||||
– | |||||
– | |||||
– | |||||
– | [ |
||||
] | |||||
[22] | |||||
France (Paris) <1991 | |||||
837 total (≥18 years) | |||||
361 males | |||||
476 females | |||||
48 | b | ||||
41 | |||||
53 | |||||
– | |||||
– | |||||
– | |||||
– | |||||
– | |||||
– | |||||
– | |||||
– | |||||
– | [ | ] |
|||
[23] | |||||
France (Nancy) | |||||
459 males (20–60 years) | |||||
39 | b | ||||
– | |||||
– | |||||
80 | b | [ | 11] |
||
[24] | |||||
Finland (North Karelia) 1992–2002 | |||||
1616 total (25–64 years) | |||||
974 males | |||||
642 females | |||||
40 | b | ||||
37 | |||||
44 | |||||
– | |||||
2.2 | |||||
– | |||||
– | |||||
4.4 | |||||
– | |||||
– | |||||
– | |||||
– | [ | ][13] |
|||
[25,26] | |||||
Finland (Eastern) 1984–1989 | |||||
1605 males (42–60 years) | |||||
48 (23) | |||||
5.7 | |||||
– | |||||
– | [ | ] |
|||
[27] | |||||
Austria (Graz) 1991–1994 | |||||
786 total (45–86 years) | |||||
330 males | |||||
456 females | |||||
58 (21) | |||||
50 (20) | |||||
64 (19) | |||||
– | |||||
– | |||||
– | |||||
– | |||||
– | |||||
– | |||||
– | |||||
– | |||||
– | [ | ] |
|||
[28] | |||||
Spain (Alicante province) 2000–2001 | |||||
545 total (>65 years) | |||||
252 elderly males | |||||
293 elderly females | |||||
45 | b | ||||
38 (20) | |||||
51 (18) | |||||
– | |||||
– | |||||
– | |||||
– | |||||
– | |||||
– | |||||
131 | b | ||||
125 (64) | |||||
136 (70) | [ | ] |
|||
[29] | |||||
Europe (France, Ireland, Spain Netherlands) | |||||
349 total (25–45 years) | |||||
175 males | |||||
174 females | |||||
59 | b | ||||
54 (13–103) | d | ||||
64 (6–117) | d | ||||
– | |||||
– | |||||
– | |||||
– | |||||
– | |||||
– | |||||
– | |||||
– | |||||
– | [ | ] |
|||
[30] | |||||
Germany (Giessen) 1994–2004 | |||||
279 total (62–92 years) | |||||
98 elderly males | |||||
181 elderly females | |||||
71 | b | ||||
62 (55–74) | c | ||||
76 (62–89) | c | ||||
– | |||||
– | |||||
– | |||||
– | |||||
– | |||||
– | |||||
90 | b | ||||
84 (61–116) | c | ||||
93 (70–132) | c | [ | 18] |
||
[31] | |||||
North America | |||||
| |||||
| |||||
| |||||
| |||||
| |||||
| |||||
United States 2003–2004 | |||||
4438 total (≥20 years) | |||||
2153 males | |||||
2285 females | |||||
49 (32–71) | c | ||||
45 (27–66) | c | ||||
53 (38–76) | c | ||||
8.4 | |||||
10.0 | |||||
6.9 | |||||
– | |||||
– | |||||
– | |||||
– | |||||
– | |||||
– | [ | ] |
|||
[32] | |||||
Canada (16 sites countrywide) 2012–2013 | |||||
1615 total (20–79 years) | |||||
804 males | |||||
811 females | |||||
53 | |||||
47 | |||||
59 | |||||
<3 | |||||
– | |||||
– | |||||
– | |||||
– | |||||
– | |||||
– | |||||
– | |||||
– | [ | ] |
|||
[33] | |||||
Canada (Toronto) 2004–2008 | |||||
979 total (20–29 years) | |||||
287 males | |||||
692 females | |||||
31 | |||||
29 | |||||
33 | |||||
14 | |||||
16 | |||||
13 | |||||
47 | |||||
37 | |||||
45 | |||||
140/242 | b,e | ||||
228 | |||||
248 | [ | ] |
|||
[34] | |||||
Asia-Pacific | |||||
| |||||
| |||||
| |||||
| |||||
| |||||
| |||||
Japan (Shibata, Niigata Prefecture) 1977 | |||||
2185 total (40–89 years) | |||||
919 males | |||||
1266 females | |||||
51 | b | ||||
43 (19) | |||||
57 (17) | |||||
– | |||||
– | |||||
– | |||||
– | |||||
– | |||||
– | |||||
– | |||||
– | |||||
– | [ | ] |
|||
[35] | |||||
Japan (Itabashi, Tokyo) 2006 | |||||
655 elderly females | |||||
(70–84 years) | |||||
51 (9) | |||||
– | |||||
– | |||||
| |||||
– | [ | ] |
|||
[36] | |||||
Singapore 1993–1995 | |||||
941 total (30–69 years) | |||||
468 males | |||||
473 females | |||||
37 | b | ||||
32 | b | ||||
41 | b | ||||
12 | b | ||||
17 | b | ||||
6.0 | b | ||||
– | |||||
– | |||||
– | |||||
– | |||||
– | |||||
– | [ | ][25] |
|||
[37,38] | |||||
New Zealand (Canterbury region) 2010–2013 | |||||
369 total (50 years) | |||||
174 males | |||||
195 females | |||||
44 | |||||
41 | |||||
47 | |||||
2.4 | |||||
4.0 | |||||
1.0 | |||||
13 | |||||
15 | |||||
11 | |||||
110 | |||||
113 | |||||
107 | [ | ] |
|||
[39] |
a Data represent mean (SD), if provided; b For missing data, weighted means were calculated; c Mean or median and interquartile range; d Mean and range; e Intake without/with supplement use.
The SU.VI.MAX study carried out in France (1994/1995) assessed factors influencing blood concentrations of antioxidant vitamins in >12,700 French participants aged 35–60 years[7][8] [20,21]. This study showed comparable results to EPIC-Norfolk, with the vitamin C status of men and women being 50 ± 23 and 60 ± 31 µmol/L, respectively, giving a weighted mean of 56 µmol/L for the total cohort. Of these, only 1% exhibited vitamin C deficiency, higher for men (1.8%) than women (0.4%). Dietary intakes of vitamin C were assessed from six 24-h dietary records during the first 18 months of the study, giving a weighted mean of 100 mg/day for the cohort (103 and 98 mg/day for men and women, respectively). Another smaller study was carried out at a similar time (1995–1997) in Sète in the South of France in >1900 elderly participants aged >60 years (the POLA study)[9] [22]. This study indicated a lower mean vitamin C concentration of 36 µmol/L (32 and 40 µmol/L for men and women, respectively) and a higher prevalence of deficiency (9%; 13% for men and 6% for women). Other smaller studies carried out in France (Paris and Nancy) have shown intermediate vitamin C status between these two studies, i.e., 39–41 µmol/L for men and 53 µmol/L for women[10][11] [23,24]. The men in Nancy had a correspondingly lower dietary intake of 80 mg/day, determined using a dietary questionnaire that collected data on the participant’s diet history during the previous year[11] [24].
Two studies have been carried out in Finland: one in North Karelia (1992–2002) in >1600 adults aged 25–64 years[12][13] [25,26] and one in Eastern Finland (1984–1989) in >1600 men aged 42–65 years [27]. The mean vitamin C status for men ranged from 37 to 48 ± 23 µmol/L, with a prevalence of deficiency of 2.2% to 5.7%[12][13][14] [25–27]. A small study of apparently healthy elderly participants in the Alicante province of Spain in 2000/2001 indicated comparable vitamin C status, with 38 ± 20 µmol/L in men and 51 ± 18 µmol/L in women, giving a weighted mean of 45 µmol/L[16] [29]. The participants had relatively high intakes of vitamin C, assessed using a semiquantitative food frequency questionnaire; 125 ± 64 mg/day for men and 136 ± 70 mg/day for women. Another small study of five countries across Europe (including Spain, France, Netherlands, Northern Ireland and Republic of Ireland) indicated a weighted mean in healthy non-smoking adults (aged 25–45 years) of 59 µmol/L vitamin C (54 and 64 µmol/L for men and women, respectively)[17] [30]. Similar values were recorded in Graz, Austria (1991–1994); 58 ± 21 µmol/L for a cohort of 786 adult men and women (50 ± 20 µmol/L for men and 64 ± 19 µmol/L for women)[15] [28]. In Europe, the highest vitamin C values reported to date have come from the GISELA study in Giessen Germany (1994–2004), in which independently living senior citizens had a weighted mean of 71 µmol/L vitamin C (62 and 76 µmol/L for men and women, respectively)[18] [31]. Dietary intakes, assessed using a 3-day estimated dietary record, revealed a mean intake of 90 mg/day for the cohort (84 and 93 mg/day for men and women, respectively). The researchers attributed the lower vitamin C plasma concentrations in men compared with women partly to a volumetric dilution effect due to differences in fat-free mass.
In the United States, the National Health and Nutrition Examination Surveys (NHANES) have been reporting nationally representative vitamin C status data over nearly four decades[19][27][28] [32,40,41]. The most recent survey (2003/2004) included >4400 adults (aged ≥20 years) and indicated a mean status of 49 µmol/L vitamin C for the cohort (45 and 53-µmol/L for men and women, respectively)[19] [32]. The prevalence of deficiency was 8.4% (10% for men and 6.9% for women), significantly higher than that observed in the larger European SU.VI.MAX and EPIC-Norfolk studies. Dietary intakes were not reported in this study, however, the earlier NHANES III (1988–1994) report indicated a mean dietary intake of ~106 mg/day (determined using 24-h dietary recalls) for a similarly aged cohort (≥18 years)[28] [41]. The recent Canadian Health Measures Survey (2012/2013) assessed the vitamin C status of >1600 adults (aged 20–79 years) and reported a mean vitamin C status of 53 µmol/L (47 and 59 µmol/L for men and women, respectively). The prevalence of deficiency was <3%, in line with the large European studies (SU.VI.MAX and EPIC-Norfolk). Another smaller study was carried out in >900 young non-smoking Canadians (aged 20–29 years), however, the vitamin C concentrations were unusually low (31 µmol/L, with 14% deficiency), despite relatively high dietary intakes of 242 mg/day for the total cohort (140 mg/day for non-supplement users), assessed using food frequency questionnaires for dietary intake over the previous month[21] [34]. The low vitamin C status in this study has been attributed to the blood samples not being processed or stored appropriately for accurate vitamin C analysis[29][30] [42,43].
Several studies have been carried out in high-income countries in Asia and the Pacific (Table 1). In Japan, the largest study was undertaken in 1977 (in Shibata, Niigata Prefecture)[22] [35]. This study comprised >2100 adults aged 40–89 years and indicated a mean vitamin C status of 51 µmol/L (43 ± 19 µmol/L for men and 57 ± 17 µmol/L for women). A more recent study carried out in Tokyo (2006) in >600 elderly women (aged 70–84 years) indicated a comparable plasma vitamin C status of 51 ± 9 µmol/L. Middle-aged participants in the South Island of New Zealand had a mean vitamin C status of 44 µmol/L (41 and 47 µmol/L for men and women, respectively) and a relatively low prevalence of deficiency of 2.4% (4.0% for men and 1.0% for women). The average dietary intake of these participants was 110 mg/day (113 and 107 mg/day for men and women, respectively), determined using four day estimated food diaries[26] [39]. In contrast, the vitamin C status of adults (aged 30–69) in Singapore was lower at a mean of 37 µmol/L (32 and 41 µmol/L for men and women, respectively), with 12% deficiency (17% for men and 6% for women)[24][25] [37,38]. Lower vitamin C concentrations were reported in Indians and Malays than Chinese in this study. The authors suggested this may have been due to low intakes of fresh fruit and different traditional cooking practices and cuisines.
3.2. Low and Middle Income Countries
There have been few vitamin C status studies carried out in Central and South America (Table 2). Two studies in Mexican women have indicated low vitamin C status (19 and 30 ± 13 µmol/L) and high rates of hypovitaminosis C and deficiency (up to 32% and 39%)[31][32] [44,45], despite reported mean dietary intakes of 72 mg/day, based on three 24-h recalls[31] [44]. Hypovitaminosis C was associated with obesity in one of the studies[31] [44]. Regional variations were seen with lower deficiency rates in Mexico City than North and South Mexico[32] [45]. A study of 369 elderly people of low socioeconomic status in Quinto, Ecuador indicated a very low mean vitamin C status of 15 µmol/L (11 ± 9 µmol/L for men and 17 ± 10 µmol/L for women) and a high prevalence of deficiency (43%), with men exhibiting more deficiency than women (60% vs. 33%, respectively)[33] [46]. Another small study of 117 pregnant females admitted to hospital in Sao Paulo, Brazil, showed a mean vitamin C status of 33 µmol/L and 31% to have hypovitaminosis C[34] [47].
A limited number of studies have been performed assessing vitamin C status across Africa (Table 2), none of which are large scale epidemiological studies of the general population, having primarily investigated specific groups. In South Africa a small study assessed vitamin C concentrations in 285 elderly participants[35] [48]. A low mean vitamin C status of 25 µmol/L was observed in these participants (23 and 25 µmol/L for men and women, respectively), and was reflected by low vitamin C intakes (mean 39 mg/day; 27 and 42 mg/day for men and women, respectively). A high prevalence of hypovitaminosis C (defined as <34 µmol/L in this study) was observed (mean 66%; 84% for men and 62% for women). A number of small studies have been carried out in Nigerian women. One study of 400 antenatal clinic patients showed low vitamin C status (20 ± 29 µmol/L) with 80% of the women exhibiting hypovitaminosis C[36] [49]. The authors attributed this to high parity, inadequate nutrition and nutritional taboos among Northern Nigerian females. Of note, a smaller study of female hospital and university staff in South Nigeria during the rainy season reported very high mean vitamin C intakes (>680 mg/day, determined by 24-h diet history), saturating vitamin C status (74 µmol/L), and no cases of hypovitaminosis and deficiency were seen[37] [50]. In Uganda, research into pre-eclampsia in Kampala (Malago Hospital), 400 well pregnant women were studied and showed very low vitamin C status (only 11 ± 4 µmol/L) and high rates of vitamin C deficiency (70%)[38] [51]. Additionally, a control group of 200 well women from clinics also showed low vitamin C status (15 ± 6 µmol/L) and 28% hypovitaminosis C. The differences between these studies may be a reflection of seasonal variation and disparities in intake across socioeconomic and regions of the continent, or limitations of the assay methodologies used. Of note, clinical outbreaks of scurvy still occur in Africa such as a recent outbreak in tribesmen in Kenya[39] [52].
Table 2.
Vitamin C status and prevalence of deficiency and hypovitaminosis C of adults in low- and middle-income countries.
Country (Region) | Sampling Dates | Population (Age Range) | Vitamin C Status (µmol/L) a | Deficiency (% <11 µmol/L) | Hypovitaminosis C (% <23 or 28 µmol/L) | Dietary Intake (mg/day) a | References | ||||||||||||||||||||||||||||||||||||||||||||||||||||||||||||||||||||||||
Upper-middle |
|
|
|
|
|
| |||||||||||||||||||||||||||||||||||||||||||||||||||||||||||||||||||||||||
Russia (Pitkäranta District, Republic of Karelia) 1992–2002 | 1191 total (25–64 years) | 579 males | 612 females | 9.0 b | 5.0 | 13 | – | 79 | – | – | 90 | – | – | – | – |
[25,26] |
|||||||||||||||||||||||||||||||||||||||||||||||||||||||||||||||
China (Shanghai) 1995–2001 | 2031 females (30–64 years) | 45 (48) | – | – | – |
[40] |
[53] |
||||||||||||||||||||||||||||||||||||||||||||||||||||||||||||||||||||||||
China (Linxian) 1999–2000 | 948 total (~50–79 years) | 473 males | 475 females | 33 (14–55) c | 27 (11–50) c | 37 (16–57) c | – | – | – | – | – | – | – | – | – |
[41] |
[54] |
| |||||||||||||||||||||||||||||||||||||||||||||||||||||||||||||
China (Gansu, Guangxi, Shandong, Fujian) 1999–2001 | 734 pregnant females (20–35 years) | 19 b | – | 66 | – |
[42] |
[55] |
||||||||||||||||||||||||||||||||||||||||||||||||||||||||||||||||||||||||
Thailand (Bangkok) 2003 | 209 total (23–68 years) | 90 males | 119 females | 36 (0–102) d | 37 (0–77) d | – | – | – | 31 b | 33 | 30 | – | – | – |
[43] |
[56] |
|||||||||||||||||||||||||||||||||||||||||||||||||||||||||||||||
Mexico (multiple states) | 855 non-pregnant females (12–49 years) | 19 | 39 | – | – |
[32] |
[45] |
||||||||||||||||||||||||||||||||||||||||||||||||||||||||||||||||||||||||
Mexico (Central-Queretaro state) 2012 | 580 females (37 years) e | 30 (13) | 5 | 32 | 72 b |
[31] |
[44] |
||||||||||||||||||||||||||||||||||||||||||||||||||||||||||||||||||||||||
Ecuador (Quito) 2003–2004 | 369 total (>65 years) | 125 elderly males | 224 elderly females | 15 b | 11 (9) | 17 (10) | 43 b | 60 | 33 | – | – | – | – | – | – |
[33] |
[46] |
||||||||||||||||||||||||||||||||||||||||||||||||||||||||||||||
Brazil (Sao Paulo) 2008 | 117 pregnant females (≥15 years) | 33 (2) | 6 | 31 | – |
[34] |
[47] |
||||||||||||||||||||||||||||||||||||||||||||||||||||||||||||||||||||||||
South Africa (Cape Town) 2015 | 285 total (≥60 years) | 53 elderly males | 232 elderly females | 25 b | 23 | 25 | – | – | – | 66 bf | 84 f | 62 f | 39 b | 27 | 42 |
[35] |
[48] |
||||||||||||||||||||||||||||||||||||||||||||||||||||||||||||||
Lower-middle |
|
|
|
|
|
| |||||||||||||||||||||||||||||||||||||||||||||||||||||||||||||||||||||||||
India (North-Haryana state; South-Tamil Nadu) 2004–2006 | 5638 total (≥60 years) | 2668 North total | 1283 elderly males | 1385 elderly females | 2970 South total | 1407 elderly males | 1563 elderly females | – | – | – | – | – | – | – | 59 b | 74 | 78 | 71 | 46 | 51 | 40 | 81 b | 89 | – | – | 74 | – | – | 29 b | 23 b | – | – | 34 b | – | – |
[44] |
[57] |
||||||||||||||||||||||||||||||||||||||||||
India (North-Balba-garh, Faridabad district) 2002–2003 | 1112 total (≥50 years) | ~48% males | ~52% females | ~15 b | 13 | 17 | – | – | – | – | – | – | – | – | – |
[45] |
[58] |
||||||||||||||||||||||||||||||||||||||||||||||||||||||||||||||
India (West-Maharashtra state) 1998–2000 | 322 total (20–45 years) | 214 males | 108 females | 18 b | 17 (7) | 20 (7) | 18 b | 20 | 13 | 71 b | 75 | 63 | 34 b | 40 b | 29 b |
[46] |
[59] |
||||||||||||||||||||||||||||||||||||||||||||||||||||||||||||||
Indonesia (West Java) 2011 | 98 total (39–50 years) | 45 males; 53 females | 29 (19) | 11 | 45 | – |
[47] |
[60] |
|||||||||||||||||||||||||||||||||||||||||||||||||||||||||||||||||||||||
Nigeria (Northwest-Kano state) 2009–2011 | 400 pregnant females (<20–39 years) | 20 (29) | – | 80 | – |
[36] |
[49] |
||||||||||||||||||||||||||||||||||||||||||||||||||||||||||||||||||||||||
Nigeria (South-east-Enugu) 2009 | 200 non-pregnant females (29 years) b,e | 74 b | 0 | 0 | 683 b,g |
[37] |
[50] |
||||||||||||||||||||||||||||||||||||||||||||||||||||||||||||||||||||||||
Low income |
|
|
|
|
|
| |||||||||||||||||||||||||||||||||||||||||||||||||||||||||||||||||||||||||
Uganda (Kampala) 2008–2009 | 600 females (15–49 years) | 400 pregnant | 200 non-pregnant |
| 11 (4) | 15 (6) |
| 70 | 28 |
| – | – |
| – | – |
[38] |
[51] |
a Data represent mean (SD), if provided, b For missing data, weighted means were calculated, c Mean or median and interquartile range, d Median and range; e Mean age; f Cutoff of 34 µmol/L; g Converted from weighted mean of 3882 µmol using Mr of 176.
Vitamin C deficiency in India has been relatively well characterized with a large population-based study (Table 2). In this study, of >5600 adults aged over 60, frank deficiency was observed in 74% of adults in North India and 46% of adults in South India, with a higher prevalence of deficiency observed in men than women[44] [57]. This was reflected by low dietary intakes of vitamin C (determined by 24-h dietary recall) of 23 and 34 mg/day for North and South India, respectively. Very low mean vitamin C concentrations of 15 µmol/L (13 and 17 µmol/L for men and women, respectively) in villages in North India have been reported[45] [58]. A small study of healthy adults in Western India showed comparably low vitamin C status with a mean of 18 µmol/L (17 ± 7 µmol/L for men and 20 ± 7 µmol/L for women), along with high rates of deficiency and >70% hypovitaminosis C[46] [59]. Dietary intakes of vitamin C were low (mean 34 mg/day; 40 mg/day for men and 29 mg/day for women), as determined using a food frequency questionnaire of usual dietary intake over the previous year.
Mean vitamin C concentrations are available from several studies in China (Table 2). One in Linxian indicated relatively low mean concentrations of 33 µmol/L for people aged ≥50 years (27 and 37 µmol/L for men and women, respectively)[41] [54]. A higher mean status of 45 µmol/L was observed in >2000 women aged 30–64 years in Shanghai [53]. In contrast, women in the third trimester of pregnancy had a low mean vitamin C status of 19 µmol/L and a high prevalence of hypovitaminosis C (66%)[42] [55]. Research in Russia has shown extremely low mean vitamin C status (9 µmol/L), particularly in men, with high rates of deficiency (79%) and hypovitaminosis C (90%) in adult males[12][13] [25,26]. A small study in Bangkok, Thailand, indicated a low mean vitamin C status (36 µmol/L) and high prevalence of hypovitaminosis C (31%)[43] [56]. Similar values were reported in Java, Indonesia, with a mean status of 29 ± 19 µmol/L and 45% hypovitaminosis C[47] [60]. Elsewhere in Asia seasonal severe outbreaks of clinical scurvy have been noted in the winter months in Afghanistan occurring at a prevalence rate of 6.3% towards the end of the winter months[48] [61].
3.3. Children and Adolescents
Although vitamin C pharmacokinetics are relatively well understood in adult men and women[1][49] [11,62], relatively little is known about its pharmacokinetics in children and adolescents. However, based on its newly discovered epigenetic roles, vitamin C may be particularly important for the growth and development of infants and children[50] [63]. Global recommended intakes for children and adolescents are less than adults and are generally based on their lower body weight[51] [10]. In well-nourished populations, such as the USA, the vitamin C status of children is higher (mean 71 µmol/L) and the prevalence of deficiency lower (1.6%) than adults[19] [32]. However, this is not necessarily the case in LMIC, where low vitamin C status has been observed in children and adolescents (Table 3). Studies in Mexico have shown high rates of deficiency and hypovitaminosis C in children[32][52] [45,64]. Mean vitamin C concentrations in school aged children were low at 28 and 24 ± 9 µmol/L, with up to 38% hypovitaminosis C and 23% deficiency. A food frequency questionnaire indicated a mean intake of 44 mg/day vitamin C[52] [64]. Of note, rates of overweight and obese children in the more recent Mexico study were high at 44%, and vitamin C concentrations were inversely associated with body fat and abdominal fat[52] [64].
Table 3. Vitamin C status and prevalence of deficiency and hypovitaminosis C of children and adolescents globally.
Country (Region) Sampling Dates | Population (Age Range) | Vitamin C Status (µmol/L) a | Deficiency (% <11 µmol/L) | Hypovitaminosis C (% <23 or 28 µmol/L) | Dietary Intake (mg/day) a | References | ||||||||||||||||||||||||||||||||||
High income |
|
|
|
|
|
| ||||||||||||||||||||||||||||||||||
United States 2003–2004 | 823 children (6–11 years) | 400 boys | 423 girls | 71 b | 74 (60–88) c | 69 (56–87) c | 1.6 b | 1.3 | 1.8 | – | – | – | – | – | – |
[19] |
[32] |
|||||||||||||||||||||||
| 2016 adolescents (12–19 years) | 1037 boys | 979 girls |
| 51 (37–68) c | 55 (38–76) c |
| 2.7 | 3.9 |
| – | – |
| – | – |
| ||||||||||||||||||||||||
Upper-middle |
|
|
|
|
|
| ||||||||||||||||||||||||||||||||||
Mexico (multiple states) 1999 | 1815 children (0–11 years) |
| 28 | 23 | – | – |
[32] |
[45] |
||||||||||||||||||||||||||||||||
Mexico (Queretaro state) 2012 | 197 children (6–11 years) | 24 (9) | 8 | 38 | 44 |
[52] |
[64] |
|||||||||||||||||||||||||||||||||
Lower-middle |
|
|
|
|
|
| ||||||||||||||||||||||||||||||||||
India (Jaipur city) | 5000 well-nourished preschool children | 1000 malnourished preschool children | – |
| – | 0 |
| 1.1 | – |
| – |
| – |
| – |
[53] |
[65] |
|||||||||||||||||||||||
India (Hyderabad) | 869 children (6–16 years) | – | – | 60 d | – |
[54] |
[66] |
|||||||||||||||||||||||||||||||||
India (Delhi slum) 2012–2013 | 775 adolescent females (11–18 years) | 43 (26) | 6.3 | 34 | 48 (26) |
[55] |
[67] |
|||||||||||||||||||||||||||||||||
Bangladesh (Dhaka district) 2003 | 307 adolescent females (14–18 years) | 46 (20) | 2.0 | 11 | – |
[56] |
[68] |
|||||||||||||||||||||||||||||||||
Nigeria (Enugu state) | 90 adolescents (13–20 years) | Males | Females | – | 35–43 | 47–51 | – | – | – | 47 e | 60 e | 40 e | – | 24–27 | 15–20 |
[57] |
[69] |
a Data represent mean (SD), if provided; b For missing data, weighted means were calculated; c Mean or median and interquartile range; d Cutoff <30 µmol/L; e Cutoff <40 µmol/L.
Several studies have been carried out in children of different ages in India. Malnourished preschool children in Jaipur city were shown to have a higher prevalence of deficiency than well-nourished children[53] [65]. The low prevalence of deficiency of this cohort (1.1%) is possibly due to the young age and consequently lower body weight of these children. In contrast, a high prevalence of 60% hypovitaminosis C (defined as <30 µmol/L) has been observed in older children in Hyderabad[54] [66]. Poor vitamin status (43 ± 26 µmol/L) and a high prevalence of hypovitaminosis C (34%) has been observed among adolescent girls in the slums of Delhi[55] [67]. They reported a mean dietary intake of 48 ± 26 mg/day, as determined by 24-h dietary recall. A study from Bangladesh demonstrated a comparable mean vitamin C status of 46 ± 20 µmol/L in rural adolescent females (with mild to moderate anemia), however, only 11% had hypovitaminosis C[56] [68]. This is likely due to the study being carried out during the rainy season during which time green leafy vegetables were likely to have been widely available. In a small study in Nigeria, male and female adolescents were found to have very low dietary intakes, determined by a 3-day weighed food intake in the boarding students, and correspondingly low vitamin C status[57] [69]. Nearly 50% of the adolescents had vitamin C levels <40 µmol/L (60% in boys and 40% in girls).
Overall, there are clear disparities in vitamin C status and prevalence of deficiency between high-income countries and LMICs. This is illustrated in Figure 1. There are numerous factors that likely contribute to the observed disparities between the various populations, with differences in dietary intakes between high-income countries and LMIC likely playing a major role (Figure 2). Dietary intakes can be influenced by geographic, economic, social and cultural factors[58] [70]. Many staple foods, particularly those that are grain-based, contain negligible vitamin C. Furthermore, various processing during food preparation and traditional cooking practices employing longer cooking times, can deplete the vitamin C content of food[59] [71], and these are not typically accounted for in assessments of vitamin C intake.
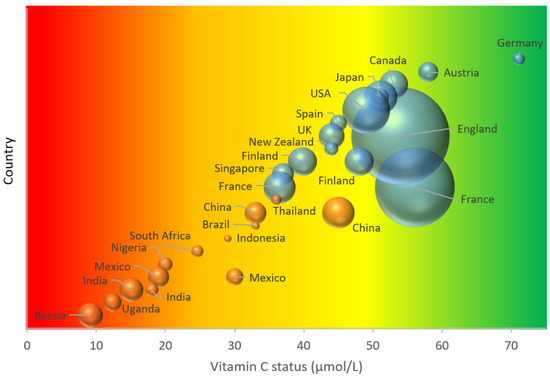
Figure 1. Global adult vitamin C status. The area of the bubble represents the size of the study. Blue bubbles represent high-income countries; orange bubbles represent low- and middle-income countries. Vitamin C status cutoffs: red—deficient (<11 µmol/L); orange—hypovitaminosis C (<23 µmol/L); yellow-inadequate (<50 µmol/L); green—adequate (>50 µmol/L).
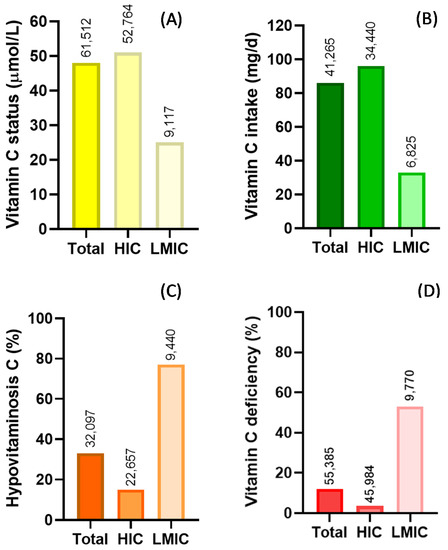
Figure 2. Summary of global vitamin C status (A) and intake (B) and prevalence of hypovitaminosis C (C) and vitamin C deficiency (D). Key: HIC—high-income countries; LMIC—low- and middle-income countries. Hypovitaminosis C, <23 µmol/L; vitamin C deficiency, <11 µmol/L. Numbers above bars indicate total number of individuals assessed.
For list of references, see: https://www.mdpi.com/2072-6643/12/7/2008/htm.