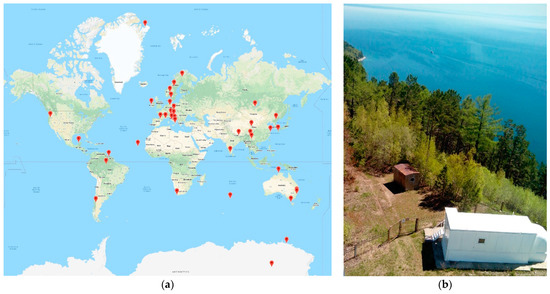
The GMOS (Global Mercury Observation System) project has the overall goal to develop a coordinated observing system to monitor mercury on a global scale. We present the long-term (2011 – 2020) air mercury monitoring data obtained at the Listvyanka station located at a shore of Lake Baikal, Siberia. The long-term monitoring shows obvious seasonal variation of the background mercury concentration in air, which increases in the cold and decreases in the warm season. The short-term anomalies are associated with the wind carrying the air from the industrial areas where several big coal-fired power plants are located. A positive correlation between the mercury, SO2 and NO2 concentrations is observed both in the short-term variations and in the monthly average concentrations. The analysis of forward and backward trajectories obtained with the HYSPLIT model demonstrates revealing of the mercury emissions sources. During the cruise of 2018, the continuous air mercury survey over Lake Baikal covered 1800 km. The average mercury concentration over Baikal is notably less in comparison with the average value obtained at the onshore Listvyanka station during the same days of cruise. That can lead to the conclusion that Baikal is a significant sink of the atmospheric mercury.
- GMOS
- Baikal Lake
- air mercury monitoring
- acid gases
- emission sources
1. Introduction
2. Experimental
2.1. Monitoring Site
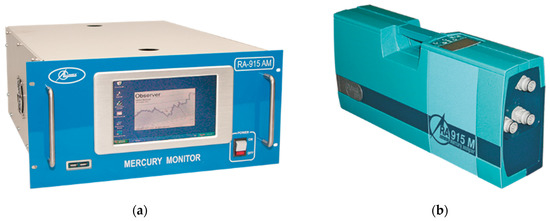
2.2. Stationary Air Mercury Monitoring
2.3. Air Mercury Survey over Baikal
- Air mercury monitoring at the Listvyanka station
3. Air mercury monitoring at the Listvyanka station
This section covers stationary air mercury measurement at the Listvyanka site since November 2011 to December 2020.
3.1. Seasonal variations
The obtained data show obvious seasonal variation of the background mercury concentration in air, increasing in the cold seasons (November – February) with the monthly average of 1.56 - 1.95 ng/m3, and decreasing in warm seasons (June – September) with the monthly average of 1.12 – 1.63 ng/m3 (Fig. 5):
The average mercury background concentration (Cav) for the overall reporting period of November 2011 – December 2020 is 1.59 ng/m3. For cold seasons, Cav has a value of 1.75 ng/m3 that is higher as compared with Cav obtained for warm seasons: 1.44 ng/m3. The difference between the mercury concentrations in the cold and warm seasons amounts to 0.31 ng/m3
The variability of the mercury concentration is also higher at cold months due to elevated emissions from coal-fired power plants .
The behavior similar to the GEM seasonal variation is observed for the particulate bound mercury (PBM), which was being measured since January 2016 to March 2017 (Fig. 6)
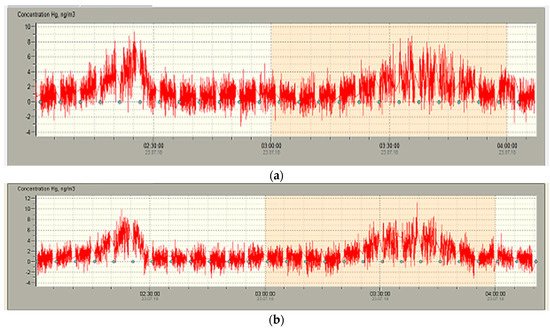
The short-term (minutes – hours) anomalies of the mercury concentration can reach the value up to 5-7, sometimes up to 15-20 ng/m
The short-term (minutes – hours) anomalies of the mercury concentration can reach the value up to 5-7, sometimes up to 15-20 ng/m
3. There are no significant local sources of mercury emissions in the rural surroundings of the Listvyanka site. These short-term anomalies are traced to the mercury air transfer from regional sources of emissions, first of all, from coal-fired power plants located in Irkutsk, Angarsk, and Shelekhov cities 70 and 100 km away from the monitoring points. The long-range transport of acid gases with plumes from regional coal-fired power plants to the South Baikal area was proven by the monitoring data at the Listvyanka site and backward trajectories modelling [8,9]. The mercury observation within the GMOS program shows positive correlation of the mercury peaks with the local anomalies of the acid gases typical for the coal combustion emissions, such as SO2, and NO2 (Fig. 8).
. There are no significant local sources of mercury emissions in the rural surroundings of the Listvyanka site. These short-term anomalies are traced to the mercury air transfer from regional sources of emissions, first of all, from coal-fired power plants located in Irkutsk, Angarsk, and Shelekhov cities 70 and 100 km away from the monitoring points. The long-range transport of acid gases with plumes from regional coal-fired power plants to the South Baikal area was proven by the monitoring data at the Listvyanka site and backward trajectories modelling [8,9]. The mercury observation within the GMOS program shows positive correlation of the mercury peaks with the local anomalies of the acid gases typical for the coal combustion emissions, such as SO2, and NO2 (Fig. 8).
4. Mercury in the air over Lake Baikal
Baikal is the largest freshwater lake by volume containing about 22–23% of the world's fresh water reserves. The largest length and width of the lake are 636 and 79.5 km, respectively. Baikal is the world’s deepest lake with a maximum depth of 1642 m. The lake is fed by more than 300 inflowing rivers and is drained through a single outlet located near Listvyanka village, the Angara River.
So far, there is no data on the air mercury distribution over the vast Baikal basin. In July 2018, for the first time, the air mercury survey had been carried out throughout all Baikal area during cruise of the research vessel (RV) “Akademik Koptyug”. The continuous air mercury survey over Lake Baikal covered 1800 km.
During the cruise, no significant anomalies of the mercury concentration in air above the lake were found. The potential sources of the elevated mercury concentration up to 3-5 ng/m
3 (see Fig. 3) can be explained by the long-distance mercury transfer from the coal-fired power plants of industrial cities (Irkutsk, Angarsk, Shelekhov) described above and the emissions sources of towns located along the lake shore (Fig. 11).
(see Fig. 3) can be explained by the long-distance mercury transfer from the coal-fired power plants of industrial cities (Irkutsk, Angarsk, Shelekhov) described above and the emissions sources of towns located along the lake shore (Fig. 11).
5. Conclusions
According to the long-term air mercury monitoring at the Listvyanka station, the following conclusions are drawn.
The average total (GEM) concentration is 1.59 ng/m3 throughout the 2011-2020 years of observation. The particulate bound mercury (PBM) makes up about 0.8 % of GEM.
The daily average concentration of GEM varies within a range of 1.44 to 1.75 ng/m3 and that of PBM in a range of 7.8 – 15 pg/m3 in the warm and cold seasons, respectively, which is an evidence of the elevated mercury emissions from coal combustion during the cold season.
Statistical data processing shows the moderate diurnal cycling of the mercury concentration at a lower level at night and higher level at daytime.
The space-time distribution and short-term variations of the mercury concentration indicate the long-distance (70 – 100 km) mercury transfer from the industrial sites where the coal-fired power plants are located.
The coal combustion plants are the main sources of the elevated mercury concentration at Listvyanka site, which is confirmed by the evident correlation between the average Hg and SO2, NO2, and O3 concentrations.
The average mercury concentration measured during cruise above Lake Baikal is 1.10 ng/m3 that is notably less as compared with the average value of 1.60 ng/m3 obtained at the onshore Listvyanka GMOS station during the same days of cruise. Thus, Baikal can be a sink of the atmospheric mercury due to the air temperature inversion in warm season.
The possibility of using the data of air mercury monitoring at stationary points and route surveys demonstrates feasible revealing of mercury emission sources.
References
- Sprovieri, F.; Pirrone, N.; Bencardino, M.; D’amore, F.; Carbone, F.; Cinnirella, S.; Mannarino, V.; Landis, M.; Ebinghaus, R.; Weigelt, A.; et al. Atmospheric mercury concentrations observed at ground-based monitoring sites globally distributed in the framework of the GMOS network. Atmos. Chem. Phys. 2016, 16, 11915–11935.
- Cinnirella, S.; D’Amore, F.; Bencardino, M.; Sprovieri, F.; Pirrone, N. The GMOS cyber(e)-infrastructure: Advanced services for supporting science and policy. Environ. Sci. Pollut. 2014, 21, 4193–4208.
- Sholupov, S.; Pogarev, S.; Ryzhov, V.; Mashyanov, N.; Stroganov, A. Zeeman atomic absorption spectrometer RA-915 for direct determination of mercury in air and complex matrix samples. Fuel Process. Technol. 2004, 85, 473–485.
- Brown, R.J.C.; Pirrone, N.; van Hoek, C.; Sprovieri, F.; Fernandez, R.; Tote, K. Standardisation of a European measurement method for the determination of total gaseous mercury: Results of the field trial campaign and determination of a measurement uncertainty and working range. J. Environ. Monit. 2010, 12, 689–695.
- Weigelt, A.; Ebinghaus, R.; Pirrone, N.; Bieser, J.; Bödewadt, J.; Esposito, G.; Slemr, F.; van Velthoven, P.F.J.; Zahn, A.; Ziereis, H. Tropospheric mercury vertical profiles between 500 and 10 000 m in central Europe. Atmos. Chem. Phys. 2015, 15, 28217–28247.
- Osterwalder, S.; Eugster, W.; Feigenwinter, I.; Jiskra, M. First eddy covariance flux measurements of gaseous elemental mercury (Hg0) over a grassland. Atmos. Meas. Tech. 2020, 13, 2057–2074.
- Sommar, J.; Osterwalder, S.; Zhu, W. Recent advances in understanding and measurement of Hg in the environment: Surface-atmosphere exchange of gaseous elemental mercury (Hg0). Sci. Total Environ. 2020, 721, 137648.