Pesticide residues are a threat to the health of the global population, not only to farmers, applicators, and other pesticide professionals. Humans are exposed through various routes such as food, skin, and inhalation. Indirect approaches, also called “external exposure approaches”, estimate the exposure of a population through the measurements of pesticide residue levels in food and the environment. Environmental sampling involves water resources, soils, sediments, and air particles. Recent studies have also included indoor and road dust. In addition, indirect assessment models also include food, as fruits, vegetables, and cereals treated with pesticides have also been proven to be significant sources of pesticides. Furthermore, the pesticide residues in abiotic environmental samples also bioaccumulate in biota. Dietary intake of animal products, including meat and subproducts from farm animals, fish, and seafood, is considered an important route of exposure for population.
- pesticide residues
- human health
- indirect estimation
- estimated intakes
- environmental exposure
1. Environmental and Dietary Exposure to Pesticides
Figure 1 schematizes the main assessment models for pesticide exposure, together with the main pathways.
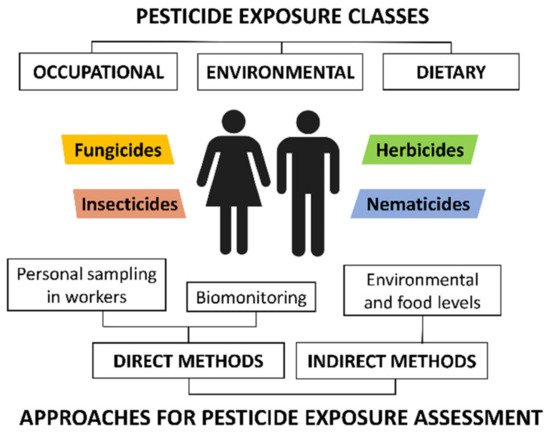
Figure 1.
Classification of pesticide exposure routes and methodologies for pesticide exposure assessment.
Determining pesticides analytically requires knowledge on the physicochemical characteristics of the target compounds and the composition of the studied matrix. The sample preparation, the first step in the determination of pesticides and metabolites, is necessary for enriching and purifying the analytes [1][7]. The principal methods of extraction are solid–liquid extraction (SLE), solid-phase extraction (SPE), solid-phase microextraction (SPME), and dispersive liquid–liquid micro-extraction (DLLME). The most popular method based on SLE is the Quick, Easy, Cheap, Effective, Rugged, and Safe (QuEChERS) method, which involves SLE followed by a clean-up process, usually using dispersive solid-phase extraction (d-SPE) [2][1]. The next steps of the analytical process are the separation and detection of pesticide residues. In recent years, the most used strategies for separating pesticide residues in a prepared sample have been gas chromatography (GC) and liquid chromatography (LC) due to their versatility and separation abilities coupled to mass spectrometry detectors (high and low resolution and in tandem) [3][5]. Other detectors also applied include electron capture detection (ECD), fluorescence programmable detection (FPD), and dual flame photometric detection (DFPD) [4][12]. The selected analytical methods require an accurate validation that is based on the use of analytical standards and involves the establishment of linearity, matrix effects, accuracy (commonly as recoveries) [4][12], sensitivity (limits of detection and quantification of the target analytes), and precision (by assessment of repeatability and reproducibility) [5][31].
The main mathematical approach to assess pesticide exposure through food is based on calculating the estimated daily intake (EDI) and the hazard index (HI) [6][28]. Long-term hazards are evaluated using the acceptable daily intake (ADI), a reference point established by the Joint FAO/WHO Meeting on Pesticide Residues (JMPR) that specifies the maximum permitted daily intake for a person over a lifetime without major risk to the individual [7][37]. The maximum residue limit (MRL) means the maximum concentration of a pesticide residue (mg/kg) legally permitted in food and animal feeds. In this context, pesticide residue includes any derivatives of a pesticide, such as conversion products, metabolites, reaction products, and impurities considered to be of toxicological or ecotoxicological significance [8][38]. MRLs are established in each country or association of countries (such as the European Union) to ensure legal compliance, although most of them are based on those recommended by the Codex Alimentarius Commission (CAC) [2][7][1,37]. CAC MRLs are based on toxicological and agronomic criteria and can be used to calculate the worst-case scenario of exposure. In indirect methods, the pesticide levels determined in food are used to calculate the estimated daily intake (EDI), according to Equation (1) [6][28].
where RLi is the pesticide residue level, Fi is the consumption rate of food, and BW is the mean body weight of the study population. Acute dietary risk (RQa) has also been evaluated in some studies through the calculation of the national estimated short-time intake (NESTI), which requires the highest residue value (HR) and the large portion of food for general consumer (LP).
The cumulative human exposure to pesticides detected in surface water, groundwater, and drinking water can be determined using different mathematical approximations. These include estimating the chronic daily intake (CDI) or the estimated daily intake (EDI) using the reference dose (RfD) or the ADI for each compound and the concentration in each water sample. Some studies have considered both ingestion and dermal contact and calculated the noncarcinogenic health risk (HI) and the cancer risk (CR) associated with drinking water and bathing exposure. In sediment and soil, human exposure was assessed covering the cancer and noncancer risk, also called total lifetime carcinogenic risk (TCLR) and total noncarcinogenic hazard quotient (THQ) [9][10][11][39,40,41]. Thus, the human exposure and health risk were assessed as a sum of the risk for inhalation, ingestion, and dermal exposure.
The most common approach to estimate the inhalation exposure of atmospheric pesticides is based on the calculation of the inhalation daily intake doses (DIinh), which requires the mean concentration of the analytes in inhaled air, as well as the inhalation rate and the mean body weight. Some studies have also considered the exposure duration and its frequency. The human health risk is assessed using the hazard quotient (HQ), which results from dividing the DIinh by the health base reference values (HBRV).
For the calculation of EDI in direct methods through biomonitoring studies, the levels of metabolites measured in urine are normally converted into daily intake of parent compound using Equation (2) [6][28].
where CU is the molar concentration of the nonspecific and/or specific pesticide metabolites, VU is the total volume of urine excreted within 24 h, MWP is the molecular weight of the parent compound, and FUE is the urinary excretion factor of the parent compound. In both approaches, the risk quotient (HQ) is calculated by the ratio between EDI and ADI [12][42].
The main approaches to assess the health risk of pesticides in dust are related to dermal and ingestion exposure pathways. Yadav et al. [13][14][43,44] estimated the dust ingestion and the dermal absorption risk using USEPA’s risk assessment guideline. Anh et al. [15][34] assessed the daily intake doses of pollutants via road dust ingestion also taking into account the fraction of time the individual spent outdoors.
In addition to mathematical approximations, many studies have assessed the exposure of a population to pesticides using questionnaires and personal interviews. These tools provide information about diet, occupation, education, residence, nearby agricultural areas, pesticide use, exposure duration, etc. Figure 2 shows the main steps necessary to conduct a comprehensive pesticide exposure assessment of a population.
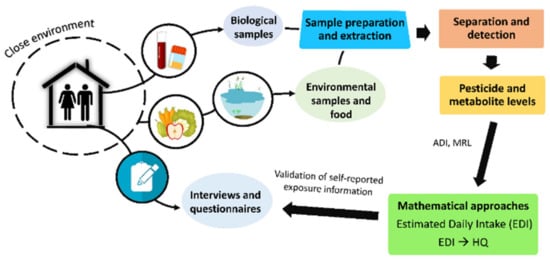
Figure 2. Main steps involved in a comprehensive assessment of human exposure to pesticides.
Furthermore, in WBE, for the back-calculation of population exposure and intake, the four referenced articles followed the same methodology [16][17][18][19][45,46,47,48]. First, they calculated the daily mass load (MLday) of the selected biomarkers, following Equation (3).
where Conc is the total concentration of the target analyte in influent wastewater, and V is the volume of wastewater received by the WWTP per day.
Then, the human intake (Q) was calculated following Equation (4).
where mass loads calculated were normalized to the number of people served each day by the WWTP (P), and specific correction factors (CF) were applying according to the percentage of excretion of each compound in human urine.
2. Environmental Monitoring
2.1. Analysis of Pesticide Levels in Water, Sediment, and Soil
A total of four studies assessing pesticide levels in water, three in soil, one in sediment, and three in both water and sediment samples were included. Three of these studies involved pesticide multi-analyses: Huang et al. [20][49] analyzed 56 pesticides in groundwater samples, covering OCPs, OPPs, and carbamates. Dong et al. [21][50] evaluated the levels of 65 pesticides in surface water and sediment samples, including OCPs, OPPs, triazines, and amides. Lastly, Bradley et al. [22][51] selected 224 and 119 target pesticides in water surface and sediment matrices, respectively, covering a wide spectrum of compounds. The remaining studies screened specific groups of compounds, such as neonicotinoid insecticides (NEOs) (e.g., acetamiprid, clothianidin, and imidacloprid) [23][24][52,53], OCPs and some specific metabolites [9][10][11][25][26][39,40,41,54,55], and OPPs and OCPs, among others [27][56].
In relation to the extraction strategies, six different techniques were identified. Figure 3 shows the percentage of studies depending on the matrix and the extraction method. Pesticides analyzed in water were extracted by LLE or SPE. In LLE, reported solvents were dichloromethane or a mixture of ethyl acetate/methylene. In addition, Lu et al. [23][52] and Jin et al. [25][54] proposed cleaning up the organic phase obtained through a silica gel column. In SPE, the water samples were passed through HLB or C18 sorbents, and then eluted with acetonitrile, methanol, dichloromethane, or ethyl acetate solutions. On the other hand, pesticides analyzed in sediment and soil were commonly extracted by pressurized liquid extraction (PLE), QuEChERS, SPE, and Soxhlet. Reported PLE methodologies were similar, using the accelerated solvent extractor to perform the extraction process at high pressure and temperature (over 1500 psi and 100–120 °C). Then, the extracts were concentrated to near dryness, reconstituted in different solvents, and purified by SPE to reduce matrix interferences using two different cartridges (Florisil® and ENVI-CARB/PSA). Tran et al. [10][40] also passed the extract through an activated copper column (Cu powder activated with a 20% HCl solution) prior to the SPE to remove sulfurs. QuEChERS extraction was carried out using 1% acetic acid in acetonitrile as solvent sodium acetate for buffering at pH 4.5 and sodium chloride and magnesium sulfate for salting out, followed by dSPE. This is the acetate-buffered version of the QuEChERS recommended by the American Official Association of Analytical Chemists (AOAC) [28][57]. Lastly, Ali et al. [11][41] applied a solid–liquid extraction (SLE) method using continuous Soxhlet extraction with acetone/n-hexane (1:1, v/v) solvent. Sediments are quite complex matrices that strongly retain pesticides in the organic matter (humic and fulvic acids) or in the silts, and they sometimes require the application of exhaustive extraction to properly recover pesticides.
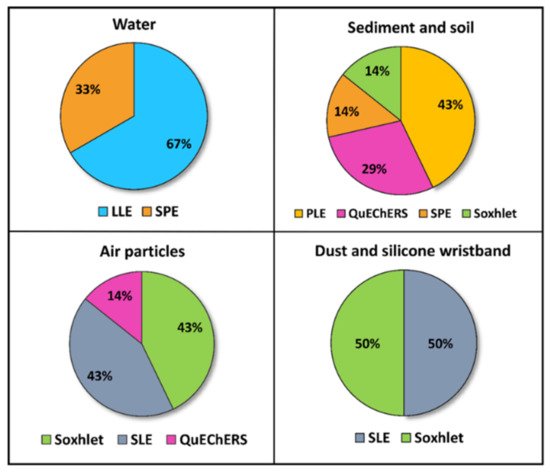
Figure 3. Percentage of articles (2019–2021) according to the extraction procedures applied in every environmental matrix studied (Source: Table 1). LLE: liquid–liquid extraction; SPE: solid-phase extraction; PLE: pressurized liquid extraction; QuEChERS: Quick, Easy, Cheap, Effective, Rugged, and Safe extraction method.
Although several studies have determined LC–MS to be more sensitive than GC–MS for detecting the main classes of currently used pesticides, only three studies exclusively used LC–MS to analyze extracted pesticides, where the MS/MS was conducted with an electrospray ionization (ESI) source in the positive ion mode (Bradley et al. [22][51] also worked in the negative ion mode), with multiple selected reaction monitoring (MRM). In the other studies, the separation and the detection of the analytes were performed by GC–MS. Lastly, Bhandari et al. [11][41] applied both GC–MS for volatile pesticides and LC–MS/MS for more polar ones. Information regarding the analytical procedures, as well as the obtained recoveries and detection limits, is summarized in Table 1.
2.2. Analysis of Pesticide Residues in Atmospheric Particulate Matter
During the pesticide application in crops by aircraft or land spraying, 30% to 50% of the applied amount can remain in the atmosphere [29][58]. Accordingly, in the last few years, the study of the atmospheric levels of pesticides has received more attention. This review includes six studies assessing pesticide levels in atmospheric particulate matter, including two studies combining the measures of ambient air and urinary levels. The publications covered mainly OPPs and OCPs, although two studies focused on the detection of some relevant NEOs such as imidacloprid, acetamiprid, clothianidin, and thiamethoxam [30][31][59,60]. Air samples were collected by suspended particulate samplers (high or low volume, according to the study) equipped with quartz or glass fiber filters (GFFs) and polyurethane foam (PUF) cartridges. Two sampling methods were identified: the active air sampling method, which requires the use of a pumping device to actively pass air through the air sample container, and the passive method using PUF discs. The latter, also called the PUF-PAS method, has been widely used for organic pollutant measurements due to its advantages of low cost (no power supply required) and simple handling [32][61].
Three extraction techniques have been employed for the extraction of pesticides from this sampler (Figure 3): Soxhlet, SLE, and QuEChERS. In Soxhlet extractions, the filters and cartridges or PUF discs were washed with different organic solvents. The extraction process duration ranged from 4 h to 24 h. In the study carried out by Yu et al. [33][62], while PUFs were Soxhlet extracted, GFFs were cut and extracted by SLE with an n-hexane/acetone mixture in a microwave extractor. Similarly, in the studies of Ikenaka et al. [31][60] and Yera et al. [29][58], the filters were cut and sonicated with solvent mixtures of ethyl acetate/acetone (9:1, v/v) and ethyl acetate/acetonitrile (30:70, v/v), respectively. Lastly, Zhou et al. [30][59] developed a QuEChERS extraction to detect NEOs in PM2.5, using acetonitrile as the sorbent and applying a clean-up process with primary secondary amine (PSA). Subsequently, pesticides extracted from air samples were detected by LC–MS/MS and GC–MS. Specifically, Pirard et al. [34][63] split the final extract into two fractions for LC and GC analysis, in order to separate and detect volatile compounds more efficiently. In LC–MS/MS, the instruments operated in MRM mode with ESI+ (Pirard et al. [34][63] also worked in the negative ion mode). In GC–MS/MS analysis, the mass spectrometer operated with electron ionization (EI) or negative chemical ionization (NCI).
2.3. Analysis of Pesticides in Dust and Passive Samplers
Indoor dust, as well as road dust, can serve as a reservoir of semi-volatile organic compounds (SVOCs), including OCPs [13][43]. For this reason, pollution monitoring data of dust provide useful information on the behavior and fate of pesticides in the environment and can be utilized as another approach to study the exposure of these pollutants in urban environments. Our review includes three studies analyzing OCPs levels in dust. Figure 3 and Table 1 show the extraction techniques applied to dust samples and the main issues related to the analytical procedures. The research group of Yadav et al. [13][14][43,44] carried out two very similar studies in which they analyzed OCP (and PCB) residues in dust samples from different types of indoor environment, taken by vacuuming. For pesticide extraction, the freeze-dried and homogenized dust samples were extracted with dichloromethane using a Soxhlet extractor for 24 h, followed by silica–alumina column clean-up. In both studies, pesticide analyses were carried out by GC–triple quadrupole (QqQ)-MS, using the same capillary column and carrier gas. The mass spectrometer was operated operating using EI mode with selected ion monitoring (SIM). Anh et al. [15][34] screened 10 classes of micropollutants in road dust, including 10 OCPs. The samples were manually collected by sweeping the asphalt surface, and then homogenizing them into a representative pooled sample. The target analytes were extracted by SLE with acetone plus an acetone/hexane (1:1, v/v) solution, using an ultrasonic processor. Then, the extracts were purified by an activated silica gel column. Separation and detection of micropollutants were carried out by GC–MS equipped with an Automated Identification and Quantification System (AIQS-DB) system that facilitated the identification of the compounds.
To conclude the review on environmental monitoring, we include the study carried out by Arcury et al. [35][64], in which exposure to pesticides of children from rural and urban communities was evaluated under a different approach from those explained above. In practice, they gave the children silicone wristbands (with consent from parents or guardians) for passive exposure monitoring. The wristbands were cleaned after deployment with 18 MΩ·cm water and isopropanol to remove particulate matter, and then the analytes were extracted by SLE with ethyl acetate. Analytical interferences were removed by an SPE clean-up process using a silica column with acetonitrile. Recoveries between 14% and 142% were obtained from the QA/QC tests. Finally, the pesticide quantification was carried out by GC–ECD, using a DB-XLB column for confirmation. Children exposure was evaluated using information collected from an interviewer-administered questionnaire, comparing by statistical test the pesticide classes and levels detected with the participant personal and family characteristics. More information about this study is shown in Table 1.
2.4. Analysis of Pesticide Residues in Food
A total of 19 articles on the assessment of pesticide residues in food were selected. Foods analyzed are shown in Figure 4. A wide variety of vegetables were studied, including tomatoes, lettuce, kale, French beans, and water spinach. Specifically, in the study carried out by Yi et al. [36][65], 96 types of vegetables were analyzed including leafy vegetables, stem vegetables, roots, and tubers. Other foods analyzed in the articles reviewed were fruits (apples and peaches), cereals (wheat and maize, both straw and grain, as well as the maize corncob), different bee products, such as wax and honey, and even fish from estuaries, lagoons, or aquaculture. Lastly, Nougadère et al. [37][66] analyzed pesticide residues in other food products, including manufactured baby foods and common food such as cakes, pasta, or fried breaded fish.
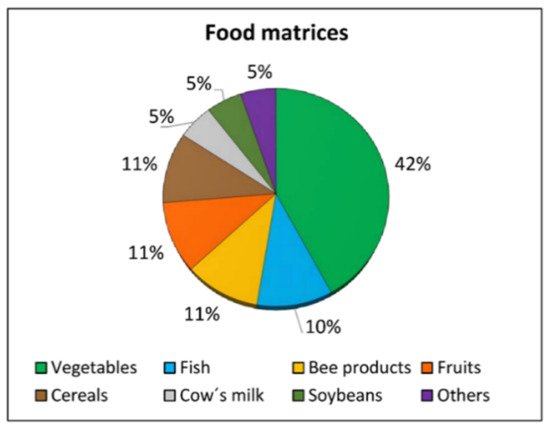
Figure 4. Food matrices according to the percentage of studies (2019–2021) that evaluated the levels of pesticide residues in them and the associated risk of exposure of the population (Source: Table 1).
Three of these studies involved pesticide multiresidue analyses. Bommuraj et al. [38][67] screened hundreds of pesticide residues (over 600) of different classes in beeswax and honey, including NEOs, OPPs, OCPs, and pyrethroids (PYRs). Yi et al. [36][65] analyzed 283 different pesticide residues, including several insecticides, fungicides, herbicides, miticides, growth regulators, and one plant activator. In addition, Nougadère et al. [37][66] screened over 500 pesticides and metabolites in food composite samples, comprising pesticides of different chemical structures (mainly fungicides, insecticides, and herbicides). All the remaining studies evaluated specific groups of pesticides, such as the most used OCPs (e.g., DDT, heptachlor, endrin, and chlordane) or single compounds such as flumethrin, tebuconazole, tembotrione, or pymetrozine.
Table 1. Selected analytical methods published between 2019 and 2021 for the analysis of pesticides in environmental matrices and food to analyze human exposure.
| Sample | Nº Pesticides or Biomarkers | Sample Treatment | Separation and Detection Technique | Recovery % | LOD | Ref. | |||
|---|---|---|---|---|---|---|---|---|---|
| Matrix | Volume/Weight | Method | Extraction | Clean-up | |||||
| Drinking water (TPW and tap) | 50 mL | 7 | LLE | 30 mL DCM | Purified passing sample through a chromatographic column | UPLC–QqQ-MS/MS: in MRM ESI + |
73–94% | 30–70 ng/L | [23][52] |
| Drinking water (groundwater and tap) | 500 mL | 16 | SPE | Oasis HLB (6 cc/500 mg) eluted with 4 mL CAN + 4 mL methanol |
- | UPLC–MS/MS: in MRM ESI+ |
74–123% | 0.01–0.2 ng/L * | [24][53] |
| Groundwater | 1000 mL | 56 | LLE | 20 mL DCM (×3): with three pH conditions (6.5–8.0, <2.0, and >10.0) | - | GC–MS: SIM and SCAN mode EI |
70–133% | 2.5–247 (ng/L) | [20][49] |
| Tap water | 500 mL | 9 | LLE | 70 mL DCM | Silica gel column with anhydrous Na2SO4 (CNWBOND 10 cc/10 g) | GC–MS: in MRM mode EI | 76–94% | 0.0011–0.43 ng/L | [25][54] |
| Surface water | 1000 mL | 65 | SPE | C18 (6 cc/1000 mg) | 5 mL ethyl acetate + 5 × 2 mL DCM | GC–MS/MS: in SRM EI |
- | - | [21][50] |
| Sediment and soil | - | PLE | Acetone/DCM (1:1, v/v) | Florisil ® (6 cm3/1000 mg) eluted with 10 mL acetone/hexane (20/80 v/v) | |||||
| Surface water | 1000 mL | 8 | LLE | Ethyl acetate + methylene | - | GC–MS: in SIM EI |
80–94% | 1.05–2.60 ppb | [26][55] |
| Sediment | 5 g | QuEChERS | 15 mL ACN 1% AA + 6 g MgSO4 + 1.5 g NaOAc | d-SPE with 25 mg PSA + 25 mg C18 +7 mg GCB + 150 mg MgSO4 | |||||
| Surface water | 10 mL | 224 | - | - | - | DAI to LC–MS/MS: in MRM ESI+/− |
34–135% | 1.0–106 ng/L | [22][51] |
| Sediment | 10 g | 119 | PLE | DCM; purified in a Florisil® (6 cm3/1000 mg) |
Purification: 1º fraction: DCM + 50:50 DCM: ethyl acetate; 2º fraction: 20% DCM in hexane + 50% ethyl acetate in hexane | GC–MS/MS: in SIM EI |
75–102% | 0.6–3.4 μg/kg | |
| Soil | 20 g | 21 | Soxhlet | Acetone/n-hexane (1:1, v/v) | Florisil cartridge (6 cc/1000 mg) eluted with 5 mL n-hexane/acetone (95:5, v/v) | GC–MS | 75.9–126.1% | - | [11][41] |
| Soil | 5 g | 23 | QuEChERS | 10 mL ACN 1% AA + 1 g NaOAc + 4 g MgSO4 | dSPE with 50 mg PSA + 150 mg MgSO4 | Polar compounds: LC–MS/MS: Ionization in + and − |
70–120% | 1–10 μg/kg | [27][56] |
| A-polar compounds: GC–MS/MS |
|||||||||
| Soil | 1 g | 8 | SPE | 10 mL cartridge column packed with: Na2SO4 (0.5 g) | Florisil (1 g, 60–100 mesh), acidic silica gel (1 g) + copper powder (0.5 g) eluted with 15 mL DCM | GC–ECD: in SIM EI ionization |
80–96% | 0.001–0.025 ng/g | [9][39] |
| Sediment | 4 g | 8 | PLE | Acetone/n-hexane (1:1, v/v); purified two times: (1) in an activated copper column (20% HCl); (2) ENVI-CARB/PSA cartridge (6 cc/500 mg) | 3 mL hexane (1st purification); 6 mL hexane-ethyl-acetate (7/3, v/v) (2nd purification) |
GC–MS: in SIM EI ionization |
89–118% | - | [10][40] |
| Air particulates | 1344 m3 | 46 | Soxhlet | Hexane/acetone/MeOH (50:40:10 v/v/v) | - | UPLC–MS/MS: in MRM ESI+/− |
72–128% | 0.04–0.1 ng/m3 * | [34][63] |
| GC–MS-QqQ: in MRM EI− |
|||||||||
| Air particulates | - | 7 | SLE | 10 mL ethyl acetate/acetone (9:1, v/v) | - | LC–MS/MS: in MRM mode ESI+ |
- | - | [31][60] |
| Air particulates | 30 m3 | 10 | Soxhlet | Acetone | Exchanged into hexane; purified in a silica gel column | GC–MS: EI ionization |
60–149% | 0.1–1 ng/m3 | [32][61] |
| Air particulates | 432 m3 | 26 | PUF: Soxhlet | 150 mL n-hexane/acetone (v/v, 1:1) | Silica gel/alumina chromatographic column eluted with 70 mL DCM | GC–MS: in SIM mode Negative chemical ionization (NCI) | 65–120% | 0.1–25.0 pg/m3 | [33][62] |
| GFF: SLE | 25 mL n-hexane/acetone (v/v, 1:1) | ||||||||
| PM2.5 | 158.4 m3 | 4 | QuEChERS | 20 mL ACN | dSPE with 0.4 g PSA | LC–MS/MS-QqQ: in MRM ESI+ |
78–97% | 0.0005–0.355 ng/m3 | [30][59] |
| PM2.6 and PM10 | 1627.2 m3 | 34 | SLE | 500 µL ethyl acetate/ACN (30:70) | - | GC–MS: in SIM EI |
90–144% | 0.14–0.44 ng/mL | [29][58] |
| Dust (indoor) | 10 g | 26 | Soxhlet | DCM; purified in a silica–alumina column | - | GC–MS-QqQ: in SIM EI |
88–110% | 1.31–7.30 pg/g | [13][43] |
| Dust (indoor) | 20 g | 24 | Soxhlet | 300 mL DCM; purified in a silica–alumina column | - | GC–MS-QqQ: in SIM EI |
88–110% | 1.31–7.30 pg/g | [14][44] |
| Dust (road) | 2 g | 10 | SLE | 10 mL acetone + 10 mL acetone/hexane (1:1, v/v); purified in a silica gel column | DCM + hexane (purification) | GC–MS | 60–120% | 0.0010–0.010 μg/g | [15][34] |
| Silicone wristband | - | 75 | SLE | 50 mL ethyl acetate; purified in a C18 silica column (500 mg) | 9 mL ACN (purification) |
GC–ECD | 11–142% (median 55%) | 0.44–20.9 pg/µL |
[35][64] |
| Fish | 3 g | 8 | PLE | Acetone/n-hexane (1:1, v/v) | Twice: (1) with a copper column eluted with hexane (2) ENVI-CARB/PSA cartridge eluted with6 mL hexane/ethyl-acetate (7:3, v/v) |
GC–MS: in SIM EI |
89–118% | - | [10][40] |
| Fish | 3 g | 18 | Soxhlet | 150 mL hexane/acetone (3:1, v/v) | Glass column (30 cm × 1 cm) [1 g neutral alumina + 1 g neutral silica + 8 g acidified silica + 4 g Na2SO4] eluted with 50 mL DCM and hexane (1:1, v/v) | GC–μECD | 61–136% | 0.0003–0.0054 ng/g | [39][68] |
| Cow´s milk | 2 g | 18 | LLE | 3 mL n-hexane/DCM (1:1, v/v) | Glass column (30 cm × 1 cm) [1 g 5% deactivated silica + 1 g 5% deactivated Florisil + 1 g Na2SO4] eluted with 15 mL n-hexane + 10 mL DCM | GC–μECD | 70–109% | 0.003–0.63 ng/g | [40][69] |
| Wax | 20 g | 1 | QuEChERS | 10 mL ACN; NaCl + MgSO4 + sodium citrate + sodium hydrogen citrate sesquihydrate | dSPE (150 mg MgSO4 + 25 mg C18 + 25 mg PSA) | LC–MS/MS: in MRM ESI− |
95% | 20 μg/kg * | [41][70] |
| Wax | 1 g | More than 600 | QuEChERS | 10 mL water + 10 mL CAN + Supel™ QuE citrate/sodium bicarbonate | dSPE using Supel™ QuE PSA/C18 clean-up tube | LC–MS/MS: in MRM ESI+/− |
- | 0.0005–0.002 mg/kg | [38][67] |
| Honey | 2 g | QuEChERS | 10 mL ACN + 4 g anhydrous MgSO4 + 1 g trisodium citrate dihydrate + 0.5 g disodium hydrogen citrate sesquihydrate + 1 g NaCl | dSPE clean-up with 900 mg anhydrous MgSO4 + 150 mg of PSA | GC–MS/MS: in SRM mode EI ionization |
- | 0.002 mg/kg | ||
| Tomato | 10 g | 21 | QuEChERS | 10 mL ACN + 1 g NaCl + 1.5 g citrate | dSPE clean-up with 900 mg MgSO4 + 150 mg PSA 150 mg C18 | OPPs: GC–NPD | 72–116% | 0.5–10 μg/kg | [42][71] |
| Halogenated: GC–ECD | |||||||||
| Lettuce | Methyl-carbamates: HPLC–FLD | ||||||||
| Imidacloprid and carbendazim: HPLC–DAD | |||||||||
| 96 types of vegetables | 50 g | 283 | SLE | 100 mL ACN; 10 g NaCl | For GC: Sep-Pak Florisil (6 cm3/1000 mg) eluted with 7 mL 20% acetone/hexane For LC: Sep-Pak NH2 (6 cm3/1000 mg) eluted with 5 mL 1% MeOH/DCM |
OPPs and nitrogen-containing compounds: GC–NPD | 82.5–103.1% | 0.0006–0.024 mg/kg | [36][65] |
| OCPs, dicarboximide and PYR: GC–μECD | |||||||||
| Carbamate pesticides: LC–FLD | |||||||||
| UV-detected compounds: LC–DAD: APCI+ | |||||||||
| Tomato | 10 g | 7 | QuEChERS | LC–MS/MS: ESI | 76.84–96.32% | 0.10 μg/kg | [43][72] | ||
| French beans | 10 mL ACN + 150 mg MgSO4 | dSPE with 150 mg MgSO4 + 50 mg PSA + 50 mg GCB | |||||||
| Kale | |||||||||
| Tomato | 10 g | 2 | QuEChERS | 10 mL ethyl acetate + 4 g anhydrous MgSO4 + 1 g NaCl | dSPE 50 mg PSA + 150 mg anhydrous MgSO4 | GC–ECD | 83.1–102.2% | 0.01 mg/kg | [44][73] |
| Water spinach | 5 g | 2 | SLE | 10 mL ACN; 1.5 g NaCl | - | LC–MS/MS: ESI | 91–101% | 0.02 mg/kg * | [45][74] |
| Chlorothalonil: GC–MS: in SRM mode EI |
94–105% | 0.01 mg/kg * | |||||||
| Kale | 10 g | 4 | SLE | 15 mL MeOH | Purified with 50 mg C18 | LC–MS/MS-QqQ: in MRM mode ESI+/− |
26.5–89.6% | 0.14–20.3 μg/kg | [46][75] |
| Apple | 10 g | 3 | QuEChERS | 10 mL ACN + 1 g NaCl + 4 g MgSO4; | dSPE with 250 mg MgSO4 + 100 mg PSA + 15 mg GCB | Lambda-cyhalothrin: GC/MS: in SIM mode EI |
88–105% | 0.01 mg/kg * | [47][76] |
| Thiamethoxam and clothianidin: RRLC–MS/MS-QqQ: in MRM EI+ | |||||||||
| Peaches | 10 g | 2 | QuEChERS | 20 mL ACN + 3 g NaCl | dSPE with 100 mg C18, 100 mg PSA + 300 mg of MgSO4 | LC–MS/MS-QqQ ESI |
83–119% | 0.01 mg/kg | [48][77] |
| Lettuce | 10 g | 18 | QuEChERS | 10 mL ACN/AA (99:1, v/v) + 6 g MgSO4 + 1.5 g NaOAc + 1.0 g sodium acetate trihydrate (CH3COONa·3H2O); | d-SPE clean-up with 1.2 g MgSO4, 0.4 g C-18, 0.4 g PSA + 0.4 g Florisil | GC × GC–TOF-MS | - | 0.5–0.9 ng/g | [49][78] |
| Spinach | 74–106% | ||||||||
| Spring onions | - | ||||||||
| Peanuts | 5 g | 73–101% | |||||||
| Lettuce | 2 g | 8 | SLE | 10 mL ACN + 4 g Na2SO4 +1 g NaCl; | Two SPE purification: (1) d-SPE clean-up with 75 mg of C18, 75 mg of PSA + 1350 mg of Na2SO4; (2) SPE cartridges of 6 cc/100 mg eluted with 4 mL ethyl acetate | GC–MS/MS-QqQ: in SRM mode EI |
- | 0.013–4.45 µg/kg | [50][79] |
| Tomatoes | 69–96% | ||||||||
| Cauliflower | 47–87% | ||||||||
| Broad beans | 41–98% | ||||||||
| Wheat grain | 5 g | 2 | QuEChERS | 10 mL ACN + 1 g NaCl + 4 g MgSO4; | d-SPE clean-up with 150 mg MgSO4 + 50 mg C18+ 10 mg GCB | HPLC–MS/MS: in MRM mode | 87–112% (epoxiconazole) and 85–102% (pyraclostrobin) | 0.01 mg/kg * | [51][80] |
| Wheat straw | 1 g | ||||||||
| Maize grain | 5 g | 2 | QuEChERS | 10 mL 5% AA/ACN + 1 g NaCl + 4 g MgSO4; | Two types of dSPE: Maize grain and straw: 50 mg PSA + 5 mg MWCNTs + 150 mg MgSO4; Corncob extract: 50 mg PSA + 150 mg MgSO4 | HPLC–MS/MS: in MRM mode ESI− |
98–107% (tembotrione) and 90–108% (M5) | 0.43–1.5 μg/L | [52][81] |
| Maize corncob | 2 g | ||||||||
| Maize straw | 1 g | ||||||||
| Soybean | 5 g | 5 | QuEChERS | 10 mL 1% AA/ACN + 1 g NaCl + 3 g MgSO4; | Two types of dSPE: Soybean: 50 mg C18 + 150 mg MgSO4; Green soybean and straw: same + 5 mg MWCNTs |
UPLC–QqQ-MS/MS: ESI |
71–116% | 0.018–0.125 μg/kg | [53][82] |
| Green soybean | 5 g | ||||||||
| Soybean straw | 2.5 g | ||||||||
| Common food (vegetables, fruit, cakes) | 10 g (non-cereal-based) 5 g (cereal-based) |
516 | Non-cereal-based: QuEChERS (vers. 1); Cereal-based: QuEChERS (vers. 2) |
Vers. 1: 10 mL ACN + 1 g NaCl + 4 g MgSO4 + 0.5 g disodium hydrogen citrate sesquihydrate + 1 g trisodium citrate dihydrate Vers. 2: 20 mL ACN + 1 g NaCl + 4 g MgSO4 + 0.5 g disodium hydrogen citrate sesquihydrate + 1 g trisodium citrate dihydrate; |
dSPE: 150 mg MgSO4 + 25 mg PSA | 221 analytes: LC–MS/MS-QqQ: ESI+/− |
70–120% | 0.1–10 µg/kg | [37][66] |
| Baby food (prepared) | Non-cereal-based: QuEChERS (vers. 3); Cereal-based: QuEChERS (vers. 4) |
Vers. 3: 10 mL ethyl acetate + 1 g NaCl + 4 g MgSO4 + 0.5 g disodium hydrogen citrate sesquihydrate + 1 g trisodium citrate dihydrate;; Vers 4: 20 mL ethyl acetate/cyclohexane 81:1 + 1 g NaCl + 4 g MgSO4 + 0.5 g disodium hydrogen citrate sesquihydrate + 1 g trisodium citrate dihydrated |
Vers.3: Purified in HPGPC column Vers 4: dSPE with 25 mg PSA + 25 mg C18 + 5 mg carbon |
135 analytes: GC–MS/MS: in MRM mode EI | |||||
* LOQ value was reported, when LOD was not available. µECD: microelectron capture detector; AA: acetic acid; ACN: acetonitrile; APCI: atmospheric pressure chemical ionization; DAD: diode array detection; DAI: direct aqueous injection; DCM: dichloromethane; ECD: electron capture detection; EI: electron ionization; ESI: electrospray ionization; FA: formic acid; FLD: fluorescence detector; GCB: graphitized carbon black; GFF: glass fiber filter; LLE: liquid–liquid extraction; MRM: multiple single-reaction monitoring; MWCNTs: multiwalled carbon nanotubes; NaOAc: sodium acetate; NCI: negative chemical ionization; NPD: nitrogen–phosphorus detector; OCPs: organochlorine pesticides; OPPs: organophosphorus pesticides; PM: particulate matter; PSA: primary secondary amines; PLE: pressurized liquid extraction; PUF: polyurethane foam; PYR: pyrethroid; SIM: selected ion monitoring; SLE: solid–liquid extraction SPE: solid-phase extraction; SRM: selected reaction monitoring; TRV: toxicological reference value; Water: surface water.
Pesticide residues in food were extracted by QuEChERS, SLE, LLE, PLE, and Soxhlet. QuEChERS procedures were quite similar each other and required a sample amount between 1 and 20 g. Acetonitrile was by far the most used solvent, followed by ethyl acetate. Extractions were followed by clean-up process, mainly carried out by d-SPE with magnesium sulfate, C-18, and PSA (primary secondary amine). A distinction between cereal- and non-cereal-based food was carried out by Nougadère et al. [37][66], with minor variations in the extraction protocol (eluent volume, subsequent cleaning process, etc.). In SLE, the sorbents used were acetonitrile and methanol. Sodium chloride was added to the sample in acetonitrile separations to get the salting out effect. Subsequently, the extractions were accelerated using a high-speed homogenizer, by sonication, or by vortex agitation. The extracts were mainly cleaned up using C18, PSA, or sodium sulfate, or using commercial SPE cartridges (of 6 mL and 100–1000 mg), with different eluents such as ethyl acetate. Pesticide residues in milk were extracted after acidification with formic acid by a LLE with n-hexane/dichloromethane aided by a vortex [40][69]. The extracts were cleaned by passing through a silica column (with Florisil and anhydrous sodium sulfate) and eluting the pesticides with n-hexane followed by dichloromethane. PLE was performed on fish samples with a mixture of acetone/n-hexane (conditions: 125 °C and 1500 psi) [10][40]. Then, two purifications were performed. First, the fish extract was treated with sulfuric acid and passed through a prerinsed glass tube with acid/silica, eluting with hexane. Subsequently, the eluate was cleaned in an ENVI-CARB/PSA cartridge and eluted with hexane/ethyl acetate. Lastly, Olisah et al. [39][68] followed a different methodology for the pesticide extraction from fresh fish samples, using a hexane/acetone mixture in a Soxhlet extractor for 24 h. After the extract was reduced, pesticide residues were eluted with dichloromethane and hexane in a glass column previously prepared with neutral alumina, neutral and acidified silica, and sodium sulfate.
Pesticide detection and quantification were performed using different apparatus and techniques. LC–MS/MS with a triple quadrupole (QqQ) was used to analyze wax samples and some vegetable and fruit samples, operating in MRM mode. ESI ionization differed between positive and negative depending on the target analytes. Fan et al. [47][76] also applied LC–MS/MS-QqQ with positive electron ionization to specifically analyze thiamethoxam and clothianidin compounds. LC–FLD (fluorescence detector) was used to analyze residues of carbamate pesticides, and LC–DAD (diode array detection) was used to analyze imidacloprid and carbendazim from vegetables. GC–MS/MS was widely used in multi-analysis, working in SRM, MRM, and SIM modes. Buah-kwofie et al. [49][78] analyzed OCP residues from vegetable samples by two-dimensional gas chromatography/time-of-flight-mass spectrometry (GC × GC–TOF-MS). In addition, GC–microeletron captutre detection (µECD) was used in several studies to analyze OCPs, OPPs, and PYRs in food samples of different classes (milk, fish, and vegetables). Lastly, GC–nitrogen phosphorus detection (NPD) was used to analyze some OPP analytes and other nitrogen-containing compounds from vegetable samples. All information regarding the analytical procedures, equipment, recoveries, and detection limits determined are summarized in Table 1.