Mucopolysaccharidosis type IVA (MPS IVA) is a lysosomal disease caused by mutations in the gene encoding the enzymeN-acetylgalactosamine-6-sulfate sulfatase (GALNS), and is characterized by systemic skeletal dysplasia due to excessive storage of keratan sulfate (KS) and chondroitin-6-sulfate in chondrocytes. Although improvements in the activity of daily living and endurance tests have been achieved with enzyme replacement therapy (ERT) with recombinant human GALNS, recovery of bone lesions and bone growth in MPS IVA has not been demonstrated to date. Moreover, no correlation has been described between therapeutic efficacy and urine levels of KS, which accumulates in MPS IVA patients.
Note: The following contents are extract from your paper. The entry will be online only after author check and submit it.
1. Introduction
Mucopolysaccharidosis type IVA (MPS IVA, OMIM #253000) or Morquio A syndrome is an autosomal recessive disease caused by mutations in the
GALNS gene. This molecular defect results in a deficiency in the enzyme N-acetylgalactosamine-6-sulfate sulfatase (GALNS, E.C.3.1.6.4)
[1][2][3][1,2,3], which degrades the specific glycosaminoglycans(GAGs) keratan sulfate (KS) and chondroitin-6-sulfate (C6S)
[4][5][6][7][4,5,6,7]. These GAGs accumulate in multiple tissues, mainly bone, cartilage, heart valves, and cornea, leading to progressive systemic skeletal dysplasia
[8][9][8,9]. Significant non-skeletal manifestations, including respiratory disease, spinal cord compression, cardiac disease, impaired vision, hearing loss, and dental problems, have also been described in MPS IVA patients
[10][11][12][13][10,11,12,13]. MPS IVA is more frequently associated with severe and extensive skeletal manifestations than the other MPS types. Specifically, hypermobility of the joints is a characteristic of MPS IVA that distinguishes this disease from other forms of MPS. Furthermore, cognitive involvement is generally absent in MPS IVA
[14]. Among untreated patients, respiratory failure is the primary cause of death, which typically occurs during the second or third decades of life
[15][16][15,16].
Currently, two therapies for MPS IVA are used in clinical practice: enzyme replacement therapy (ERT) with recombinant human GALNS; and hematopoietic stem cell transplantation (HSCT)
[5][11][5,11]. ERT and HSCT are based on the cross-correction principle, where by lysosomal enzymes are taken up by the cells of deficient recipients and targeted to the lysosomes via the mannose-6-phosphate receptor. However, as described for other lysosomal storage diseases, ERT for MPS IVA suffers from several limitations, including the need for weekly infusions of 4–6 h; rapid clearance due to a short half-life (35 min in human, 2 min in mouse)
[17][18][19][17,18,19]; a high price
[19][20][19,20]; limited penetration of the avascular cartilage; and immunological responses against the infused enzyme
[16][17][21][16,17,21]. Moreover, clinical trials have shown little improvements in terms of bone growth and skeletal dysplasia. There is no definitive therapy that markedly improves bone and cartilage lesions in MPS IVA
[14][18][19][20][14,18,19,20]. Potential biomarkers proposed in recent studies include KS, C6S, and blood levels of collagen II
[22][23][22,23]. Although clinical trials have studied urinary KS as a potential biomarker, it has not been demonstrated that decreases in this parameter correlate with clinical improvement. Urinary KS originates in the kidneys but does not reflect the involvement of bone or other relevant tissues in MPS IVA, and is considered a pharmacokinetic marker but not a surrogate biomarker. The identification of valid biomarkers of bone lesions to evaluate therapeutic efficacy thus remains an unmet need. While bone cartilage samples are the best samples in which to search for candidate biomarkers of MPS IVA, the objective of this study was to assess the validity of candidate plasma biomarkers proposed in previous studies and to search for new biomarkers. To this end, we carried out both quantitative and qualitative proteomic analyses of plasma samples from.
Within rare disease research, proteomics is a fast-growing field. Approaches based on liquid chromatography-tandem mass spectrometry (LC-MS/MS), which are used to search for biomarkers in other human diseases
[24][25][26][27][28][24,25,26,27,28], are key tools used to study normal and affected tissues and body fluids (e.g., plasma) in rare diseases
[29].
Disease states involve alterations in the expression levels, phosphorylation states, and post-transcriptional modifications of proteins. Therefore, proteomics techniques have been applied to the study of normal and pathological conditions to search for biological information that could further our understanding of pathophysiological mechanisms and identify novel disease biomarkers
[26][28][30][26,28,30]. Specific disease biomarkers identified using proteomics techniques could help improve diagnostic and prognostic precision and serve as key tools for the evaluation of treatment outcomes
[24][25][26][27][28][29][30][31][24,25,26,27,28,29,30,31].
2. Qualitative Analysis of Proteins in Plasma Samples
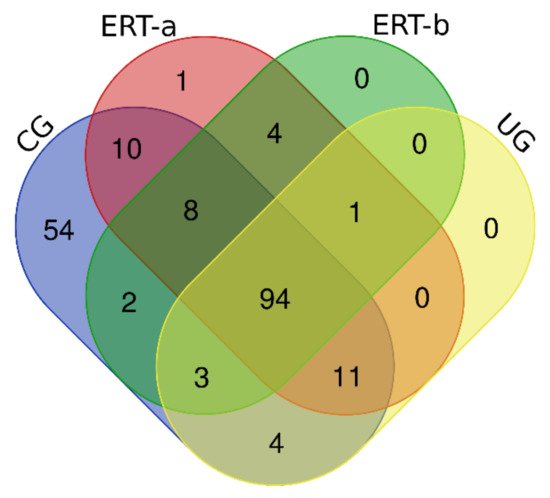
In this study, we identified all proteins in plasma samples using data-dependent acquisition (DDA)-LC-MS/MS. Subsequent analysis was limited to proteins identified with 1% error (i.e., those with a false discovery rate (FDR) < 1). To obtain the most representative proteins per group, we selected proteins identified in at least n-1 samples per group (where n is the number of samples per group). The Venn diagram in
Figure 1 depicts the distribution of proteins in each of the 4 groups, and indicates those that were common to multiple groups.
Figure 1. Venn diagram showing the distribution of proteins identified in the qualitative proteomic analysis across each of the 4 study groups.
Once we determined the proteins characteristic of each group, we performed a functional analysis using the FunRich program. This analysis allows us to characterize the behavior of the proteins identified in each group. Comparison of ERT-a and ERT-b samples revealed a favorable evolution (i.e., values obtained in ERT-a or ERT-b were close to thoseobtained for control samples) for certain proteins. Next, we selected groups of proteins in which alterations are observed in MPS IVA, and analyzed their behavior in each study group. From these, we identified proteins involved in hemostasis, bone regeneration, reorganization of theextracellular matrix and collagen, the immune response, complement system, and oxidative stress.
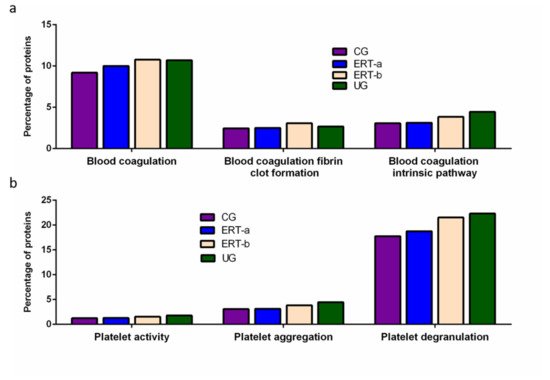
Among proteins implicated in hemostasis (blood coagulation, fibrin clot formation, and blood coagulation intrinsic pathway), we observed that values obtained for ERT-a samples (i.e., those collected 6 days after the preceding enzyme infusion) were closer to those of control samples than to ERT-b samples (
Figure 2a). This result suggests that blood levels of these proteins require several days to stabilize after ERT infusion. A similar effect was observed for proteins implicated in different aspects of hemostatic processes, including platelet activation, platelet aggregation, and platelet degranulation (
Figure 2b).
Figure 2. Functional enrichment analysis using FunRich. Proteins identified in each the different groupswere submitted to molecular functional analysis according to their involvement inhemostasis (a) and platelet function (b). CG, control group; ERT-a, patients sampled before ERT; ERT-b, patients sampled 24 h after ERT; UG, untreated group.
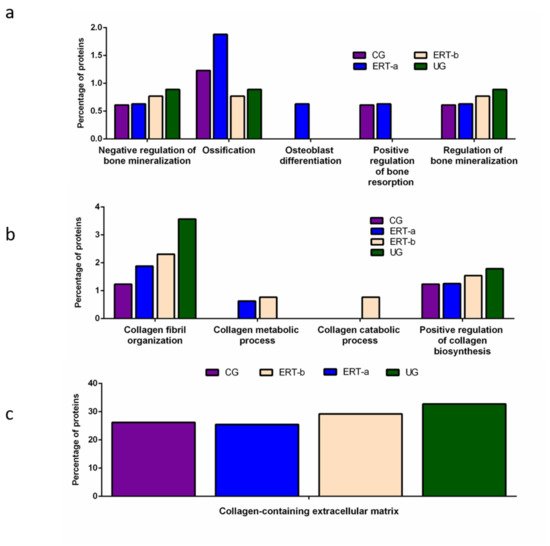
Other proteins identified in the proteomic analysis were implicated in bone regeneration and collagen function. Analysis of the behavior of these proteins showed that ERT had a negative regulatory effect on some (including proteins involved in mineralization, ossification, and osteoblast differentiation) and a positive regulatory effect on others (bone resorption and regulation of bone mineralization) (
Figure 3a). In the case of proteins that were negatively regulated, ERT required more than 24 h to affect protein expression. Conversely, in the case of positively regulated proteins (involved in bone resorption and osteoblast differentiation) plasma levels increased after treatment in the ERT-b group (
Figure 3a).
Figure 3. Functional enrichment analysis using FunRich. Proteins identified in each the different groups were submitted to molecular functional analysis according to their involvement in: (a) processes that occur at the bone level; (b) collagen function (activity/processing/biosynthesis); (c) collagen-containing extracellular matrix. CG, control group; ERT-a, patients sampled before ERT; ERT-b, patients sampled 24 h after ERT; UG, untreated group.
Proteomic analysis of proteins involved in collagen function revealed values close to those of the control group for proteins related to a positive regulation of the collagen biosynthesis (
Figure 4b) in the ERT-a group. Moreover, in the ERT-a study group, we observed decreases in the expression of proteins implicated in collagen biosynthesis and collagen fibril organization. The behavior of proteins involved in metabolic and catabolic processes was unaltered after ERT administration (data not shown).
A search for proteins that interact with collagen in the extracellular matrix identified 5 proteins; P02671, P02751 (fibronectin 1), P02675, P51884 (lumican), and P02679.
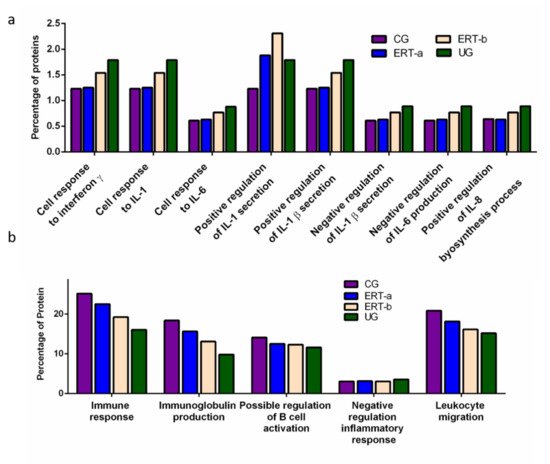
We detected a relatively high number of proteins involved in the immune response. The results of the functional analysis of these proteins are shown in
Figure 4 and
Figure 5.
Figure 4a shows the results of functional enrichment analysis of proteins implicated in inflammation, including proteins related to interleukins (ILs) IL-1, IL-1β, IL-6, IL-8, and to interferon γ (TNF-γ). Proteins were grouped according to their participation in different processes, including the cellular response to interferon γ, the cellular response to IL-1, the cellular response to IL-6, positive regulation of IL-1 secretion, positive regulation of IL-1β secretion, negative regulation of IL-1β secretion, negative regulation of IL-6 production, and positive regulation of IL-8 biosynthesis. In all cases, we observed a reduction in the expression of the proteins of interest24 h after ERT administration (ERT-b), except for proteins involved in positive regulation of IL-1 secretion (no change observed after ERT). In UG we detected 1.79% of proteins related to IL-1, IL-1β, and TNF-γ. This corresponding value in the ERT-a group (1.25%) was closer to that observed in controls (1.23%). In the case of proteins related to IL-6 and IL-8 we detected values of 0.88% in UG,0.63% in ERT-a, and 0.61 in the control group.
Figure 4. Functional enrichment analysis using FunRich. Proteins identified in each the different groups were submitted to molecular functional analysis according to their involvement in the immune response: proteinsrelated tointerleukins (ILs) IL-1, IL-1β, IL-6, IL-8, and interferon γ (a); proteins involved in immunoglobulin production, positive regulation of B-cell activation, negative regulation of the inflammatory response, and leukocyte migration (b).
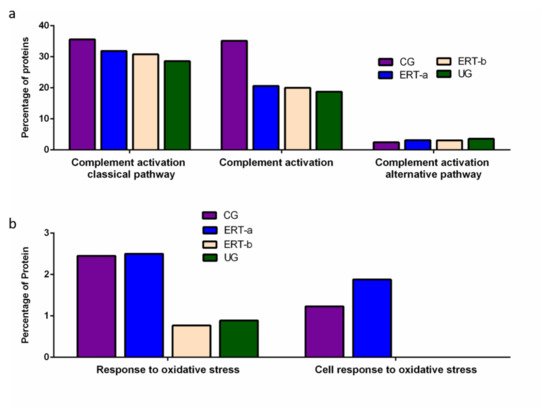
Figure 5. Functional enrichment analysis using FunRich. Proteins identified in each of the different groups were submitted to molecular functional analysis according to their involvement in immune processes: proteins involved in the classical or alternative complement activation pathways (a); proteins involved in the response to oxidative stress (b).
The results of the functional enrichment analysis of proteins involved in biological processes related tothe immune response, immunoglobulin production, positive regulation of B cell activation, negative regulation inflammatory response, and leukocyte migrationare shown in
Figure 4b. In all cases, ERT increased the expression of proteins involved in each of these biological processes, except for negative regulation of the inflammatory response.
Functional enrichment analysis was also performed to identify protein partner expression between groups of proteins related to inflammatory processes (biological processes relating to (i) the complement system, including the classical complement activation pathway, (ii) general complement activation, and (iii) the alternative complement activation pathway). The results (
Figure 5) reveal a positive effect of ERT, although levels of protein expression levels did not reach those observed in the control group (
Figure 5a).
Figure 5b shows the results of the functional enrichment analysis of proteins involved in the oxidative stress response. Treatment (ERT-a) resulted in protein levels similar to those observed in the control group for proteins involved in both complement activation and oxidative stress.
3. SWATH Quantitative Analysisof Proteins in Plasma Samples
Quantitative analysis of proteins using SWATH revealed significant alterations in the expression of multiple proteins in the ERT-a and ERT-b groups relative to the control group (
Table 1).
Table 1. Changes in plasma protein expression detected by SWATH in any of the patient groups (UG, ERT-a, or ERT-b) relative to the control group.
| Group Comparison |
Proteins with Altered Expression* |
Upregulated Proteins |
Downregulated Proteins |
| Protein Code |
Protein Name |
p | -Value |
Fold Change |
| Upregulated in ERT-a |
| P0DJI8 |
SAA1 |
Serum amyloid A-1 protein |
0.0487 |
Only ERT-a |
| Q13790 |
APOF |
Apolipoprotein F |
0.0487 |
Only ERT-a |
| A0A0C4DH68 |
KV224 |
Immunoglobulin kappa variable 2-24 |
| UG vs CG |
14 |
12 |
2 |
| ERT-a vs CG |
8 |
5(2 only in ERT-a) |
1 |
| ERT-b vs CG |
14 |
10(2 only in ERT-b) |
1 |
Quantitative Analysis Using SWATH
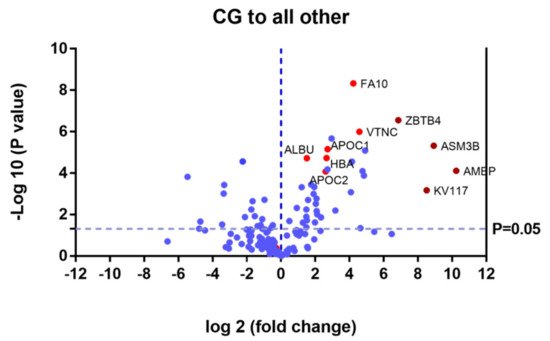
Proteins that were upregulated or down regulated in each group may be relevant in MPS IVA disease. Differences in protein expression in the UG may reveal candidate biomarkers of disease. Proteins upregulated or downregulated in the ERT-a and ERT-b groups can be considered as markers of disease evolution as they were altered before treatment. We identified certain proteins that were downregulated by more than 100 fold, including AMBP, ASM3B, KV117, and ZBTB4 (highlighted in dark red in
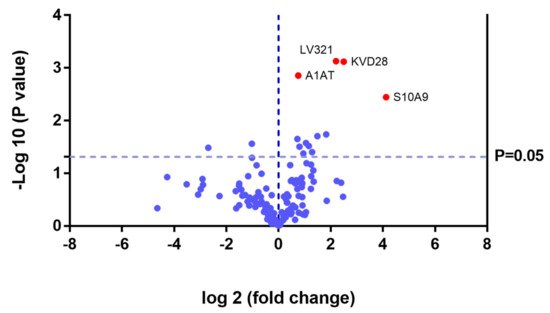
Figure 6 and
Table 2).
Figure 6. Volcano plot showing the results of the SWATH analysis of plasma protein expression. Data are represented as the results obtained for the control group relative to all other groups (UG, ERT-a, and ERT-b). Graph shows the negative base 10 log of the p-value plotted against the base 2 log of the fold change for each protein included in the SWATH analysis. Changes were considered significant at p < 0.05 and fold change >1.5 compared with control group.
Table 2. Changes in plasma protein expression detected in all patient groups (UG, ERT-a, and ERT-b) relative to the control group. Protein expression is considered altered in cases in which p < 0.05 and the fold change >1.5 (upregulated proteins) or <0.6 (downregulated proteins).
| Uniprot Code |
Protein
Code |
Protein Name |
p | -Value |
Fold Change |
| 0.0109 |
| 6.1248 |
| P05156 |
CFAI |
Complement factor I |
0.0065 |
5.2409 |
| A0A075B6I0 |
LV861 |
Immunoglobulin lambda variable 8-61 |
0.0386 |
3.1547 |
| P43251 |
BTD |
Biotinidase |
0.0301 |
2.8996 |
| P04196 |
HRG |
Histidine-rich glycoprotein |
0.0224 |
1.5688 |
| Downregulated in ERT-a |
| P02747 |
C1QC |
Complement C1q subcomponent subunit C |
0.0465 |
0.5069 |
| Uniprot Code |
Protein Code |
Protein Name |
p-Value |
Fold Change |
| Upregulated in ERT-b |
| P60174 |
TPIS |
Triosephosphateisomerase |
0.0487 |
Only ERT-b |
| O00391 |
QSOX1 |
Sulfhydryl oxidase 1 |
0.0487 |
Only ERT-b |
| A0A0C4DH67 |
KV108 |
Immunoglobulin kappa variable 1-8 |
0.0028 |
Only ERT-b |
| P0C0L5 |
CO4B |
Complement C4-B |
0.0029 |
17.9592 |
| O14791 |
APOL1 |
Apolipoprotein L1 |
0.0480 |
2.2700 |
| P20742 |
PZP |
Pregnancyzone protein |
0.0418 |
2.1171 |
| P06396 |
GELS |
Gelsolin |
0.0080 |
2.0649 |
| P00751 |
CFAB |
Complement factor B |
0.0184 |
2.0058 |
| P19823 |
ITIH2 |
Inter-alpha-trypsin inhibitor heavy chain H2 |
0.0093 |
1.9167 |
| P01023 |
A2MG |
Alpha-2-macroglobulin |
0.0093 |
1.8574 |
| P08697 |
A2AP |
Alpha-2-antiplasmin |
0.0298 |
1.8165 |
| Q14624 |
ITIH4 |
Inter-alpha-trypsin inhibitor heavy chain H4 |
0.0389 |
1.7428 |
| P05546 |
HEP2 |
Heparin cofactor 2 |
0.0421 |
1.6111 |
| Downregulated in ERT-b |
| P02766 |
TTHY |
Transthyretin |
0.0224 |
0.2358 |
| Downregulated in UG, ERT-a, and ERT-b |
| P01860 |
IGHG3 |
Immunoglobulin heavy constant gamma 3 |
3.30 × 10 | −5 |
Only CG |
| P02741 |
CRP |
C-reactive protein |
8.93 × 10 | −3 |
Only CG |
| P02760 |
AMBP |
Protein AMBP |
LV321 |
Immunoglobulin lambda variable 3-217.75 × 10 | −5 |
0.00070.0008 |
| 4.6098 |
Q92485 |
ASM3B |
Acid sphingomyelinase-like phosphodiesterase 3b |
4.80 × 10 | −6 |
0.0021 |
| P01594 |
KV133 |
Immunoglobulin kappa variable 1-33 |
0.0182 |
3.5490 |
P01599 |
KV117 |
Immunoglobulin kappa variable 1–17 |
6.69 × 10 | −4 |
0.0027 |
| P02652 |
APOA2 |
Apolipoprotein A-II |
0.0197 |
2.8151 |
Q9P1Z0 |
ZBTB4 |
Zinc finger and BTB domain-containing protein 4 |
2.81 × 10 | −7 |
0.0086 |
| P01591 |
IGJ |
Immunoglobulin J chain |
0.0395 |
2.4479 |
P01780 |
HV307 |
Immunoglobulin heavy variable 3–7 |
8.23 × 10 | −6 |
0.0333 |
| P63261 |
ACTG |
Actin, cytoplasmic 2 |
0.0304 |
2.2374 |
P22352 |
GPX3 |
Glutathione peroxidase 3 |
1.31 × 10 |
| P00734 | −4 |
0.0349 |
| THRB |
Prothrombin |
0.0265 |
2.0770 |
P35542 |
SAA4 |
| B9A064 | Serum amyloid A-4 protein |
8.01 × 10 | −5 |
0.0368 |
| IGLL5 |
Immunoglobulin lambda-like polypeptide 5 |
0.0420 |
1.9341 |
P01766 |
HV313 |
Immunoglobulin heavy variable 3–13 |
4.50 × 10 | −2 |
0.0402 |
| P01714 |
LV319 |
Immunoglobulin lambda variable 3-19 |
0.0313 |
1.7496 |
P04004 |
VTNC |
Vitronectin |
1.00 × 10 | −6 |
0.0417 |
| P00742 |
FA10 |
Coagulation factor X |
4.71 × 10 | −9 |
0.0535 |
| P02042 |
HBD |
Hemoglobin subunit delta |
2.79 × 10 | −5 |
0.0565 |
| A0A075B6J9 |
LV218 |
Immunoglobulin lambda variable 2–18 |
8.30 × 10 | −4 |
0.0588 |
| P02753 |
RET4 |
Retinol-binding protein 4 |
6.31 × 10 | −3 |
0.1103 |
| P06312 |
KV401 |
Immunoglobulin kappa variable 4–1 |
2.12 × 10 | −6 |
0.1292 |
| P02654 |
APOC1 |
Apolipoprotein C-I |
7.01 × 10 | −6 |
0.1515 |
| P02765 |
FETUA |
Alpha-2-HS-glycoprotein |
6.60 × 10 | −5 |
0.1527 |
| P69905 |
HBA |
Hemoglobin subunit alpha |
1.86 × 10 | −5 |
0.1585 |
| P02655 |
APOC2 |
Apolipoprotein C-II |
8.27 × 10 | −5 |
0.1642 |
| P00915 |
CAH1 |
Carbonicanhydrase 1 |
1.37 × 10 | −2 |
0.1984 |
| P02751 |
FINC |
Fibronectin |
9.79 × 10 | −3 |
0.2304 |
| A0A0B4J1Y8 |
LV949 |
Immunoglobulin lambda variable 9–49 |
6.70 × 10 | −3 |
0.2353 |
| P02746 |
C1QB |
Complement C1q subcomponent subunit B |
1.68 × 10 | −3 |
0.2381 |
| P00738 |
HPT |
Haptoglobin |
3.00 × 10 | −3 |
0.2445 |
| P01857 |
IGHG1 |
Immunoglobulin heavy constant gamma 1 |
2.37 × 10 | −2 |
0.2519 |
| P01834 |
IGKC |
Immunoglobulin kappa constant |
4.67 × 10 | −4 |
0.2591 |
| P68871 |
HBB |
Hemoglobin subunit beta |
1.01 × 10 | −3 |
0.3597 |
| P02763 |
A1AG1 |
Alpha-1-acid glycoprotein 1 |
2.43 × 10 | −2 |
0.4115 |
Of the proteins that were the upregulated and downregulated in the UG, ERT-a, and ERT-b groups relative to controls, 31% were related to immune system function. It is important to point out that most of the proteins for which changes in expression were observed in the study groups were down regulated. In addition to upregulated protein in the UG, ERT-a, and ERT-b groups relative to CG, we alsodetected2 immunoglobulins (KV320 and LV321) that were not present in the CG.
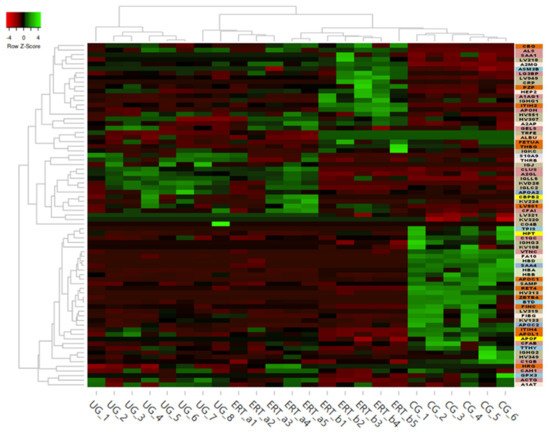
Some of these downregulated proteins (highlighted in red in
Table 2 and in the heatmap in
Figure 7) may be of particular importance in MPS IVA.
Figure 7. Heatmap depicting the expression profiles of different proteins (also shown in Table 2, Table 3 and Table 4) as determined by SWATH quantitative analysis. The relative abundance of each protein is reflected by the colors in the heatmap, based on the z-score of the protein’s normalized peak area. The dendrogram represents the biological replicates of the UG, ERT-a, ERT-b, and CG groups. Proteins, listed in the sidebar on the right, are color coded according to their function, as follows: apolipoprotein-related proteins, dark green; blood coagulation, purple; calcium binding, dark orange; carrier proteins, light green; cytoskeletal proteins, light pink; immune system, grey; metabolic processes, yellow; metabolic interconversion, light blue; other functions, white; protein binding, pink; transport, light grey.
Table 3. Changes in protein expression in the untreated group relative to all other groups. Protein expression is considered altered in cases in which p < 0.05 and the fold change >1.5 (upregulated proteins) or <0.6 (downregulated proteins).
| Uniprot Code |
Protein Code |
Protein Name |
p | -Value |
Fold Change |
| Upregulated in Untreated Group |
| P06702 |
S10A9 |
Protein S100-A9 |
0.0036 |
17.4468 |
| P01615 |
KVD28 |
Immunoglobulin kappa variable 2D-28 |
0.0008 |
| 0.2681 |
| P01859 |
| IGHG2 |
| Immunoglobulin heavy constant gamma 2 |
| 3.60 × 10 |
| −4 |
| 0.2959 |
| P29622 |
| KAIN |
| Kallistatin |
| 1.99 × 10 |
| −3 |
| 0.3344 |
| P02743 |
SAMP |
Serum amyloid P-component |
1.91 × 10 | −2 |
0.3509 |
| P02768 |
ALBU |
| P01009 |
A1AT |
Alpha-1-antitrypsin |
0.0014 |
1.6875 |
| P02747 |
C1QC |
Complement C1q subcomponent subunit C |
0.0223 |
1.6522 |
| Downregulated in Untreated Group |
| P02746 |
C1QB |
Complement C1q subcomponent subunit B |
0.0329 |
0.1549 |
Serum albumin |
| P08697 |
A2AP |
Alpha-2-antiplasmin |
0.0275 |
0.4938 |
1.92 × 10 | −5 |
0.3509 |
| P02787 |
TRFE |
Serotransferrin |
4.11 × 10 | −2 |
0.3571 |
| P02749 |
APOH |
Beta-2-glycoprotein 1 |
1.26 × 10 | −2 |
0.3584 |
| P02679 |
FIBG |
Fibrinogen gamma chain |
5.71 × 10 | −3 |
P05543 |
THBG |
Thyroxine-binding globulin |
4.82 × 10 | −4 |
0.4348 |
| Upregulated in UG, ERT-a, and ERT-b |
| P01619 |
KV320 |
Immunoglobulin kappa variable 3–20 |
0.0005 |
Not found CG |
| P80748 |
LV321 |
Immunoglobulin lambda variable 3-21 |
0.0179 |
Not found CG |
| B9A064 |
IGLL5 |
Immunoglobulin lambda-like polypeptide 5 |
0.0002 |
44.0529 |
| P01615 |
KVD28 |
Immunoglobulin kappa variable 2D–28 |
0.0474 |
27.4725 |
| P0DOY2 |
IGLC2 |
Immunoglobulin lambda constant 2 |
0.0217 |
26.1780 |
| P35858 |
ALS |
Insulin-like growth factor-binding protein complex acid labile subunit |
0.0299 |
10.8460 |
| P10909 |
CLUS |
Clusterin |
0.0010 |
10.1523 |
| P02750 |
A2GL |
Leucine-rich alpha-2-glycoprotein |
0.0004 |
9.9800 |
| P01023 |
A2MG |
Alpha-2-macroglobulin |
0.0000 |
4.7170 |
| P00734 |
THRB |
Prothrombin |
0.0132 |
4.3178 |
| P06396 |
GELS |
0.0057 |
3.3223 |
| 5.6619 |
Gelsolin |
P19823 |
ITIH2 |
Inter-alpha-trypsin inhibitor heavy chain H2 |
0.0023 |
3.1536 |
| Q96IY4 |
CBPB2 |
Carboxypeptidase B2 |
0.0121 |
2.8977 |
| Q08380 |
LG3BP |
Galectin-3-binding protein |
0.0361 |
2.5880 |
| P08185 |
| P80748 |
CBG |
Corticosteroid-binding globulin |
0.0325 |
2.2763 |
| A0A0A0MS15 |
HV349 |
Immunoglobulin heavy variable 3–49 |
0.0482 |
2.1418 |
| A0A0C4DH38 |
HV551 |
Immunoglobulin heavy variable 5–51 |
0.0165 |
2.1345 |
Table 4. Changes in protein expression in the ERT-a or ERT-b groups relative to all other groups. Protein expression is considered altered in cases in which p < 0.05 and the fold change >1.5 (upregulated proteins) or <0.6 (downregulated proteins).
In order to shown the results in a better way, we represent a heatmap using the proteins up and down regulated shown in
Table 2. Moreover, the proteins were classified into different functions and were highline in different colors. Among these proteins, those shown in
Figure 8 and
Figure 9 stand out.
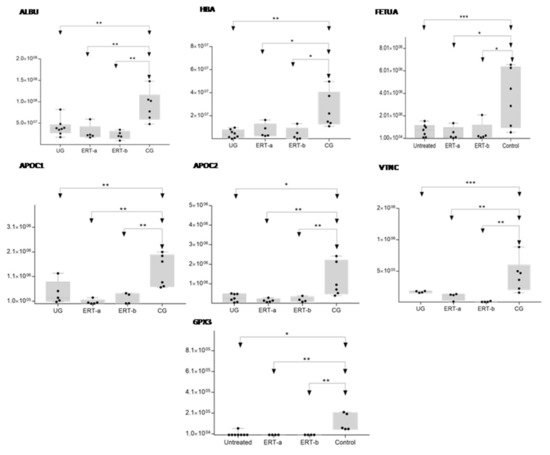
Figure 8. Box plot depicting expression levels of the6 most relevant plasma proteins (ALBU, HBA, FETUA, APOC1, APOC2, VTNC, and GPX3) for which downregulation was observed in the UG and ERT-a and ERT-b groups relative to the control group (CG). Each data point represents the median protein expression value obtained in an individual sample. The line inside the box represents the median of all values obtained. The upper and lower limits of the box represent the first and third quartiles. Whiskers represent the minimum and maximum values within 1.5 times the interquartile range. Any data points not included between the whiskers are considered outliers. * p < 0.05; ** p < 0.01; *** p < 0.001.
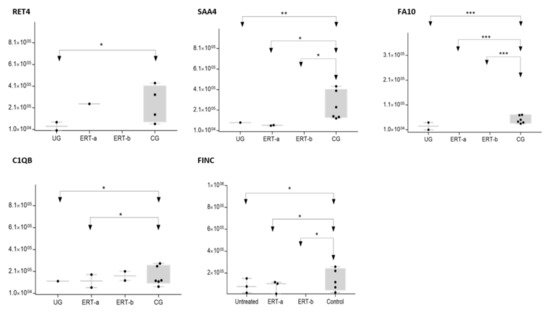
Figure 9. Box plot depicting expression levels of the 5 most relevant plasma proteins (RET4, SAA4, FA10, FINC, and C1QB) for which very low expression was observed in the UG and ERT-a and ERT-b groups relative to the control group (CG). Each data point represents the median value obtained in an individual sample. The line inside the box represents the median of all values obtained. The upper and lower limits of the box represent the first and third quartiles. Whiskers represent the minimum and maximum values within 1.5 times the interquartile range. Any data points not included between the whiskers are considered outliers. * p < 0.05; ** p < 0.01; *** p < 0.001.
The SWATH analysis identified proteins that were downregulated in the UG and the ERT-a and b groups relative to controls, or were absent entirely. These included FA10 and SAA4, which were absent in all patient groups, and RET4 and C1QB, which were absent in UG and in UG and ERT-a, respectively (see
Figure 9 and
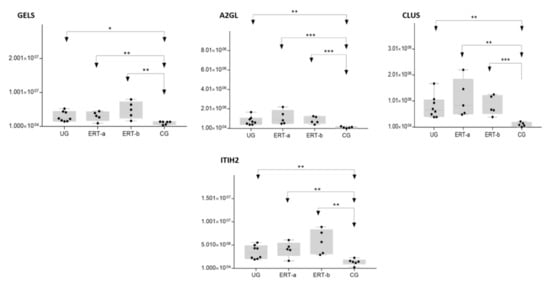
Figure 10).
Figure 10. Box plot depictingthe4 plasma proteins (A2GL, CLUS, GELS, ITIH2) with the highest expression levels in the UG and ERT-a and ERT-b groups relative to the control group (CG). Each data point represents the median value obtained in an individual sample. The line inside the box represents the median of all values obtained. The upper and lower limits of the box represent the first and third quartiles. Whiskers represent the minimum and maximum values within 1.5 times the interquartile range. Any data points not included between the whiskers are considered outliers. * p < 0.05; ** p < 0.01; *** p < 0.001.
In the UG group, we detected changes in expression in 4 proteins with respect to the 3 other groups (
Figure 11 and
Table 3).
Figure 11. Volcano plot showing the results of the SWATH analysis of plasma protein expression. Data are represented as the results obtained for the untreated group (UG) relative to all other groups (CG, ERT-a, and ERT-b). Graph shows the negative base 10 log of the p-value plotted against the base 2 log of the fold change for each protein included in the SWATH analysis. Changes were considered significant at p < 0.05 and fold change >1.5.
Because these proteins were likely dysregulated as a consequence of the disease, they may include potential disease biomarkers that are either up-or down regulated in MPS IVA.
Theproteinsfor which changes in expression were detected in the UG included severalimmunoglobulins. This is unsurprising, given the important inflammatory component of MPS. Moreover, proteins that were dysregulated in this group included some previously proposed as biomarkers of MPS (e.g., A1AT[alpha 1 antitrypsin])
[32][33].We also observed dysregulation of proteins involved in inflammation (S10A9), binding to collagen (C1QC), and prothrombin (THRB), a thyroid hormone receptor that mediates the biological activities of thyroid hormone
[33][34]. Proteins that were downregulated in the UG included C1QB (in line with previously reports,
Figure 8) and the serine protease inhibitor A2AP (
Figure 9 and
Table 4).
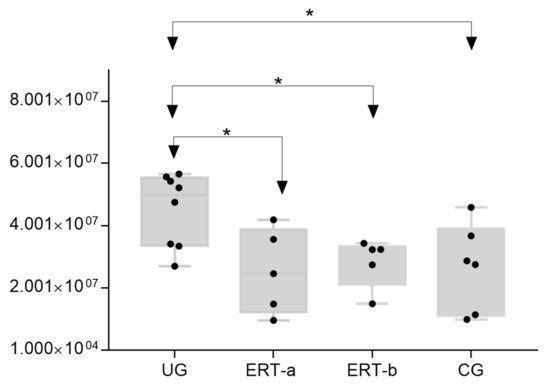
The most important dysregulated protein identified in this analysis was A1AT. Analysis of A1AT levels in individuals in each of the different groups (
Figure 12) revealed significant upregulation in the UG compared with each of the other groups. A1AT levels in the ERT-a and ERT-b groups were comparable to those observed in controls. This protein may constitute not only a biomarker of MPSIVA, but also an indicator of disease progression, potentially providing a better means of monitoring treatment responses in MPS IVA.
Figure 12. Box plot depicting ATA1 levels in each of the study groups. Each data point represents the median value obtained in an individual sample. The line inside the box represents the median of all values obtained. The upper and lower limits of the box represent the first and third quartiles. Whiskers represent the minimum and maximum values within 1.5 times the interquartile range. Any data points not included between the whiskers are considered outliers. * p < 0.05.
While treatment resulted in changes in the expression of proteins in both the ERT-a and ERT-b groups (Table 4), none of these proteins were common to both groups.