2. Microbial Transformation of Licochalcone A and Xanthohumol by M. hiemalis
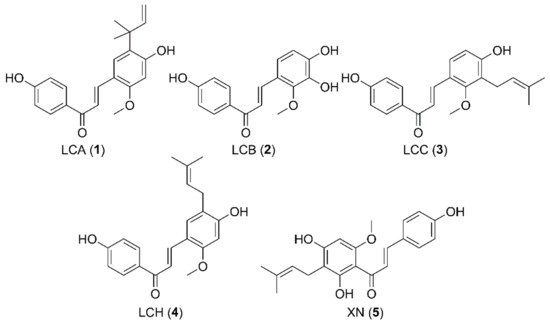
During our previous study, it was observed that licochalcones B, C, H could be
O-glucosylated by using the fungus
M. hiemalis [20][27]. Here, the same process was performed with LCA and XN, which led to the isolation of a new compound licochalcone A 4-
O-β-D-glucopyranoside (
6) together with a known compound xanthohumol 4′-
O-β-D-glucopyranoside
[21][28]. Yin and colleagues discovered a phenolic glycosyltransferase MhGT1 from
M. hiemalis and applied the enzymatic approach to obtain a series of glycosylated phenolic compounds
[22][29]. Likewise, the
O-glucosylation process observed here was speculated to be catalyzed by the enzyme glycosyltransferase formed by
M. hiemalis.
Compound
6 was isolated as an orange amorphous powder. HRESIMS of
6 exhibited a quasi-molecular ion at m/z 523.1943 [M+Na]
+ (calcd. for C27H32O9Na, 523.1944), suggesting the molecular formula of
6 as C27H32O9, which was one glucose unit higher than that of
1. The presence of sugar moiety was further confirmed by comparison of its NMR spectra with those of
1, which showed an anomeric proton signal at δH 5.01 (1H, d, J = 7.0 Hz) in
1H-NMR spectrum and a hexose carbon signals at δC (100.5, 73.8, 77.8, 70.7, 78, and 61.4) in
13C-NMR. The significant downfield-shifted proton signal of H-3 in ring B indicated that the glucose moiety was attached to 4-OH. HMBC correlation from the anomeric proton signal at δH 5.01 (H-1′′′) to the carbon signal at δC 159.4 (C-4) confirmed the assignment of glycosylation at C-4 (
Figure 2). The resonances of the glucose moiety were assigned by HSQC and HMBC experiments (See
Supplementary Materials). TLC comparison with the authentic sample after acid hydrolysis of
6 led to the elucidation of the glucose moiety to be d-form
[21][23][28,30]. The aglycone part of the
1H- and
13C-NMR spectra of
6 revealed two sets of signals in the integral ratio of around 1:1.3. Based on the two pairs of H-α and H-β proton signals at δH 7.67 (1H, d, J = 15.7 Hz) and 7.92 (1H, d, J = 15.7 Hz), together with δH 6.44 (1H, d, J = 12.8 Hz) and 7.03 (1H, d, J = 12.8 Hz),
6 was clearly assigned as a mixture of trans- and cis-isomers. Based on the above data and extensive 2D NMR experiments, structure of the compound
6 was assigned as licochalcone A 4-
O-β-D-glucopyranoside.
Figure 2. Microbial transformation of 1 by M. hiemalis. Selected HMBC correlations (1H→13C) of metabolite 6 are indicated by arrows.
3. Microbial Transformation of Licochalcones A, B, C, H, and Xanthohumol by A. coerulea
Screening of licochalcones and XN (
1–
5) with several microorganisms showed that only
A. coerulea was able to produce the highly polar metabolites, more polar than the metabolites transformed by
M. hiemalis. During the screening procedures, it was also observed that by using more sulfate-containing media, the yield of sulfate-conjugated metabolites could be increased. Thus, instead of using the original incubation medium suggested by KCTC, the scale-up fermentation process was performed by using a modified Czapek Dox media (dextrose 10 g/L, sodium nitrate 2 g/L, dipotassium phosphate 1 g/L, magnesium sulfate 0.5 g/L, potassium chloride 0.5 g/L, ferrous sulfate 0.02 g/L). Isolation of the metabolites from large-scale fermentations was processed successfully by using EtOAc as extraction solvent.
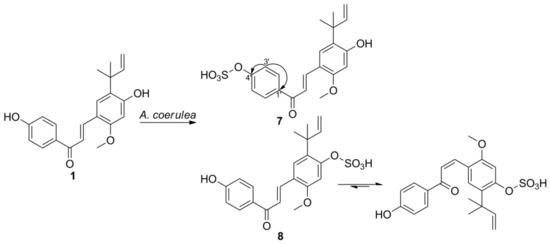
Metabolite
7 was isolated as a yellow amorphous powder. The UV spectrum showed maximum absorption bands at 266 and 387 nm, similar to those of substrate
1. The HRESIMS spectra of
7 displayed a molecular ion peak at
m/z 417.1024 [M-H]
− and a fragment ion peak at
m/z 337.1449 [M-H-80]
−, suggesting the presence of a sulfate group. In addition, the isotopic mass peak at
m/z 419.1087 [M-H+2]
− indicated the presence of a sulfur atom in the compound. The IR spectrum of
7 showed the presence of two strong bands corresponding to the S=O (1251 cm
−1) and C-O-S (1050 cm
−1), supporting the presence of a sulfate group
[24][31]. The presence of the sulfate group was further supported by the formation of white precipitate after treating the aqueous layer of acid-hydrolyzed
7 with BaCl2
[24][31]. Comparison of the
1H- and
13C-NMR spectroscopic data of
7 with
1 revealed the resonance signals being almost identical in both compounds, except for the downfield shift of H-3′/5′, C-1′, C-3′/5′ (0.44, 4.0, and 4.7 ppm, respectively) and the upfield shift of C-4′ (4.4 ppm), implying that the sulfate moiety was conjugated with 4′-OH. These shifts were consistent with naringenin 4′-sulfate, a transformed product of naringenin, because the carbon directly attached to the sulfate ester and the carbons in the meta-position are upfield-shifted, and the protons and carbons in ortho- and para-positions to the sulfate group are downfield-shifted
[18][25][18,32]. The sulfate position at C-4′ was further confirmed by HMBC correlations of H-3′/5′ with C-1′ and C-4′ (
Figure 3). Therefore, the structure of
7 was identified as licochalcone A 4′-sulfate.
Figure 3. Microbial transformation of 1 by A. coerulea. Selected HMBC correlations (1H→13C) of metabolite 7 are indicated by arrows.
Metabolite
8 was obtained as a mixture with
7. In the
1H-NMR spectrum of
8, the significant downfield-shifted signal at δH 7.51 (H-3) was observed, indicating that the sulfate group was attached to 4-OH. Two sets of proton resonance signals were observed for
8, which is similar to the glucosylated metabolite
6. Thus, the structure of
8 was identified as
trans- and
cis-isomers of licochalcone A 4-sulfate.
Metabolite
9 was obtained as a yellow solid. The HRESIMS spectra of
9 exhibited a molecular ion peak at
m/z 365.0336 [M-H]
− and a fragment ion peak at
m/z 285.0767 [M-H-80]
−, suggesting the presence of a sulfate group. The
1H-NMR data of
9 were similar to
2, except for the H-6 signal, which was downfield-shifted by 0.33 ppm. Comparison of
13C-NMR data of
9 and substrate
2 showed that the C-3 signal was upfield-shifted by 5.7 ppm, and the signals of C-2, C-4, and C-6 were downfield-shifted by 4.1, 3.2, and 5.0 ppm, respectively
[26][33]. All of these suggested that the sulfate group was attached to 3-OH, and this was further confirmed by the HMBC correlations between H-5 and C-1/3 (
Figure 4). Thus, the structure of
9 was identified as licochalcone B 3-sulfate.
Figure 4. Microbial transformation of 2 by A. coerulea. Selected HMBC correlations (1H→13C) of metabolites 9 and 10 are indicated by arrows.
Metabolite
10 was obtained as a mixture with
9. In the
1H-NMR spectrum of
10, the significant downfield-shifted signal at δH 7.22 (H-5) was observed, indicating that the sulfate group was attached to 4-OH. This was supported by the deshielding of C-3 and C-5 carbons, which are ortho to the sulfate site, compared to those of substrate
2 in the
13C NMR of
10 by 3.0 and 5.2 ppm, respectively. Furthermore, the para carbon at C-1 in
10 was deshielded by 4.0 ppm, while the
ipso carbon at C-4 position was shielded by 7.7 ppm
[26][33]. Based on the above analysis, the structure of
10 was identified as licochalcone B 4-sulfate. The resonances of
10 were completely assigned by HSQC and HMBC spectra (See
Supplementary Materials).
Metabolite
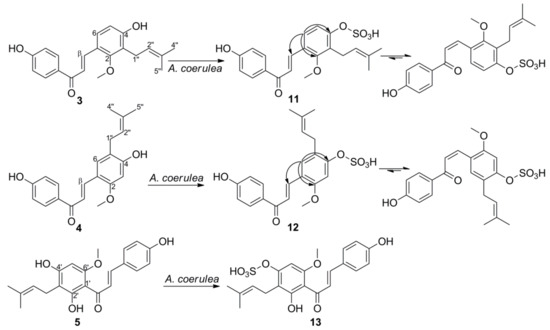
11 was obtained as a yellow solid. The HRESIMS spectra of
11 exhibited a molecular ion peak at
m/z 417.1010 [M-H]
− and a fragment ion peak at
m/z 337.1438 [M-H-80]
−, suggesting the presence of a sulfate group. Two sets of signals in the integral ratio of around 1:1.1 were observed in the
1H- and
13C-NMR spectra of
11. It was assigned as a mixture of trans- and cis-isomers according to the two pairs of H-α and H-β proton signals at δH 7.73 (1H, d, J = 15.9 Hz) and 8.01 (1H, d, J = 15.9 Hz), together with δH 6.65 (1H, d, J = 12.9 Hz) and 7.10 (1H, d, J = 12.9 Hz). Comparison of the
1H-NMR spectrum of LCC sulfate
11 with the parent compound
3 clearly showed a strong difference in the chemical shift for H-5 in ring B, whereas the chemical shifts of protons in ring A were only slightly changed, suggesting that the sulfate moiety was attached to 4-OH. This was supported by the significant upfield-shifted signal of C-4 and downfield-shifted signals of C-1, C-3, and C-5 in the
13C-NMR spectra of
11 compared with those of
3 [26][33]. The HMBC correlations between H-6 and C-4, C-2 further confirmed the attachment at C4-OH (
Figure 5). Thus, the structure of
11 was identified as licochalcone C 4-sulfate.
Figure 5. Microbial transformation of 3–5 by A. coerulea. Selected HMBC correlations (1H→13C) of metabolites 11 and 12 are indicated by arrows.
Metabolite
12 was obtained as a yellow solid. The HRESIMS spectra of
12 exhibited a molecular ion peak at
m/z 417.0974 [M-H]
− and a fragment ion peak at
m/z 96.9881, suggesting the presence of a sulfate group. Two sets of signals in the integral ratio of around 1:1.2 were observed in the
1H- and
13C-NMR spectra of
12. It was assigned as a mixture of
trans- and
cis-isomers, according to the two pairs of H-α and H-β proton signals at δH 7.68 (1H, d, J = 15.8 Hz) and 7.98 (1H, d, J = 15.8 Hz), together with δH 6.43 (1H, d, J = 12.8 Hz) and 7.12 (1H, d, J = 12.8 Hz). Comparison of the
1H-NMR spectrum of LCH sulfate
12 with the parent compound
4 clearly showed a strong difference in the chemical shift for H-3 in ring B, whereas the chemical shifts of protons in ring A were only slightly changed, suggesting that the sulfate moiety was attached to 4-OH. This was supported by the significant upfield-shifted signal of C-4 and downfield-shifted signals of C-1, C-3, and C-5 in the
13C-NMR spectra of
12 compared with those of
4 [27][34]. Thus, the structure of
12 was identified as licochalcone H 4-sulfate. The resonances of
12 were completely assigned by HSQC and HMBC spectra (See
Supplementary Materials).
Metabolite
13 was isolated as a yellow amorphous powder. The HRESIMS spectra of
13 displayed a molecular ion peak at
m/z 433.1092 [M-H]
− and a fragment ion peak at
m/z 353.1355 [M-H-80]
−, suggesting the presence of a sulfate group. Comparison of the
1H- and
13C-NMR spectroscopic data of
13 with
5 indicated almost identical resonances for both compounds, except for the downfield-shift of H-5′, C-1′, C-3′, C-5′ (0.88, 3.2, 6.0, and 4.7 ppm, respectively) and the upfield-shift of C-4′ (5.8 ppm), implying that the sulfate moiety was conjugated with 4′-OH
[28][35]. Therefore, the structure of
13 was identified as xanthohumol 4′-sulfate.
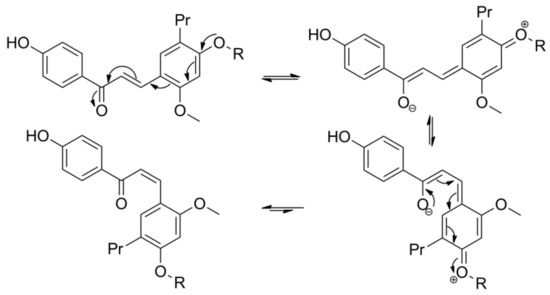
It has been reported that chalcones can undergo trans to cis transformation in solution when light exposure is available. The presence of a free hydroxyl group at the C-4 position of chalcones inhibits photoisomerization between the
trans- and
cis-isomers, as the hydroxyl group at C-4 position enables keto-enol tautomerization and free rotation around the α,β-bond, which allows the rapid conversion of cis chalcones to the stable trans-isomers
[4]. The electron-donating group at C-4 position is expected to weaken the α,β-double bond of chalcones through electron-delocalization effects (
Figure 6), thus the electron-withdrawing effects carried out by the glucose and sulfate moieties of
6,
8,
11, and
12 may quench the electron-donating capacity of the
O-atom at C-4
[29][36]. As a result, glucosylation and sulfation of C4-OH raise the barrier and make the cis-trans chalcone isomerization a slow kinetically distinct process
[29][36]. As demonstrated with the isolated metabolites
6,
11, and
12, the ratio of cis- to trans-isomers was found to be >1 in the NMR solvent, suggesting that the cis isomer produced here is structurally stable under the observed conditions
[30][37]. Such observations are quite remarkable in this case as it is commonly known that
trans chalcones are more stable than their
cis-isomers.
Figure 6. The proposed mechanism of trans-cis isomerization.
The conjugation reactions are widely known as major metabolic pathways for the detoxification of xenobiotic compounds
[15]. The conjugated derivatives are more polar and water-soluble and therefore more easily excreted from the body through urine or feces
[14][31][14,38]. However, an increasing amount of evidence suggests that detoxification is not the only role of sulfation in the organisms. Sulfation might change the biological activities of numerous compounds, and some of the sulfated compounds work therapeutically against cancer, diabetes, and various metabolic diseases
[18][32][18,39]. A demonstration of parallelism between mammalian and microbial systems, conjugation reaction is of considerable importance for the drug metabolism investigations. However, sulfation in microbial systems is rare and reports on this topic are limited. So far, in addition to the list of microorganisms reported by Khan
[33][34][35][36][37][22,23,24,25,26], several fungi including
Absidia coerulea [38][40],
Colletotrichum gloeosporioides [19],
Cunninghamella elegans [25][32],
Gliocladium deliquescens [39][41],
Mucor hiemalis [40][42],
Mucor sp.
[41][43],
Neosartorya spathulata [19],
Streptomyces fulvissimus,
Syncephalastrum racemosum [42][21], and
Trichothecium roseum [43][44] were reported to perform sulfation of some phenolic compounds.
Unlike the complicated sulfation procedure of 8-prenylnaringein, which requires a two-step process with the use of a phosphate buffer
[42][21], we obtained the sulfated metabolites of licochalcones and xanthohumol (
7–
13) by directly using the cultures of
A. coerulea. The metabolite
7 was previously identified as a phase II sulfate conjugate of LCA during the metabolism studies using human hepatocytes
[5]. Results obtained from this study showed that
A. coerulea is capable of sulfation of chalcones and exhibits parallels between microbial and mammalian metabolism not only in phase I but also in phase II metabolism
[42][24][21,31]. It is widely known that the phase II sulfation reactions are mediated by the enzyme sulfotransferases, which catalyze the transfer of sulfonate group from the active sulfate to the substrates containing hydroxyl groups
[44][45]. Thus, the sulfate metabolites of licochalcones and xanthohumol were supposed to be produced by the enzyme sulfotransferase from
A. coeralea.
To demonstrate the biological activity of compounds
7,
13 and their aglycones (
1,
5), the cytotoxic activities against three different human cancer cell lines were evaluated by using MTT assay (
Table 1). Although, as expected, the sulfated metabolites were less active than their aglycones, they still exhibited moderate cytotoxic activities. The glucosylated metabolites displayed weak cytotoxic activity with IC50 > 100 μM. From the results obtained (
Table 1 and
Table S1), it was observed that all of the test compounds, except LCC, exhibited higher cytotoxic activities against A375P cells than MCF-7 and A549 cells. LCC showed stronger activity against MCF-7 cells than A549 cells, which was supported by the result reported by Zheng and colleagues
[45][46]. Zheng and colleagues observed that LCB (
2) exhibited weak cytotoxic activity against MCF-7 cells with IC50 > 80 μM after 24 and 48 h treatment
[46][47], which was similar to our result (Supporting
Table S1). All the compounds tested displayed much stronger cytotoxic activities than LCB, indicating that the prenyl group plays a significant role in the cytotoxic activity of these compounds against the tested cancer cell lines. However, Shim and colleagues have reported that LCB exhibited moderate activities against A375 and A431 skin cancer cells (IC50 13.7 and 19.1 μM, respectively)
[47][48], and showed stronger cytotoxic activity against HSC4 oral squamous cell carcinoma cells (IC50 13 μM) than LCA (IC50 20.42 μM), LCC (IC50 27.1 μM), and LCH (IC50 14.4 μM) after 48 h treatment
[48][49][50][51][49,50,51,52]. Though LCA and XN exhibited good activity in most cases, they were found to show low cytotoxic and apoptotic activity against LNCaP prostate cancer cells
[52][53]. Thus, the cytotoxic activity of compounds against different types of cancer cell lines should be evaluated on a case-by-case basis.
Table 1. Cytotoxic activities of compounds against cancer cell lines.
| Compound |
Cell Lines (IC50, μM) |
| A375P |
MCF-7 |
A549 |
| 1 |
12.86 ± 3.42 |
19.16 ± 0.65 |
18.14 ± 1.26 |
| 5 |
11.02 ± 2.09 |
23.11 ± 1.36 |
26.93 ± 1.56 |
| 7 |
27.35 ± 1.44 |
30.85 ± 4.58 |
43.07 ± 1.63 |
| 13 |
41.04 ± 1.61 |
81.27 ± 3.05 |
99.40 ± 1.99 |
| DZ | 1 |
9.86 ± 0.57 |
5.12 ± 0.44 |
4.01 ± 0.78 |
1 Used as positive control.


