Metformin is the first-line pharmacotherapy for type 2 diabetes mellitus (T2D). Metformin exerts its glucose-lowering effect primarily through decreasing hepatic glucose production (HGP). However, the precise molecular mechanisms of metformin remain unclear due to supra-pharmacological concentration of metformin used in the study.
- metformin
- salicylate
- Foxo1-S273 phosphorylation
- Glucose homeostasis
- type 2 diabetes
1. Introduction
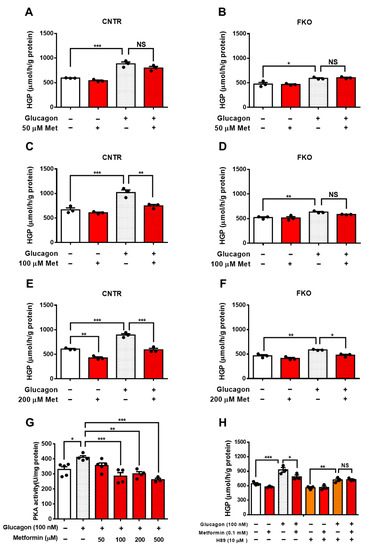
2. Metformin Suppresses Glucagon-Induced HGP through PKA-Foxo1 Pathway in Hepatocytes
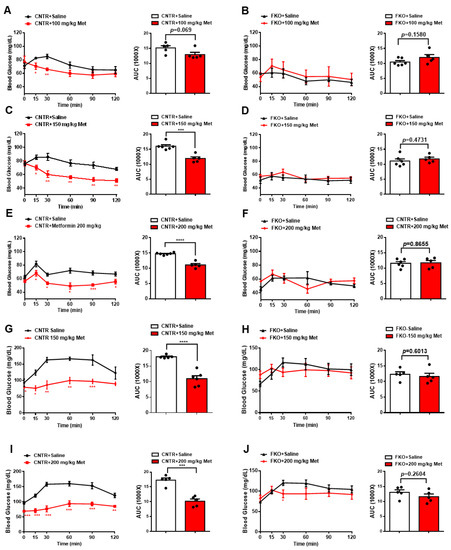
3. Metformin Inhibits Blood Glucose and HGP through Foxo1 in Mice
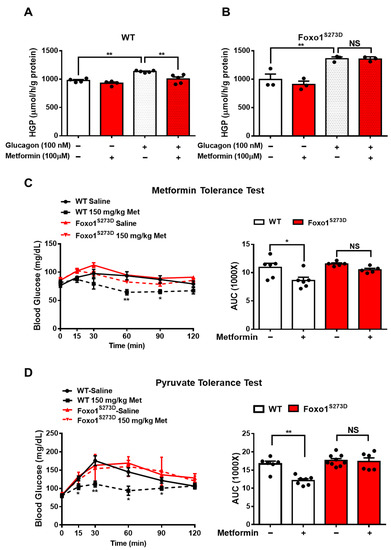
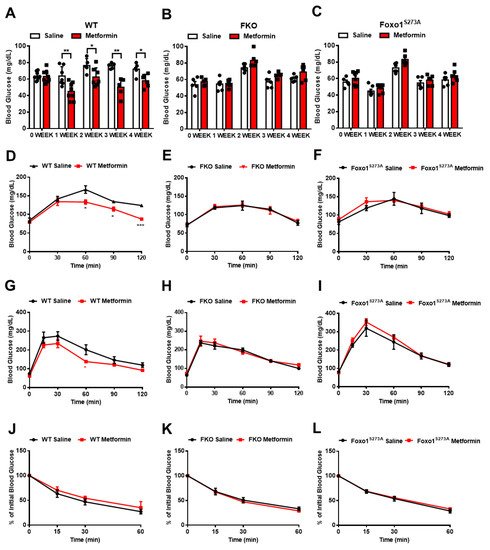
4. Foxo1-S273 Mutations Attenuate the Suppressive Effect of Metformin on HGP in Both Hepatocytes and Mice
5. Salicylate Inhibits Glucagon-Induced HGP via Foxo1 and Has No Improvement on Metformin-Mediated HGP Suppression
It is known that salicylate treatment improves glucose homeostasis and insulin sensitivity [29-31]. We next examined whether salicylate treatment enhances the beneficial effect of metformin on the regulation of glucose metabolism. We firstly treated the control and FKO hepatocytes with salicylate and found that salicylate significantly abolished glucagon-induced HGP; however, hepatic Foxo1 deficiency blocked the suppressive effect of salicylate on HGP upon glucagon treatment (Figure 5A). Indeed, salicylate treatment markedly decreased glucagon-induced PKA activity (Figure 5B) and inhibition of PKA by H89 diminished the salicylate-mediated HGP suppression in control hepatocytes treated with glucagon (Figure 5C). Consistently, acute salicylate i.p. injection significantly decreased fasting blood glucose in control mice (Figure 5D); such an effect was blocked in FKO mice (Figure 5E). However, salicylate administration did not enhance the suppressive effect of metformin on fasting blood glucose in control mice (Figure 5F). We then treated mice with 50 mg/kg body weight metformin and 125 mg/kg body weight salicylate through daily oral injection for 4 weeks. Consistently, chronic treatment of metformin significantly decreased fasting blood glucose in control mice, which was abolished in FKO mice. Salicylate treatment had little effect on fasting blood glucose and did not further enhance metformin-mediated reduction in fasting blood glucose in control mice. Hepatic Foxo1 deficiency blocked the suppressive effect of both metformin and salicylate on fasting blood glucose (Figures 5G,H). Chronic treatment of metformin and salicylate significantly deceased pyruvate-induced HGP by 17% and 14%, respectively, in control mice; however, salicylate treatment did not further enhance the metformin-mediated HGP suppression (Figure 5I). The inhibitory effects of metformin and salicylate on HGP during pyruvate tolerance test were diminished in FKO mice (Figure 5J). Thus, these results indicated that salicylate suppresses HGP through Foxo1 without further improvement on metformin-mediated HGP suppression.
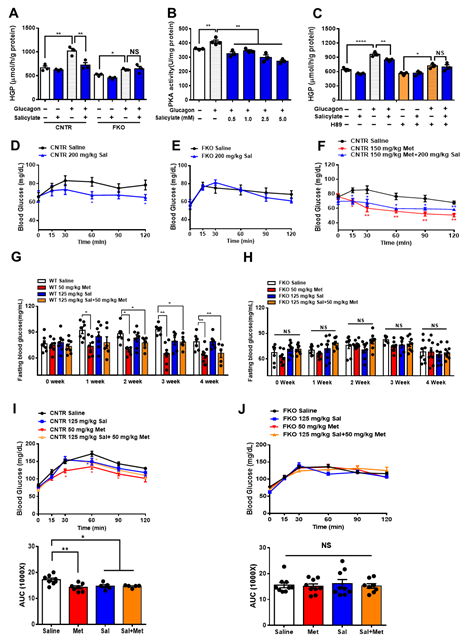
Figure 5. Salicylate suppresses glucagon-induced HGP through the PKA–Foxo1 signaling pathway in hepatocytes and has no improvement on metformin action on glucose homeostasis. (A) Primary hepatocytes isolated from control and FKO mice were pretreated with 0.5 mM of salicylate for 30 min and treated with 100 nM of glucagon for 3 h. Glucose content was measured, n = 3 independent experiments/group. (B) Control primary hepatocytes were pretreated with 0.5, 1, 2.5, and 5 mM of salicylate for 30 min, followed by 100 nM treatment for 1 h. PKA activity was measured, n = 3–4. (C) Control hepatocytes were pretreated with H89 and 0.5 mM of salicylate, followed by 100 nM glucagon treatment for 3 h. Glucose content was measured, n = 3 independent experiments/group. (D,E) Control (D) and FKO (E) mice were i.p. injected with 200 mg/kg body weight salicylate (Sal) after 16 h fasting. Blood glucose was monitored at indicated time points, n = 5–9 mice/group. (F) Control mice were i.p. injected with 150 mg/kg body weight metformin (Met) or 150 mg/kg body weight metformin (Met) + 200 mg/kg body weight salicylate (Sal) after 16 h fasting. Blood glucose was measured at indicated time points, n = 5–6 mice/group. (G,H) Control (G) and FKO (H) mice were administered with 50 mg/kg body weight metformin (Met), 125 mg/kg body weight salicylate (Sal), or 50 mg/kg body weight Met + 125 mg/kg body weight Sal via oral injection. Blood glucose was monitored after 16 h fasting, n = 5–8 mice/group. (I,J) Pyruvate tolerance test in control (I) and FKO (J) mice administered with 50 mg/kg body weight metformin (Met), 125 mg/kg body weight salicylate (Sal), or 50 mg/kg body weight Met + 125 mg/kg body weight Sal via oral injection, n = 5–8 mice/group. All data are presented as mean ± SEM. * p < 0.05, ** p < 0.01, NS: no significance, CNTR: control.
6. Metformin and Salicylate Improve HFD-induced Glucose Dysregulation through PKA-Foxo1 Pathway
We next evaluated the roles of metformin and salicylate in glucose homeostasis in diet-induced obese mice. The WT mice were fed with HFD for 6 weeks and then treated with metformin and salicylate for 7 weeks under HFD feeding. Both metformin and salicylate administrations significantly decreased fasting blood glucose levels by 20% and 21%, respectively, in the HFD-fed mice. However, salicylate treatment did not further enhance the suppressive effect of metformin on fasting blood glucose (Figure 6A). Consistently, the HFD feeding significantly impaired glucose tolerance and pyruvate tolerance, as compared with normal chow diet-fed control mice, and the effect of HFD was partially rescued by metformin or salicylate treatment. However, co-treatment of metformin and salicylate only resulted in an insignificant improvement in glucose tolerance and pyruvate-induced glucose output, as compared to metformin treatment group alone (Figures 6B,C). In addition to the anti-hyperglycemic effect, metformin showed a comparable effect in reducing the mRNA levels of pro-inflammatory markers in the liver of HFD-fed mice as compared to the salicylate treatment, but there was no enhanced effect of the combined treatment (Figure 6D). We further analyzed the protein expression in livers and found that HFD feeding activated the PKA®Foxo1-S273 phosphorylation; this was evident by increased levels of pan-PKA substrates’ phosphorylation, pFoxo1-S273, and protein abundance of total Foxo1 and G6PC (Figure 6E). Of note, metformin or/and salicylate alleviated the activation of the hepatic PKA®Foxo1 signaling pathway in the HFD-fed mice with a modest additive effect (Figure 6E). In addition, neither metformin nor salicylate treatment significantly altered serum insulin and glucagon levels (Figure 6F). Collectively, the above results suggest that metformin and salicylate improved glucose homeostasis through the PKA®Foxo1 signaling pathway and salicylate treatment does not significantly enhance the beneficial effect of metformin on glucose regulation in HFD-fed mice.
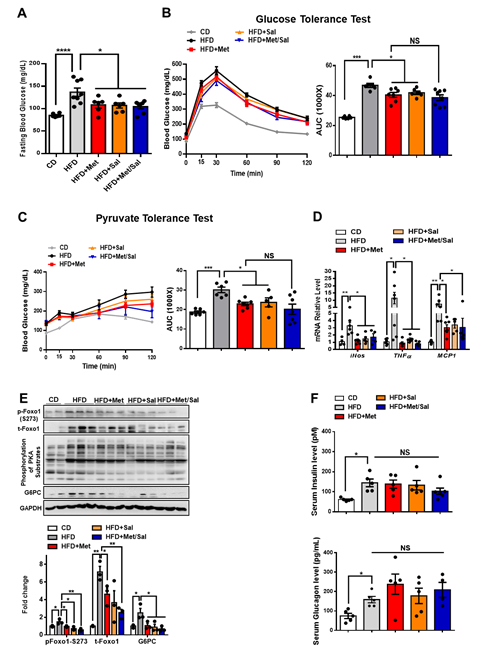
Figure 6. Metformin and salicylate improve glucose homeostasis in HFD-fed mice. (A) Fasting blood glucose level in HFD mice treated with metformin and salicylate for 7 weeks after 16 h fasting, n = 6–8 mice/group. (B) Glucose tolerance test in HFD mice treated with metformin and salicylate for 7 weeks, n = 6–8 mice/group. (C) Pyruvate tolerance test in HFD mice treated with metformin and salicylate for 7 weeks, n = 6–8 mice/group. (D) The mRNA expression levels of inflammatory factors in livers of 16 h overnight fasted HFD mice treated with metformin and salicylate for 7 weeks, n = 4–6 mice/group. (E) The protein levels of gluconeogenic genes in livers of 16 h overnight fasted HFD mice treated with metformin and salicylate for 7 weeks, n = 3 mice/group. (F) The insulin and glucagon levels in serum from HFD-fed mice treated with metformin and salicylate for 7 weeks, n = 4–5 mice/group. All data are presented as mean ± SEM. * p < 0.05, ** p < 0.01, *** p < 0.001, **** p < 0.0001. CD: chow diet.
7. The Effect of Metformin and Aspirin Combined Therapy on Blood Profiles in T2D Patients
Patients with T2D were next recruited and treated with either metformin or combined metformin and aspirin (abbreviated hereafter as Group M and Group M + A). Both M and M + A groups exhibited improvement in blood glucose profile, which is indicated by the significant decrease in HbA1c by 0.57 ± 0.14 (%) and 0.72 ± 0.19 (%), respectively, and the significant reduction in blood glucose by 1.10 ± 0.33 (mmol/L) and 1.22 ± 0.57 (mmol/L), respectively; however, aspirin administration did not significantly enhance the effect of metformin on blood glucose profile (Figures 7A,B). Blood insulin was significantly decreased in M group by 3.21 ± 1.14 (mIU/mL) and in M + A group by 1.70 ± 0.61 (mIU/mL), where no additional effect of salicylate was observed (Figure 7C). Metformin treatment group showed a significant reduction in blood glucagon level, which was not observed in metformin and salicylate co-treatment group (Figure 7D).
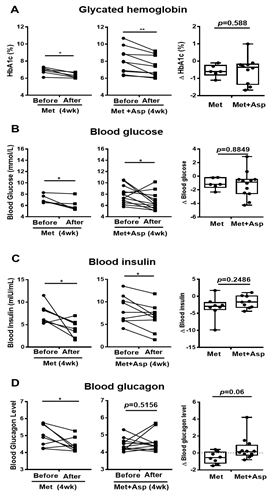
Figure 7. Blood profiles of clinical trial patients with metformin or metformin + aspirin for 4 weeks. (A–D) The HbA1c (A), glucose (B), insulin (C), and glucagon (D) profiles in type 2 diabetic patients’ blood before and after 4 week-treatment of metformin or metformin + aspirin, n = 6–12 patients/group. * p < 0.05, ** p < 0.01.
References
- Zheng, Y.; Ley, S.H.; Hu, F.B. Global aetiology and epidemiology of type 2 diabetes mellitus and its complications. Nat. Rev. Endocrinol. 2018, 14, 88–98.
- Rena, G.; Hardie, D.G.; Pearson, E.R. The mechanisms of action of metformin. Diabetologia 2017, 60, 1577–1585.
- He, L.; Wondisford, F.E. Metformin action: Concentrations matter. Cell Metab. 2015, 21, 159–162.
- Foretz, M.; Guigas, B.; Bertrand, L.; Pollak, M.; Viollet, B. Metformin: From mechanisms of action to therapies. Cell Metab. 2014, 20, 953–966.
- Hundal, R.S.; Krssak, M.; Dufour, S.; Laurent, D.; Lebon, V.; Chandramouli, V.; Inzucchi, S.E.; Schumann, W.C.; Petersen, K.F.; Landau, B.R. Mechanism by which metformin reduces glucose production in type 2 diabetes. Diabetes 2000, 49, 2063–2069.
- He, L.; Sabet, A.; Djedjos, S.; Miller, R.; Sun, X.; Hussain, M.A.; Radovick, S.; Wondisford, F.E. Metformin and insulin suppress hepatic gluconeogenesis through phosphorylation of CREB binding protein. Cell 2009, 137, 635–646.
- Shaw, R.J.; Lamia, K.A.; Vasquez, D.; Koo, S.-H.; Bardeesy, N.; DePinho, R.A.; Montminy, M.; Cantley, L.C. The kinase LKB1 mediates glucose homeostasis in liver and therapeutic effects of metformin. Science 2005, 310, 1642–1646.
- Zhou, G.; Myers, R.; Li, Y.; Chen, Y.; Shen, X.; Fenyk-Melody, J.; Wu, M.; Ventre, J.; Doebber, T.; Fujii, N. Role of AMP-activated protein kinase in mechanism of metformin action. J. Clin. Investig. 2001, 108, 1167–1174.
- Johanns, M.; Lai, Y.-C.; Hsu, M.-F.; Jacobs, R.; Vertommen, D.; Van Sande, J.; Dumont, J.E.; Woods, A.; Carling, D.; Hue, L. AMPK antagonizes hepatic glucagon-stimulated cyclic AMP signalling via phosphorylation-induced activation of cyclic nucleotide phosphodiesterase 4B. Nat. Commun. 2016, 7, 10856.
- Madiraju, A.K.; Erion, D.M.; Rahimi, Y.; Zhang, X.-M.; Braddock, D.T.; Albright, R.A.; Prigaro, B.J.; Wood, J.L.; Bhanot, S.; MacDonald, M.J. Metformin suppresses gluconeogenesis by inhibiting mitochondrial glycerophosphate dehydrogenase. Nature 2014, 510, 542.
- Foretz, M.; Hébrard, S.; Leclerc, J.; Zarrinpashneh, E.; Soty, M.; Mithieux, G.; Sakamoto, K.; Andreelli, F.; Viollet, B. Metformin inhibits hepatic gluconeogenesis in mice independently of the LKB1/AMPK pathway via a decrease in hepatic energy state. J. Clin. Investig. 2010, 120, 2355–2369.
- Cao, J.; Meng, S.; Chang, E.; Beckwith-Fickas, K.; Xiong, L.; Cole, R.N.; Radovick, S.; Wondisford, F.E.; He, L. Low concentrations of metformin suppress glucose production in hepatocytes through AMP-activated protein kinase (AMPK). J. Biol. Chem. 2014, 289, 20435–20446.
- Miller, R.A.; Chu, Q.; Xie, J.; Foretz, M.; Viollet, B.; Birnbaum, M.J. Biguanides suppress hepatic glucagon signalling by decreasing production of cyclic AMP. Nature 2013, 494, 256.
- Hunter, R.W.; Hughey, C.C.; Lantier, L.; Sundelin, E.I.; Peggie, M.; Zeqiraj, E.; Sicheri, F.; Jessen, N.; Wasserman, D.H.; Sakamoto, K. Metformin reduces liver glucose production by inhibition of fructose-1-6-bisphosphatase. Nat. Med. 2018, 24, 1395.
- Amann, R.; Peskar, B.A. Anti-inflammatory effects of aspirin and sodium salicylate. Eur. J. Pharm. 2002, 447, 1–9.
- Smith, B.K.; Ford, R.J.; Desjardins, E.M.; Green, A.E.; Hughes, M.C.; Houde, V.P.; Day, E.A.; Marcinko, K.; Crane, J.D.; Kemp, B.E.; et al. Salsalate (Salicylate) Uncouples Mitochondria, Improves Glucose Homeostasis, and Reduces Liver Lipids Independent of AMPK-beta1. Diabetes 2016, 65, 3352–3361.
- Hawley, S.A.; Fullerton, M.D.; Ross, F.A.; Schertzer, J.D.; Chevtzoff, C.; Walker, K.J.; Peggie, M.W.; Zibrova, D.; Green, K.A.; Mustard, K.J.; et al. The ancient drug salicylate directly activates AMP-activated protein kinase. Science 2012, 336, 918–922.
- Goldfine, A.B.; Fonseca, V.; Jablonski, K.A.; Chen, Y.-D.I.; Tipton, L.; Staten, M.A.; Shoelson, S.E. Targeting Inflammation Using Salsalate in Type 2 Diabetes Study, T., Salicylate (salsalate) in patients with type 2 diabetes: A randomized trial. Ann. Intern. Med. 2013, 159, 1–12.
- He, L.; Chang, E.; Peng, J.; An, H.; McMillin, S.M.; Radovick, S.; Stratakis, C.A.; Wondisford, F.E. Activation of the cAMP-PKA pathway Antagonizes Metformin Suppression of Hepatic Glucose Production. J. Biol Chem 2016, 291, 10562–10570.
- Matsumoto, M.; Pocai, A.; Rossetti, L.; DePinho, R.A.; Accili, D. Impaired regulation of hepatic glucose production in mice lacking the forkhead transcription factor foxo1 in liver. Cell Metab. 2007, 6, 208–216.
- Guo, S. Insulin signaling, resistance, and the metabolic syndrome: Insights from mouse models into disease mechanisms. J. Endocrinol. 2014, 220, T1–T23.
- Zhang, K.; Li, L.; Qi, Y.; Zhu, X.; Gan, B.; DePinho, R.A.; Averitt, T.; Guo, S.J.E. Hepatic suppression of Foxo1 and Foxo3 causes hypoglycemia and hyperlipidemia in mice. J. Endocrinol 2012, 153, 631–646.
- Wu, Y.; Pan, Q.; Yan, H.; Zhang, K.; Guo, X.; Xu, Z.; Yang, W.; Qi, Y.; Guo, C.A.; Hornsby, C.; et al. Novel Mechanism of Foxo1 Phosphorylation in Glucagon Signaling in Control of Glucose Homeostasis. Diabetes 2018, 67, 2167–2182.