The shoreline of Malaysia is exposed to threats of coastal erosion and a rise of sea level. The National Coastal Erosion Study, 2015 reported that 15% of an 8840 km shoreline is currently eroding, where one-third of those falls under the critical and significant categories that require structural protection. The Study of Sea Level Rise in Malaysia, 2017 presented a sea-level increase of 0.67–0.74 mm on average yearly.
- coastal erosion
- sea-level rise
- coastal protection structures
- adaptation
- Malaysia
1. Introduction
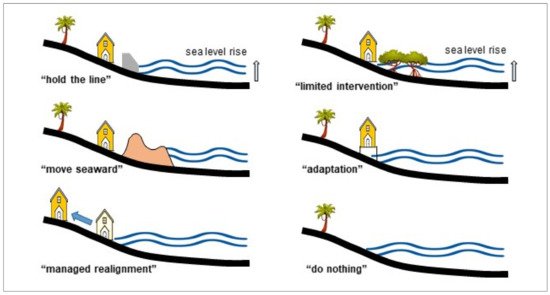
2. Coastal Management Strategies
4. Sea Level Rise
The first sea-level rise (SLR) study in Malaysia by NAHRIM collaborated with the California Hydrologic Research Laboratory (CHRL), the United States of America in 2010. The methodology in obtaining SLR rates was based on the atmosphere–ocean global climate model concerning Assessment Report No. 4, Intergovernmental Panel on Climate Change 2007 (AR4 IPCC) by using the linear trend analysis on the tide gauge and satellite altimeter [132][30]. The study showed that the national SLR projection was 2.5–10.6 mm/year, slightly higher than the global projection, with a maximum rate projected for Kedah, Kelantan, and Sabah. An updated national sea-level rise study due to climate change impact was conducted by NAHRIM recently in 2017 with the collaboration of the Commonwealth Scientific and Industrial Research Organisation, Australia (CSIRO), and Universiti Kebangsaan Malaysia (UKM) [133][31]. The study was based on AR5 IPCC 2013 on various RCP (representative carbon pathway) scenarios by using the latest tide gauge data and satellite altimeter. The projections were derived from Coupled Model Inter-comparison Project Phase 5 (CMIP5) with the combination of data from global ocean thermal expansion, mass loss due to glaciers, the surface mass balance of ice sheets, land water storage change, and GIA-induced regional sea-level changes in surface loading over the previous glacial cycle [134][32]. Regarding the updated study [133][31], the rate of sea-level increase and projection details in the year 2100 are given in Table 3 and Table 4, respectively. Figure 19 presents the map of SLR projection along the shoreline in Malaysia based on a similar RCP 8.5 scenario. A study using the radar altimeter database system (RADS) also suggested that land subsidence due to excessive water extraction also enhanced the impacts of sea-level rise on coastal cities [135][33].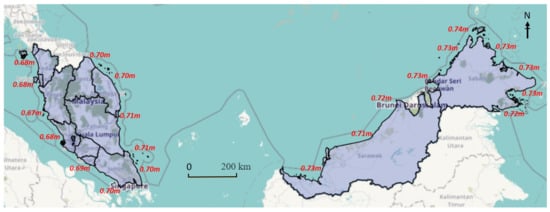
Methods | Projection/Location | Malaysia (Year) | Sea Level Rise | Global | ||||||||
|---|---|---|---|---|---|---|---|---|---|---|---|---|
Note | ||||||||||||
Sea Level Rise Adaptation | ||||||||||||
Tide Gauge | 2.2–5.3 (1993–2015) | |||||||||||
Projection 2100 (RCP 8.5) | for Peninsular Malaysia | 3.2 (2.8–3.6) | ||||||||||
Coastal bunds, seawall, and revetment | 0.67–0.71 m | (10.5–10.9 mm/year) | ||||||||||
Satellite Altimetry | 2.8–4.4 (1993–2015) |
Effective | Maximum SLR—east coast of Johor, Pahang, Terengganu and Kelantan | ||||||||||||||
Adaptive | Projection 2100 (RCP 8.5) | for East Malaysia | 0.71–0.74 m | (10.9–11.1 mm/year) | Maximum SLR–Sabah (Kudat) |
5. Shoreline Erosion Defense and Sea Level Rise Adaptation
The function of coastal protection structures is assessed from the perspective of shoreline erosion defense and sea-level rise adaptation. In most cases for Category 1 and Category 2 erosion, protection structures are constructed retrospectively at eroded sites after a series of erosion events [145][35]. For Category 3, continuous monitoring is carried out to minimize the impact of physical and socioeconomic activities. A study by [146][36] stated that a higher sea-level rise leads to greater wave height towards the shore inside the surf zone due to less depth-limited breaking. The same trends were observed for relative changes in wave run-up height and crest freeboard. Therefore, a higher level of coastal defense structures is proposed for protection against sea-level rise and erosion related to higher waves due to increased water level. Disturbance in coastal hydrodynamics due to a sea-level rise leads to shoreline, morphological, and sedimentation concentration changes [147,148,149][37][38][39]. For example, the structure crest level has to be raised by a magnitude larger than the corresponding mean sea-level rise [150][40]. A study by [151][41] stated that in some cases, the erosion rate due to sea-level rise is magnetized approximately 2.5 times higher for the next 100 years. However, it is important to note that coastal structures may have a localized impact on accretion or erosion changes, depending on shoreline trends, as suggested by many studies, including [152,153][42][43]. Coastal hard structures are commonly used for the “hold the line” strategy at most of the eroded coasts where physical and economic activities are vital as such in Morib, Marang, and Tanjung Piai. Properly designed structures such as coastal bunds, seawall, and revetment are effective for protection. However, adverse physical and environmental impacts are expected at the adjacent shoreline and downdrift area [154][44]. Nevertheless, the approach provides a specific solution to the eroded site promptly. The structures are also adaptive to sea-level rise as long as structural integrity and stability are not affected. The finish level of bunds, seawall, and revetment can be periodically increased when required to avoid overtopping and inundation along the protected shore. This “adaptation” option is generally practical for cost-saving and immediate solutions. Offshore breakwater and geotextile tubes are located within the intertidal zone with minimum design crest height. Therefore, no significant change is expected in terms of function effectiveness for erosion control and short-medium sea-level rise adaptation. However, underwater structures such as submerged breakwater WABCORE in Marang and dykes in Kemaman are expected to be less effective due to sea-level rise, as the freeboard level is increased. However, their ecologically based function as a coral and fish ecosystem restorer is expected to be improved. Beach nourishment “hold the line” is commonly used at sandy beaches with major tourism activities such as in Port Dickson and Kuala Terengganu. The system requires periodical maintenance of sediment supply to make sure its effectiveness as a soft engineering approach in erosion control. In terms of sea-level rise adaptation, a long-term continuous supply of sediment is required. Mangrove replanting is one of the strategies in ‘limited intervention’, both as erosion and sea-level rise control measures. The approach is considered fairly effective as a long-term solution, as the ecosystem is crucial to the coastal environment. However, as the sea-level keeps increasing, suitable areas for mangrove replanting are becoming limited due to backshore development and current land use. The abandoned coconut plantation in Batu Pahat is one of the examples of a sacrificial area for the “do nothing” strategy. As water volume is expected to increase, more vacant lands and wetlands are required to adapt to sea-level rise. “Managed realignments” strategy requires systematic evaluation and integrated management procedure as it involves various stakeholders. Some examples include the relocation of a coconut plantation in Batu Pahat, aquaculture ponds in Sabak Bernam, village houses at Marang, and coastal infrastructures in Kuala Terengganu further inland. Coastal reclamation is an example of a “move seaward” strategy, which is only approved for critical development. Environmental impact assessment and detailed hydraulic study must be conducted to evaluate adverse environmental impacts and propose mitigation measures before execution. A combination of hard structure and soft engineering techniques is used along the reclaimed shoreline in most cases. A detailed study should be carried out for better projection by using detailed subsurface data and advanced numerical models that is site-specific. The summary of coastal structure functions as future beach erosion control and sea-level rise adaptation is proposed in Table 5.Coastal Defense Approach | ||||||||||||||||||||||||||||||||||||||||||||||||||||||
|---|---|---|---|---|---|---|---|---|---|---|---|---|---|---|---|---|---|---|---|---|---|---|---|---|---|---|---|---|---|---|---|---|---|---|---|---|---|---|---|---|---|---|---|---|---|---|---|---|---|---|---|---|---|---|
Hard Structures | Seawalls, revetments, armor rocks | Breakwater and perpendicular groyne | Detached and offshore breakwater | Submerged dykes and breakwater | Temporary sandbag and tubes | Floodgate and tidal barriers | Innovative structures | Effective shoreline control | Quick/different types | Promote beach build-up | Safe for public use | Promote beach build-up | Aesthetic value, reef/coral | Cheap and quick | Avoid saline intrusion | Easy, quick, and cheap | Wave overtop/reflection | Local scour and erosion | Erosion at downdrift | Rip current generation | Costly, eye-sore | Less effective | Require maintenance | Deplete sediment source | Less effective | |||||||||||||||||||||||||||||
Soft Engineering and Ecological Based | Beach nourishment | Mangrove replanting | The artificial reef, seagrass, and seaweed | Creation of wetland and dune building | As the natural sandy beach | As natural muddy shore | Rejuvenate biodiversity | Create a new ecosystem | Expensive, maintenance | Long term effect | Long term effect | Long term effect | ||||||||||||||||||||||||||||||||||||||||||
Infrastructure Modification | Elevation of seawall and breakwater | Raise the level of platform and piers | Cheaper and adaptive | Periodically if required | Eyesore, limited beach space, maintenance |
3. Coastal Erosion
State | Length (km) | Erosion Control (Future) | Total Eroded Coastline (km) | Critical and Significant Erosion (km) | |||||||||||||||
|---|---|---|---|---|---|---|---|---|---|---|---|---|---|---|---|---|---|---|---|
Perlis | 26.4 | 0.1 | 0.0 | ||||||||||||||||
Kedah | |||||||||||||||||||
Offshore breakwater and geotextile tubes | 639.8 | No significant change | Long term: less effective | 26.8 | No significant change | Long term; less effective | 15.5 | ||||||||||||
Pulau Pinang | 215.6 | ||||||||||||||||||
Submerged breakwater | Less effective | 16.3 | Not effective | 9.7 | |||||||||||||||
Perak | |||||||||||||||||||
Beach nourishment | 397.5 | Effective | 95.1 | 33.9 | |||||||||||||||
Effective, immediate impact | Selangor | 492.1 | |||||||||||||||||
Mangrove replanting | 74.6 | Fairly effective | Effective, the long term impact | 23.4 | |||||||||||||||
Negeri Sembilan | 65.0 | ||||||||||||||||||
Tidal barrier, flood gate | Not effective | 9.8 | Avoid saline intrusion | 9.6 | |||||||||||||||
Melaka | |||||||||||||||||||
Abandoned wetland | 120.5 | 3.7 | 1.9 | ||||||||||||||||
Effective | Effective, need more space | Johor | 813.6 | 64.7 | |||||||||||||||
Innovation structure | 38.1 | ||||||||||||||||||
Effective and adaptive | Adaptive | Pahang | 378.4 | 61.8 | 18.4 | ||||||||||||||
Terengganu | 443.1 | 48.7 | 27.7 | ||||||||||||||||
Kelantan | 179.5 | 19.8 | 4.5 | ||||||||||||||||
Sarawak | 1234.1 | 492.5 | 163.4 | ||||||||||||||||
Sabah | 3752.9 | 429.3 | 82.1 | ||||||||||||||||
Labuan | 81.5 | 4.4 | 3.1 |
References
- Chen, S.-L.; Jeevan, J.; Cahoon, S. Malaysian Container Seaport-Hinterland Connectivity: Status, Challenges and Strategies. Asia J. Shipp. Logist 2016, 32, 127–138.
- Flewwelling, P.; Hosch, G. Country Review—Malaysia; Food and Agriculture Organization of the United Unions: Rome, Italy, 2004; Available online: (accessed on 22 June 2021).
- Wong, P.P. Where have all the beaches gone. Singap. J. Trop. Geogr. 2003, 24, 111–132.
- Prasad, D.H.; Kumar, N.D. Coastal Erosion Studies—A Review. Int. J. Geosci. 2014, 5, 341–345.
- Noujas, V.; Thomas, K.V. Erosion Hotspots along Southwest Coast of India. Aquat. Procedia 2015, 4, 548–555.
- Yincan, Y. Coastal Erosion. In Marine Geo-Hazards in China; Elsevier: Amsterdam, The Netherlands, 2017; pp. 269–296.
- Amara, R.; Diop, M.; Diop, C.; Ouddane, B. Chapter 37: The Senegalese Coastal and Marine Environment. In World Seas: An Environmental Evaluation; Elsevier: Amsterdam, The Netherlands, 2019; pp. 855–873.
- Ariffin, E.H. Effect of Monsoons on Beach Morphodynamics in the East Coast of Peninsular Malaysia. Universite Bretagne Loire, France. 2017. Available online: (accessed on 12 February 2021).
- Church, J.A.; Aarup, T.; Woodworth, P.L.; Wilson, W.S.; Nicholls, R.J.; Rayner, R.; Lambeck, K.; Mitchum, G.T.; Steffen, K.; Cazenave, A.; et al. Chapter 13 Synthesis and Outlook for the Future. In Understanding Sea-Level Rise and Variability; Blackwell Publishing Ltd.: Amsterdam, The Netherlands, 2010.
- Hsan, S.; Begum, R.A.; Nor, N.G.; Abdul Maulud, K.N. Current and potential impacts of sea level rise in Malaysia. In Proceedings of the 3rd International Conference on Science & Technology Applications in Climate Change (STACLIM 2018), Melaka, Malaysia, 13–15 November 2018.
- De Almeida, B.A.; Mostafavi, A. Resilience of Infrastructure Systems to Sea-Level Rise in Coastal Areas: Impacts, Adaptation Measures, and Implementation Challenges. Sustainability 2016, 8, 1115.
- Zhang, K.; Douglas, B.C.; Leatherman, S.P. Global Warming and Coastal Erosion. Clim. Chang. 2004, 64, 41–58.
- Ghazali, N.H.M.; Awang, N.A.; Mahmud, M.; Mokhtar, A. Impact of Sea Level Rise and Tsunami on Coastal Areas of North-West Peninsular Malaysia. Irrig. Drain. 2018, 67, 119–129.
- JPBD. Report Rancangan Fizikal Zon Pesisiran Pantai Negara; Federal Town and Country Planning Department: Kuala Lumpur, Malaysia, 2012; ISBN 9789832839354.
- Nordin, D.Y.B. Towards sustainable coastal planning and policies from a Malaysian perspective. In Environmental Problems in Coastal Regions VI; WIT Press: Southampton, UK, 2006; pp. 45–54.
- Mohamad, M.F.; Lee, L.H.; Samion, M.K.H. Coastal Vulnerability Assessment towards Sustainable Management of Peninsular Malaysia Coastline. J. Environ. 2014, 5, 533–538.
- Nicholls, R.J.; Cazenave, A. Sea-level rise and its impact on coastal zones. Science 2010, 328, 1517–1520.
- NOAA. Hurricane Post Tropical Cyclone Sandy; National Oceanic and Atmospheric Administration & National Weather Service: Washington, DC, USA, 2012. Available online: (accessed on 22 January 2021).
- Hosen, N.; Nakamura, H.; Hamzah, A. Adaptation to Climate Change: Does Traditional Ecological Knowledge Hold the Key? Sustainability 2020, 12, 676.
- Hamzah, F.M.; Saimi, F.M.; Jaafar, O. Identifying the Monotonic Trend in Climate Change Parameter in Kluang and Senai, Johor, Malaysia. Sains Malays. 2017, 46, 1735–1741.
- Intergovernmental Panel on Climate Change; Coastal Zone Management Subgroup; Dronkers, J.J.; Misdorp, R.; Spradley, J.R. Strategies for Adaptation to Sea Level Rise; Ministry of Transport and Public Works, Rijkswaterstaat, Tidal Waters Division: Geneva, Switzerland, 1990.
- Stelljes, N.; Martinez, G.; McGlade, K. Introduction to the RISC-KIT web based management guide for DRR in European coastal zones. Coast. Eng. 2018, 134, 73–80.
- Frohle, P.; Müncheberg, R. Fokusthema 1: Küstenschutz. In RADOST Jahresbericht. RADOST-Berichtsreihe; RADOST-Verbund, Ed.; Bericht Nr. 21: Berlin, Germany, 2013.
- Gracia, A.; Rangel-Buitrago, N.; Oakley, J.A.; Williams, A.T. Use of ecosystems in coastal erosion management. Ocean Coast. Manag. 2018, 156, 277–289.
- Heurtefeux, H.; Sauboua, P.; Lanzellotti, P.; Bichot, A. Coastal Risk Management Modes: The Managed Realignment as a Risk Conception More Integrated. In Risk Management in Environment, Production and Economy; Intech Open: London, UK, 2011.
- Sarkar, M.S.K.; Begum, R.; Pereira, J.; Jaafar, A.; Saari, M.Y. Impacts of and Adaptations to Sea Level Rise in Malaysia. Asian J. Water Environ. Pollut. 2014, 11, 29–36. Available online: (accessed on 12 December 2020).
- Williams, A.T.; Rangel-Buitrago, N.; Pranzini, E.; Anfuso, G. The management of coastal erosion. Ocean Coast Manag. 2018, 156, 4–20.
- DID. National Coastal Erosion Study (NCES2015) Report; Department of Drainage and Irrigation: Kuala Lumpur, Malaysia, 2015; p. ES27.
- EPU. National Coastal Erosion Study (NCES1985) Report; Economy Planning Unit, Department of Drainage and Irrigation, Prime Minister Office: Kuala Lumpur, Malaysia, 1985.
- NAHRIM. The Study of Impact of Climate Change on Sea Level Rise in Malaysia; National Hydraulic Research Institute of Malaysia: Selangor, Malaysia; Ministry of Natural Resources and Environment: Selangor, Malaysia, 2010.
- NAHRIM. Impact of Climate Change: Sea Level Rise Projection in Malaysia; National Hydraulic Research Institute of Malaysia: Selangor, Malaysia; Ministry of Water, Land and Natural Resources: Putrajaya, Malaysia, 2017.
- Church, J.A.; Clark, P.U.; Cazenave, A.; Gregory, J.M.; Jevrejeva, S.; Levermann, A.; Merrifield, M.A.; Milne, G.A.; Nerem, R.S.; Nunn, P.D. Sea-Level Rise by 2100. Science 2013, 342, 1445.
- Hamid, A.I.A.; Din, A.H.M.; Hwang, C.; Khalid, N.F.; Tugi, A.; Omar, K.M. Contemporary sea level rise rates around Malaysia: Altimeter data optimization for assessing coastal impact. J. Asian Earth Sci 2018, 166, 247–259.
- Awang, N.A.; Hamid, M.R.A. Sea Level Rise in Malaysia. Hydrolink 2013, 2, 47–49. Available online: (accessed on 22 June 2021).
- Ghazali, N.H.M. Coastal erosion and reclamation in Malaysia. Aquat. Ecosyst. Health Manag. 2006, 9, 237–247.
- Cheon, S.-H.; Suh, K.-D. Effect of sea level rise on nearshore significant waves and coastal structures. Ocean Eng. 2016, 114, 280–289.
- Le Cozannet, G.; Garcin, M.; Petitjean, L.; Cazenave, A.; Becker, M.; Meyssignac, B.; Walker, P.; Devilliers, C.; Le Brun, O.; Lecacheux, S.; et al. Exploring the relation between sea level rise and shoreline erosion using sea level reconstructions: An example in French Polynesia. J. Coast. Res. 2013, 165, 2137–2142.
- Ishak, D.S.M.; Abd Wahab, A.K.; Teh, S.Y.; Jamal, M.H. Projected ecosystem response to the anticipated effects of sea level rise. Phys. Chem. Earth 2020, 120, 102934.
- Lavine, W.; Jamal, M.H.; Abd Wahab, A.K.; Kasiman, E.H. Effect of sea level rise on oil spill model drift using TELEMAC-2D. J. Water Clim. Chang. 2020, 11, 1021–1031.
- Awang, N.A.; Anuar, N.; Hamid, M.R.A.; Mohamad, M. Modification of design parameters for coastal protection structures in view of future sea level rise for east coast Peninsular Malaysia. In Proceedings of the Australian Coasts & Ports Conference, Hobart, Tasmania, 10–13 September 2019.
- Jones, A. Chapter 7: Potential Coastal Erosion of the Swan Coastal Plain due to long-term Sea Level Rise. In Natural Hazard Risk in Perth, WA; Geoscience Australia: Canberra, Australia, 2005.
- Romine, B.M.; Fletcher, C.H.; Barbee, M.M.; Anderson, T.R.; Frazer, L.N. Are beach erosion rates and sea-level rise related in Hawaii? Glob. Planet Chang. 2013, 108, 149–157.
- Ling, S.Y.; Veerasamy, K.; Jamal, M.H.; Ab Razak, M.S. Preliminary Modelling Assessment of Hydrodynamic Simulation due to Terengganu Airport Runway Extension. In IOP Conference Series: Earth and Environmental Scienc; IOP Publishing: Bristol, UK, 2019; Volume 357, p. 012036.
- Rangel-Buitrago, N.; Williams, A.; Anfuso, G. Hard protection structures as a principal coastal erosion management strategy along the Caribbean coast of Colombia. A chronicle of pitfalls. Ocean Coast. Manag. 2018, 156, 58.