The monitoring of hypnosis depth by means of electroencephalogram-based (EEG-based) systems is emerging in paediatric anaesthesia common practice. This monitor system measures specific EEG signs which derive from anaesthetic-induced changes in neuronal firing.
- neuromonitoring
- EEG-derived monitor
- depth of anaesthesia
- near-infrared-spectroscopy
- brain oxygenation
- anaesthesia
- paediatric
1. Introduction
The monitoring of hypnosis depth by means of electroencephalogram-based (EEG-based) systems is emerging in paediatric anaesthesia common practice. This monitor system measures specific EEG signs which derive from anaesthetic-induced changes in neuronal firing.
In children, these signs are influenced not only by both the depth of sedation and the mechanism of action of the specific anaesthetic agent, but also by the typical age-related changes of a developing brain [1]. Moreover, the current clinical condition and underlying co-morbidities might significantly affect the validation and application of this monitoring [2][3][4][2,3,4]. Therefore, although recent studies have shown that they are worth being used in children [5], many of the available monitoring methods show limitations when applied to paediatric patients and have to be cautiously used, especially in those aged less than 1 year [6][7][8][6,7,8].
2.Available EEGS Technology
For daily practice, in addition to the unprocessed EEG (the raw cortical EEG), two different groups of EEG-based devices are currently available. These are the EEG-derived indices (processed EEG or p-EEG) and the spectrogram or Density Spectral Array (DSA) [9] (Figure 1).
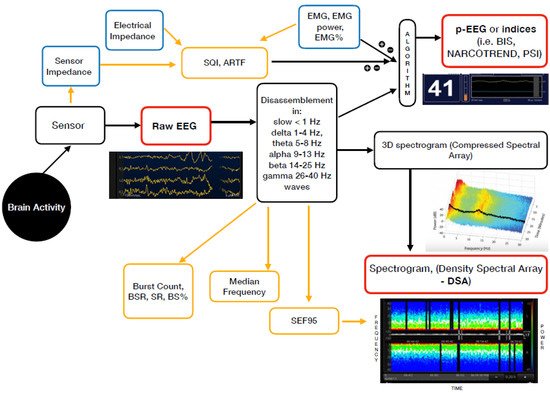
Figure 1. Mechanism of action of the currently available EEG derived anaesthesia monitoring (in red). The sensor is placed on the forehead and records the electrical potentials produced in the cortex resulting in the raw EEG. The majority of the EEG-derived monitors work by disassembling a complex EEG waveform (the raw EEG), into many series of waves of different frequencies (Hertz—Hz). These, together with several of the EEG variables, are converted into a single index through mathematical algorithms by the processed EEG (p-EEG) devices. The obtained index represents the level of hypnosis. However, the index can also be affected by the Electromyography (EMG) and the Signal Quality Index (SQI or ARTF). The spectrogram, is a real time monitoring which portrays all the EEG frequencies and their power over the time in a three-dimensional method (3D spectrogram or Compressed Spectral Array). The latter is then integrated in a two-dimensional plot using colours to represent different powers in the Density Spectral Array (DSA). Derived additional parameters are the Spectral Edge Frequency (SEF95), Median Frequency and the Burst Count (burst/minute) Suppression Rate (SR), Burst Suppression Ratio (BSR), Suppression Ratio (SR) or BS% Indicator (Burst suppression percentage). These can be either represented on the display by a number or visualized on the Spectrogram.
The majority of the EEG-derived monitors works by disassembling a complex EEG waveform (the raw EEG), into many series of waves of different frequencies. These are, respectively, the slow (<1 Hz), delta (1–4 Hz), theta (4–8 Hz), alpha (8–13 Hz), beta (13–25 Hz) and gamma (25–40 Hz) oscillations. The power of each band is defined by quantity and amplitude [9].
The processed EEG (p-EEG) devices convert several of the EEG variables into a single index through mathematical algorithms. The obtained index represents the level of hypnosis. Some examples of p-EEG monitors are the Bispectral Index Monitor (BIS, Medtronic Inc.), the Patient State Index (PSI, Masimo Inc.) of the SEDLine brain function monitor or the Narcotrend index (Narcotrend Inc.). Finally, the Response and the State Entropy measures the degree of disorder in the EEG together with the electromyography (EMG) signals [10].
Differently from the pEEG, the Density Spectral Array (DSA) or spectrogram is a real time monitoring method which portrays all the EEG frequencies and their power over the time in a three-dimensional method. The latter is then integrated in a two-dimensional plot using colours to represent different powers [11].
Table 1lists some of the most widely used EEG-based anaesthesia monitoring devices which are currently available, along with their key features.
| Device | EEG-Derived Index (Processed EEG) | Mechanism of Action-Algorhytm Basis | Anaesthesia Range (Total Range) | Delay (s) | Potential Influencing Factors | Other EEG Monitoring Included into the Device | Additional Parameters | Index Age Limits | ||||||||||||||||||||||||||||||||||||
|---|---|---|---|---|---|---|---|---|---|---|---|---|---|---|---|---|---|---|---|---|---|---|---|---|---|---|---|---|---|---|---|---|---|---|---|---|---|---|---|---|---|---|---|---|
| BISMonitor | (Bispectral Index Monitor Covidien LP, Medtronic Inc.) - 2 channel - 4 channel |
BIS index | Analysis of EEG features (degree of high frequency activation, low frequency synchronisation, nearly suppressed periods, fully suppressed periods) which correlate with hypnosis/sedations EEG in adults | 40–60 (0–100) 0 = very deep hypnosis; 100 = conscious |
Index | 5–15 | DSA | Real-time |
EMGand NMBDs | Medical Devices | (Electocautery, pacemakers, etc.) | Certain anaesthetic agentis or adjuvants | , | Serious clinical conditions | (cerebral ischemia, hypo perfusion, cardiac arrest, hypovolemia, hypotension, hypothermia) | 2 channel M: | Raw EEG | 4 channel M: | - Raw-EEG | - DSA | (Density Spectral Array) - Asymmetry | (ASYM) | Indicator | EMG | (bar 0–4 −> EMG power 30 to > 55) | Burst Count | (Burst/minute) | SQI | (Signal Quality Indicator) 0–100 Suppression Ratio ( | SR | ) number | 12 year | = safe | 1-5 year | to be cautiously used (2 channel sensor age > 4 years recommended; | <1 | year | not safe | DSA | > | 6 months | |||
| SEDLine | (Root Masimo) | PSI | (Patient State Index) | Quantitative EEG analysis of the power within the α, β, δ and θ frequency bands; the temporal and spatial gradients occurring among these frequency bands when changing anaesthetic dept. | 25–50 (0–100) 0 = very deep hypnosis; 100 = conscious |
Index | 25 | DSA | Real-time |
EMG and NMBDs | Medical Devices | (Pacemakers, etc.) | Certain anaesthetic agentis or adjuvants | , | Serious clinical conditions | (cerebral ischemia, hypo perfusion, cardiac arrest, hypovolemia, hypotension, hypothermia) | Raw EEG | 4 channels Power Spectrum and | DSA | SEFL95 | and SEFR95 Spectral Edge Frequency left and right (95% quantile) | ASYM | metry Graph | EMG | Suppression Rate ( | SR | ) Artifact ( | ARTF | ) Electrical | Impedance | < | 1 | year | not safe | DSA | > | 6 months | |||||||
| NARCOTREND-Compact M | (Medival) | Narcotrend Monitor | Analysis of multivariate EEG-derived parameters to carry out an automatic classification of the EEG on a scale ranging from stage A (conscious) to stage F (very deep hypnosis). |
D (general anaesthesia)-E (general anaesthesia with deep hypnosis); [A (conscious) − F (very deep hypnosis)]. |
Real-time | EMG and NMBDs | Medical Devices | (Electocautery, pacemakers, etc.) | Serious clinical conditions | (cerebral ischemia, hypo perfusion, cardiac arrest, hypovolemia, hypotension, hypothermia) | Raw-EEG | (1 or 2 channels) Cerebrogram Relative Band Activities/Power Power Spectrum and | DSA | Quantiles | SEF50 | (median (50% quantile) and | SEF95 | spectral edge frequency (95% quantile) | EMG | Burst Suppression Ratio ( | BSR | ) | STI | (sharp transient intensity) | Impedance | <1 year | not safe | <60 days | : only EEG classifications for stages with implied or clear suppression lines (E2 to F1). If there is an EEG without suppression lines, the output is “Undiff. EEG” | 60 day–1 year | : the full A–F scale is displayed. As long as no fully classifiable EEG is detected −> the output “Undiff. EEG” is displayed. | DSA | > | 6 months | ||||||||||
| Narcotrend Index | 20–64 (0–100) 0 = very deep hypnosis; 100 = conscious |
Index | 28 | DSA | Real-time |
|||||||||||||||||||||||||||||||||||||||
| E-ENTROPYModule | (GE Healthcare, Inc.) | SE | (State of Entropy) | RE | (Response Entropy) | Analysis of the irregularity, complexity, or unpredictability characteristics of the EEG and the frontal electromyograph (FEMG) signals | 40–60 (0–91) | 15–60 | Medical Devices | (Electocautery, pacemakers, etc.) | Neurological Disorders | , traumas, epileptic seizures and psychoactive | medication | – | EMG | (Index component) Burst Suppression Ratio ( | BSR | ) | <2 year | not safe | ||||||||||||||||||||||||
| CSM | Cerebral State Monitor (Danmeter) | CSI | (Cerebral State Index) | Quantitative EEG analysis in specific frequency bands (α and β), the relationship between these quantities (β-α) and the amount of instantaneous burst suppression (BS) in each thirty-second period of the EEG. | 40–60 (0–100) 0 = very deep hypnosis; 100 = conscious |
50 | Serious clinical conditions | (severe neurological disorders) and psychoactive | medication | Medical Devices | (Pacemakers) | Raw EEG | EMG | % and EMG bar | BS% | Indicator (Burst suppression percentage | SQI | (Signal Quality Indicator) 0–100 Sensor | Impedance | <2 year | not safe |