Green buildings refer to buildings that decrease adverse environmental effects and maintain natural resources. They can diminish energy consumption, greenhouse gas emissions, the usage of non-renewable materials, water consumption, and waste generation while improving occupants’ health and well-being. As such, several rating tools and benchmarks have been developed worldwide to assess green building performance (GBP), including the Building Research Establishment Environmental Assessment Method (BREEAM) in the United Kingdom, German Sustainable Building Council (DGNB), Leadership in Energy and Environmental Design (LEED) in the United States and Canada, Comprehensive Assessment System for Built Environment Efficiency (CASBEE) in Japan, Green Star in Australia, Green Mark in Singapore, and Green Building Index in Malaysia. Energy management (EM) during building operation could also improve GBP. One of the best approaches to evaluating the impact of EM on GBP is by using structural equation modelling (SEM). SEM is a commanding statistical method to model testing. One of the most used SEM variance-based approaches is partial least squares (PLS), which can be implemented in the SmartPLS application. PLS-SEM uses path coefficients to determine the strength and significance of the hypothesised relationships between the latent constructs.
- energy management
- green building performance
- office building
- SEM-PLS
1. Introduction
The building sector is one of the most energy-intensive sectors, irrespective of its geographical location
. It is estimated that buildings’ energy consumption accounts for approximately 32% of global energy use, and buildings are responsible for about 40% of the total energy-related carbon dioxide emissions
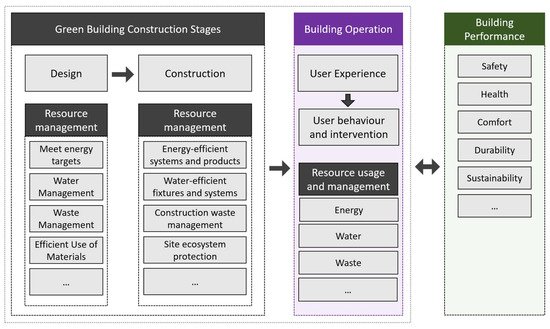
. This is due to the rapid depletion and inefficient use of natural resources and energy and increasing waste production in the building sector. However, buildings can conserve energy by appropriate resource management (RM) practices at the design, construction, and operation stages (see Figure 1).
Figure 1.
Building recourse management at different stages.
Research suggests that implementing energy-efficiency strategies at the design stage can significantly influence building performance and reduce energy usage
. As such, there has been an increasing amount of literature on zero energy building construction and renewable energy sources
[6]
. These studies have investigated, proposed, and improved different parameters, indices, and approaches to improving building performance
. They primarily focus on enhancing building systems and integrating renewable energy at the design phase using various building performance simulation (BPS) tools. The most commonly used approach to applying BPS tools during the design phase is based on evaluating the simulation outcomes, and if not satisfactory, the design is altered until the desired results are achieved. One of the limitations of this approach is that it uses direct modelling and simulation workflow in which the impacts of modifying the values of parameters on energy performance are examined one at a time, without considering the combined impacts of parameters
[10]. An accurate and simplified prediction method of users’ comfort in buildings is another major challenge of using BPS tools. Several parameters, such as human behaviour in buildings, their interventions in design conditions, resource usage, and management, can significantly negatively impact the predicted energy saving. In practice, it is a challenge for building designers to assess the possibility of achieving predicted energy usage at the design stage. There is also little published data on user interventions and RM during the operation phase of the buildings and their impact on energy usage. Figure 1 gives a brief description of RM.
. An accurate and simplified prediction method of users’ comfort in buildings is another major challenge of using BPS tools. Several parameters, such as human behaviour in buildings, their interventions in design conditions, resource usage, and management, can significantly negatively impact the predicted energy saving. In practice, it is a challenge for building designers to assess the possibility of achieving predicted energy usage at the design stage. There is also little published data on user interventions and RM during the operation phase of the buildings and their impact on energy usage. Figure 1 gives a brief description of RM.
2. Resource Management
RM means attaining more with less. It is the management of natural usage resources by humans to provide the greatest advantage to current generations while retaining the capacity to meet future generations’ requirements [11]. The current study declares challenges encountered in RM to improve building performance. According to Graham [12], significant amounts of natural resources are used by the building industry, and therefore many of the initiatives pursued to create ecology-sustaining buildings are concentrated on boosting the efficiency of resource consumption.
While there are several existing tools to optimise resource usage and management during the design and construction stages, the building occupants’ experience and behaviour have received minimal attention. Studies have shown that harmful user interventions in green building design conditions resulting from experiencing discomfort could destroy predicted energy savings up to 75% [13][14]. Appropriate RM during building operation could improve building performance and user experience, reducing operating costs and enhancing end-users’ health and well-being. The following sections explain RM’s different factors, including water management, waste management, and energy management during building operation.
2.1. Water Management
Water management is one of the main elements of sustainable development. The world is facing water scarcity, and water shortages have become an issue worldwide. Additionally, water availability and quality are crucial throughout the building life cycle, and it is one of the most common natural resources used in buildings [15]. Building industries contribute to about 16% of freshwater consumption; hence greater emphasis was given to water efficiency and conservation in almost all the sustainable building rating schemes worldwide. Water management is one of the world’s most significant challenges due to competition for limited resources, increasing global water need, regional disparities in water supply and affluence, aquifer depletion, pollution, and climate change-induced water stress. Accordingly, integrated sustainable water resource management requires innovation, progress, and international cooperation in the coming decades [16]. While water management in buildings, including water treatment, is so expensive, it is the best solution to conserve and protect future generations’ water resources [17].
2.2. Waste Management
Waste is a pressing environmental, social, and economic issue, and it is one of the biggest challenges faced by every urban area in the world [18]. The waste is categorised into different types based on its:
-
physical state (e.g., solid waste, liquid waste, gaseous waste),
-
source (e.g., household/domestic waste, industrial waste, agricultural waste, commercial waste, demolition and construction waste, mining waste), and
-
environmental impact (hazardous waste and non-hazardous waste) [19].
A large amount of construction waste is generated every year. Construction waste refers to damaged and surplus materials as the result of building activities, such as demolition, new construction, and renovations. While the construction industry has a significant impact on economic development, rising construction waste has become a serious global issue [20]. Therefore, due to the increase in construction waste production, there is a need to implement waste management in order to ensure the protection of the environment and natural resources for future generations.
Waste management has been widely recognised as a technical problem strongly influenced by various political, legal, socio-cultural, environmental, and economic factors and by the resources available to tackle it. The primary purpose of waste management is to practice optimisation with a broader resource conservation goal [18]. Construction waste management helps redirect reusable materials to appropriate sites and redirect recyclable resources back to the manufacturing process. Project waste should be recognised as an integral part of overall materials management [21].
During the operation phase of a building, a considerable amount of waste is produced by the occupants. According to Illankoon and Lu [22], waste generated during the operational phase of buildings consists of:
-
Food waste.
-
Cardboard and paper.
-
Plastics (including bottles and other containers).
-
Glass (including green, brown, and clear).
-
Metals (including aluminium cans and tin cans).
Waste management plans in the operation phase of buildings is generally divided into the following stages [23]:
].
Buildings consume much energy during the operation phase [28]. Green building tools evaluate environmental designs and buildings’ performance during the design phase to predict energy savings during building operation and achieve sustainable development [29]. However, poor EM and/or harmful human interventions in design conditions during the operation phase could significantly reduce predicted energy savings in green buildings [13]. Appropriate EM could help diminish building users’ harmful interventions and achieve green building objectives. Therefore, it has persisted as a significant and contemplative issue for scholars to reduce increasing energy usage in recent decades [30].
This study focuses on the influence of EM on Green Building Performance (GBP) during the operation phase. It also uses and analyses data collected in previous studies in Malaysia by authors. The SmartPLS approach is used to illustrate the impact of EM on the performance of green office buildings. The current study develops a building performance framework based on these previous investigations. Additionally, various measurement items include benchmarking tools for specific building sectors. Table 1 shows EM items in the current study, which are adopted from the Canada Green Building rating [31]. The following section explains different factors of GBP.
Table 1. Energy management measurement.
| No | Measurement Item | Description |
|---|---|---|
| EM Advantage | ||
| the organisation takes advantage of utility and government incentive programs concerning energy. | ||
| 6 | EM Track | the organisation tracks project-level resource savings according to the International Performance Measurement and Verification Protocol (IPMVP) framework. |
| 7 | EM Performance | the organisation reports energy performance data to the management committee. |
| 8 | EM Provide | the organisation offers training and/or develops customised training programs to address capacity gaps in energy management. |
3. Green Building Performance (GBP)
In British Standard (BS) 5240, building performance is described as a behaviour that can be used to illustrate a building’s physical performance characteristics and its parts. Therefore, it is related to a building’s capability of contributing to fulfilling the functions of its envisioned utilisation. Building performance can play a crucial role in understanding how the building behaves [32]. Regarding building performance, numerous scenarios exist, with higher complexity than ever. Modern society is increasingly demanding efficient, functional, environmentally friendly, robust, adaptable, durable, beautiful, comfortable, and healthy buildings. The environment is degrading at a worrying rate that puts continuous pressure on facility managers, engineers, builders, and architects to design and construct buildings capable of performing their best in every given condition [33]. As a result, obtaining and sharing knowledge concerning building performance is of high significance.
Green building is one of the measures that can relieve buildings’ effects on the environment, society, and the economy [34]. Green building refers to the design and construction of buildings that positively impact the environment [18]. Green buildings primarily aim to enhance the residents’ comfort and satisfaction while reducing environmental impacts and costs. GBP evaluates the green buildings’ performance at different baselines such as transportation, energy, water, operations and maintenance, occupant satisfaction, waste generation, and recycling [35]. According to Foliente and Becker [36] and Hitchcock [37], there are several assessments of GBPs to achieve sustainable development. A review of the most frequently used items available now is presented and compares the items related to GBP in the Malaysian context. The current study develops a framework that includes safety, health and hygiene, comfort, durability, and sustainability (see Table 2).
Table 2. Building performance dimensions.
| Measurement Items | Description |
|---|
| 1 | ||||
| EM Provide | 0.715 | |||
| EM Track | 0.750 | |||
| EM Vision | 0.566 |
- Occupier source segregation.
- Occupier deposit and storage.
- Bulk storage and on-site management.
-
On-site treatment and off-site removal.
-
End destination of wastes.
Briefly, organised and accurate waste management implementation decreases negative environmental impacts (e.g., litter and, to a lesser extent, contamination of soil and water, etc.) [23].
2.3. Energy Management
Energy Management’s (EM) principal objectives are the preservation of resources, preventing climate change, and cutting costs, as well as guaranteeing simple and ingrained access for all to the energy spectrum [24]. According to Danish [25], building EM is a complex and multifaceted function that depends on various factors based on the type of building. It is the constant process of managing devices that consume energy to improve building energy performance while minimising energy usage. Building EM is feasible through desirable building design and management. It is a branch of building services engineering [26]. Besides the economic costs of EM, energy requires further expenses, mostly environmental and societal, associated with its resource and waste depletion and contribution to climate change.
EM programs consist of three processes: energy auditing, energy targeting, and energy planning. Energy auditing is the process of profiling energy usage and identifying the energy-saving opportunities critical in a systematic approach for decision-making in EM. A process that can be used to determine the percentage of energy efficiency and save energy, energy targeting, is possible from energy audit results. Energy planning is the process of making decisions regarding energy saving in the preliminary stage, including support for energy policies, organisational structure, and implementation [27
| References |
|---|
| EM vision |
| the organisation develops a vision statement that has the unambiguous target of reducing energy usage through specific activities and conveys them to all staff. |
| Safety | Buildings must enjoy safety. This issue is of high importance for architects, engineers, facilities, and building managers. To appraise the building performance regarding the building’s safety, we must determine those directly affected by safety conditions. | [36][37][38] |
| 0.530 | ||
[44][49]. Table 4 illustrates the results of the discriminant validity measurements. The value on the diagonals was greater than the inter-construct correlation in its respective row. Thus, there is no issue of discriminant validity in the measurement model. Additionally, the results indicate that the item is producing the highest loading on its respective constructs. Thus, discriminant validity has been established.
Table 4. The results of discriminant validity analysis.
| EM | GBP | ||||
|---|---|---|---|---|---|
| EM | 2 | EM Current | the organisation evaluates the existing state of EM, set objectives, and defines specific and measurable actions for continuous enhancement. | ||
| Health and Hygiene | The term “healthy building” implies the influence that the building can impose on the occupants. The sick building syndrome (SBS) issue resulted in an increasing demand for healthier buildings for occupants. Different researchers have recognised the significance of health in destroying the performance of a building. | [36][37][39] | 3 | EM Appointed | the organisation has appointed an energy manager. |
| Comfort | Indoor comfort is a crucial parameter for enhancing building performance. A building must arrange for an internal environment with an acceptable comfortability level, particularly in thermal, visual, and acoustics comfort areas. | [36][37][40] | 4 | EM Audit | |
| Durability | the organisation conducts an energy audit exercise. | ||||
| This covers the building materials’ durability, which is a significant aspect of the building performance. | [36][37][40] | 5 | |||
| Sustainability | Sustainability leads to diminishing energy usage and CO2 emissions. | [36][37] |
4. Impact of EM on GBP
This study uses data collected by Aghili [41] and interpreted them differently. The data was gathered from Malaysia green buildings to understand EM and building performance. Since data were gathered from a particular source, it is essential to check the standard method variance. As such, we conducted Harman’s single factor test by entering all the primary constructs in a component factor assessment.
The present study used sampling information due to easy access, geographical proximity, and availability at a specific time, and willingness to participate in the study. The respondents were Malaysian green building experts, managers, and facilitators certified by the green building index. A total of 89 certified green building managers, experts, and facilitators participated in this study. A structured survey questionnaire was developed to collect data.
Structural equation modeling (SEM) is a commanding statistical approach to model testing [42]. SEM is valuable since it helps the researcher test a number of hypothesised relationships simultaneously, makes available an indication of fit between the hypothesised model and actual data, and evaluates the alternative models [43]. SEM combines two approaches to model testing, i.e., factor analysis and multiple regression analysis. The regression analysis deals with the relationship between a criterion variable and predictor variables, while the factor analysis attempts to find a set of latent variables (i.e., factors). It explains the common variance that exists amongst a set of observed variables. The factor analysis is most commonly applied to determining the factor structure that underlies the scores in a set of questionnaire items [42][44]. Researchers consider two methods when SEM is applied: variance-based partial least squares and covariance-based techniques [45][46]. One of the most commonly used SEM variance-based approaches is Partial Least Squares (PLS) [46]. AMOS and LISREL applications could be used to exemplify covariance-based SEM analysis. PLS Graph and Smart-PLS could be used to implement SEM-PLS analysis. Accordingly, Smart-PLS software has been employed to achieve the research goal based on the research objective to investigate the relationship between variables and predict key target constructs. Furthermore, in this research, the sample size (N = 89) is small, and the research data is secondary as well. Therefore, SEM-PLS is well suited to this study. In this way, the current research examined the measurement model (validity and reliability) and the structural model (testing the relationship among variables).
4.1. Measurement Model
We analysed convergent validity and discriminant validity to evaluate the measurement model. The measurement model includes the unidirectional predictive relationships between each latent construct and its associated observed indicators.
4.1.1. Convergent Validity
Convergent validity refers to the degree that multiple items use in the research to measure the same concepts that are in agreement [44][47]. For reflective scale measurements, convergent validity is assessed through factor loadings of the items, average variance extracted (AVE), and composite reliability (CR) [48]. The results show that the factor loading of all the items is 0.5 or above, the AVEs of all the variables are greater than 0.5, and CR is above 0.7. Therefore, the convergent validity for scale analysis is achieved (Table 3). That way, it is feasible to determine the estimated model fit.
Table 3. The results of convert validity.
| Variable | Items | Factor Loadings | CR | AVE | Cronbach’s Alpha | ||||
|---|---|---|---|---|---|---|---|---|---|
| EM | EM Audit | 0.500 | 0.890 | 0.618 | 0.845 | ||||
| 0.786 | EM Advantage | 0.617 | |||||||
| EM Appointed | 0.806 | ||||||||
| EM Current | 0.723 | ||||||||
| EM Performance | 0.794 | GBP | Comfort | 0.819 | 0.857 | 0.552 | 0.791 | ||
| Durability | 0.870 | ||||||||
| Health and Hygiene | 0.762 | ||||||||
| Safety | Sustainability | 0.690 |
4.1.2. Discriminant Validity
Discriminant validity is the degree to which items distinguish between constructs. Two criteria are used to test discriminant validity in the current study, including Fornell–Larcker and cross-loadings [36][41][42]. Using the Fornell–Larcker criterion, results indicate that the square root of the average variance extraction is greater than the inter-construct correlations. Regarding the cross-loadings criterion, the factor loadings of each item or indicator must be greater than the rest of its cross-loadings to ensure the discriminant validity of the construct
| GPB | 0.549 | 0.743 |
Note: Square root of average variance extraction.
4.2. Structural Model
To assess the structural model (path relationship), the R2 value, standard beta, t-values through a bootstrapping process with a resample of 5000, the predictive applicability (Q2), and the effect sizes (f2) were considered [50]. As SEM-PLS’s goal is to explain the endogenous latent variance, the key target is to have a higher R2. The R2 value is the exogenous variable that can explain the variance in the percentage representatives of the research model’s predictive power and its values ranging between 0 and 1. The greater the value, the better the explanatory power of the model [51]. Cohen [52] argued that the values of R2 ranging between 0.02 and 0.12 could be considered weak, values ranging between 0.13 and 0.25 could be considered moderate, and values equal to or greater than 0.26 could be considered substantial as a rule of thumb. According to Hair and Ringle [46], R2 appropriateness depends on the research context. The results obtained in the present restudy show that the R2 value was 0.358. This indicates that 35% of the variation in green building performance is caused by EM.
SEM-PLS uses path coefficients to define the strength and importance of the hypothesised relationships between the latent construct. These path coefficients could also be considered standardised beta coefficients [49]. Typically, in PLS-SEM, the bootstrapping technique is used to analyse the t-value for the path coefficients to assess the importance of hypothesised connections [46][53][54]. The standardised range of the path coefficient values is between −1 and +1. The standard estimate path coefficients near to +1 signify a strong positive linear association and vice versa for negative values [44]. In theory, the p-value is a constant measure of evidence, but it is usually dichotomised approximately into highly important, marginally important, and not statistically important at conventional levels, with cut-offs at p ≤ 0.01, p ≤ 0.05, and p > 0.10 [55]. Table 5 shows a significant relationship between EM and GBP (path coefficient between energy management and GBP was 0.623; t-value was 7.851; p ≤ 0.01). Cohen’s f2 is used to recognise an appraisal of local effect size. Effect size evaluates the strength, size, or magnitude of the relationship between the latent variables. Based on the f2 value, the omitted construct’s effect size for an endogenous construct could be defined such that 0.02, 0.15, and 0.35 illustrate small, medium, and significant effects, respectively [56]. The results illustrate that the effective size is 0.557, demonstrating a significant correlation between EM and GBP. This means that the hypothesis was supported.
Table 5. The results of the structural model.
| Hypothesis | Relationship | Standard Beta | Standard Deviation | t-Value | f2 | R2 |
|---|---|---|---|---|---|---|
| H1 | EM ↔ GBP | 0.623 | 0.076 | 7.851 | 0.557 | 0.358 |
5. Conclusions and Prospects
The current study developed a building performance framework that included safety, health and hygiene, comfort, durability, and sustainability based on previous investigations. It has examined the direct influence of EM on the office building’s overall performance. The findings have revealed that EM plays a significant role in improving GBP. The study highlights the importance of EM in achieving sustainable development in developing countries. It encourages green building managers, experts, and facilitators to apply EM to improve GBP. That way, EM improves the performance of the green office building in conserving and protecting energy resources and cuts down on bills to achieve sustainable development.
Further research can discern other management practices and evaluate each parameter of GBP’s effects using comprehensive questionnaires that include closed and open questions. Furthermore, future researchers can use interviewing as a tool to gather the required data. The research recommendation is to employ empirical studies to further investigate the relevance between a variety of dimensions of green building management key practice and green building performance.
References
- Hamdaoui, S.; Mahdaoui, M.; Allouhi, A.; El Alaiji, R.; Kousksou, T.; El Bouardi, A. Energy demand and environmental impact of various construction scenarios of an office building in Morocco. J. Clean. Prod. 2018, 188, 113–124. Hamdaoui, S.; Mahdaoui, M.; Allouhi, A.; El Alaiji, R.; Kousksou, T.; El Bouardi, A. Energy demand and environmental impact of various construction scenarios of an office building in Morocco. J. Clean. Prod. 2018, 188, 113–124.
- Jin, X.; Wu, J.; Mu, Y.; Wang, M.; Xu, X.; Jia, H. Hierarchical microgrid energy management in an office building. Appl. Energy 2017, 208, 480–494. Jin, X.; Wu, J.; Mu, Y.; Wang, M.; Xu, X.; Jia, H. Hierarchical microgrid energy management in an office building. Appl. Energy 2017, 208, 480–494.
- Abediniangerabi, B.; Makhmalbaf, A.; Shahandashti, M. Deep learning for estimating energy savings of early-stage facade design decisions. Energy AI 2021, 5, 100077. Abediniangerabi, B.; Makhmalbaf, A.; Shahandashti, M. Deep learning for estimating energy savings of early-stage facade design decisions. Energy AI 2021, 5, 100077.
- Fan, Y.; Ito, K. Integrated building energy computational fluid dynamics simulation for estimating the energy-saving effect of energy recovery ventilator with CO2 demand-controlled ventilation system in office space. Indoor Built Environ. 2014, 23, 785–803. Fan, Y.; Ito, K. Integrated building energy computational fluid dynamics simulation for estimating the energy-saving effect of energy recovery ventilator with CO2 demand-controlled ventilation system in office space. Indoor Built Environ. 2014, 23, 785–803.
- Shen, J.; Zhang, X.; Yang, T.; Tang, L.; Wu, Y.; Pan, S.; Wu, J.; Xu, P. The early design stage of a novel Solar Thermal Façade (STF) for building integration: Energy performance simulation and socio-economic analysis. Energy Procedia 2016, 96, 55–66. Shen, J.; Zhang, X.; Yang, T.; Tang, L.; Wu, Y.; Pan, S.; Wu, J.; Xu, P. The early design stage of a novel Solar Thermal Façade (STF) for building integration: Energy performance simulation and socio-economic analysis. Energy Procedia 2016, 96, 55–66.
- Rezaee, R.; Vakilinezhad, R.; Haymaker, J. Parametric framework for a feasibility study of zero-energy residential buildings for the design stage. J. Build. Eng. 2021, 35. Rezaee, R.; Vakilinezhad, R.; Haymaker, J. Parametric framework for a feasibility study of zero-energy residential buildings for the design stage. J. Build. Eng. 2021, 35.
- Hu, M. Net Zero Energy Building: Predicted and Unintended Consequences; Routledge: Abingdon, UK, 2019. Hu, M. Net Zero Energy Building: Predicted and Unintended Consequences; Routledge: Abingdon, UK, 2019.
- Lechner, N.; Wallace, C. Heating, Cooling, Lighting: Sustainable Design Methods for Architects, 4th ed.; Wiley: Hoboken, NJ, USA, 2015. Lechner, N.; Wallace, C. Heating, Cooling, Lighting: Sustainable Design Methods for Architects, 4th ed.; Wiley: Hoboken, NJ, USA, 2015.
- Garg, V.; Mathur, J.; Bhatia, A. Building Energy Simulation: A Workbook Using DesignBuilder; CRC Press: Boca Raton, FL, USA, 2017. Garg, V.; Mathur, J.; Bhatia, A. Building Energy Simulation: A Workbook Using DesignBuilder; CRC Press: Boca Raton, FL, USA, 2017.
- Kerdan, I.G.; Raslan, R.; Ruyssevelt, P.; Gálvez, D.M. An exergoeconomic-based parametric study to examine the effects of active and passive energy retrofit strategies for buildings. Energy Build. 2016, 133, 155–171. Kerdan, I.G.; Raslan, R.; Ruyssevelt, P.; Gálvez, D.M. An exergoeconomic-based parametric study to examine the effects of active and passive energy retrofit strategies for buildings. Energy Build. 2016, 133, 155–171.
- Kusimo, H.; Oyedele, L.; Akinade, O.; Oyedele, A.; Abioye, S.; Agboola, A.; Mohammed-Yakub, N. Optimisation of resource management in construction projects: A big data approach. World J. Sci. Technol. Sustain. Dev. 2019.
- Graham, P. Building Ecology: First Principles for a Sustainable Built Environment; John Wiley & Sons: Hoboken, NJ, USA, 2009.
- Amirkhani, M. Innovative Integrated Window Design with Electric Lighting Design System to Reduce Lighting Intervention in Office Buildings; Queensland University of Technology: Brisbane, Australia, 2018.
- Amirkhani, M.; Garcia-Hansen, V.; Isoardi, G.; Allan, A. Innovative window design strategy to reduce negative lighting interventions in office buildings. Energy Build. 2018, 179, 253–263.
- Al-Qawasmi, J.; Asif, M.; El Fattah, A.A.; Babsail, M.O. Water efficiency and management in sustainable building rating systems: Examining variation in criteria usage. Sustainability 2019, 11, 2416.
- Gray, S.; Semiat, R.; Duke, M.; Rahardianto, A.; Cohen, Y. Reference module in earth systems and environmental sciences. In Seawater Use Desalination Technology; Elsevier: Amsterdam, The Netherlands, 2011; pp. 73–109.
- Kumar, D.P.; Satish, A.; Asadi, S. An analytical approach for evaluation of land resources management in construction industry—A model study. Int. J. Civ. Eng. Technol. 2018, 9, 105–114.
- Ribić, B.; Voća, N.; Ilakovac, B. Concept of sustainable waste management in the city of Zagreb: Towards the implementation of circular economy approach. J. Air Waste Manag. Assoc. 2017, 67, 241–259.
- Amasuomo, E.; Baird, J. The concept of waste and waste management. J. Mgmt. Sustain. 2016, 6, 88.
- Lu, W.; Chi, B.; Bao, Z.; Zetkulic, A. Evaluating the effects of green building on construction waste management: A comparative study of three green building rating systems. Build. Environ. 2019, 155, 247–256.
- Kubba, S. Green Construction Project Management and Cost Oversight; Butterworth-Heinemann: Oxford, UK, 2010.
- Illankoon, I.C.S.; Lu, W. Cost implications of obtaining construction waste management-related credits in green building. Waste Manag. 2020, 102, 722–731.
- Byrne, I. Construction Phase & Operational Phase Waste Management Plan—GlencairnSHD Residential Development. 2018. Available online: (accessed on 16 June 2021).
- Islam, M.; Hasanuzzaman, M. Introduction to energy and sustainable development. In Energy for Sustainable Development; Elsevier: Amsterdam, The Netherlands, 2020; pp. 1–18.
- Danish, M.S.S.; Senjyu, T.; Ibrahimi, A.M.; Ahmadi, M.; Howlader, A.M. A managed framework for energy-efficient building. J. Build. Eng. 2019, 21, 120–128.
- Moss, K. Energy Management in Buildings; Taylor & Francis: Abingdon, UK, 2006.
- Ahmad, A.S.; Hassan, M.Y.; Abdullah, H.; Rahman, H.A.; Majid, M.S.; Bandi, M. Energy efficiency measurements in a Malaysian public university. In Proceedings of the 2012 IEEE International Conference on Power and Energy (PECon), Kota Kinabalu, Malaysia, 2–5 December 2012; pp. 582–587.
- Amaral, R.E.; Brito, J.; Buckman, M.; Drake, E.; Ilatova, E.; Rice, P.; Sabbagh, C.; Voronkin, S.; Abraham, Y.S. Waste Management and Operational Energy for Sustainable Buildings: A Review. Sustainability 2020, 12, 5337.
- Mohammad, I.S.; Zainol, N.N.; Abdullah, S.; Woon, N.B.; Ramli, N.A. Critical factors that lead to green building operations and maintenance problems in Malaysia. Theor. Empir. Res. Urban Manag. 2014, 9, 68–86.
- Shaikh, P.H.; Nor, N.B.M.; Sahito, A.A.; Nallagownden, P.; Elamvazuthi, I.; Shaikh, M. Building energy for sustainable development in Malaysia: A review. Renew. Sustain. Energy Rev. 2017, 75, 1392–1403.
- Natural Resources Canada. Energy Management Best Practices Guide for Commercial and Institutional Buildings; Natural Resources Canada: Ottawa, ON, Canada, 2015.
- Douglas, J. Building performance and its relevance to facilities management. Facilities 1996.
- Fleming, D. Facilities management: A behavioural approach. Facilities 2004.
- Zuo, J.; Zhao, Z.-Y. Green building research–current status and future agenda: A review. Renew. Sustain. Energy Rev. 2014, 30, 271–281.
- Henderson, J.; Fowler, K. Assessing green building performance a post occupancy evaluation of 14 air force buildings. Rep. Prep. US Dep. Energy 2014.
- Foliente, G.C.; Becker, R. CIB PBBCS proactive programme—Task 1. In Compendium of Building Performance Models; CSIRO Building; Construction and Engineering: Victoria, Australia, 2001.
- Hitchcock, R.J. High performance commercial building systems program, Element 2 Project 2.1-Task 2.1.2. In Standardized Building Performance Metrics; Final Report; Building Technology Department, Lawrence Berkeley National Laboratory: Berkeley, CA, USA, 2002.
- Preiser, W.F.; Schramm, U. Intelligent office building performance evaluation. Facilities 2002.
- Preiser, W.F.E.; Vischer, J.C. Assessing Building Performance; Butterworth-Heinemann: Oxford, UK, 2005.
- Douglas, J. Developments in appraising the total performance of buildings. Struct. Surv. 1994.
- Aghili, N. Green Building Management Practices Model for Malaysia Green Building; Universiti Teknologi Malaysia: Skudai, Malaysia, 2018.
- Biddle, S.J.H.; Markland, D.; Gilbourne, D.; Chatzisarantis, N.L.D.; Sparkes, A.C. Research methods in sport and exercise psychology: Quantitative and qualitative issues. J. Sports Sci. 2001, 19, 777–809.
- Bolino, M.C.; Varela, J.A.; Bande, B.; Turnley, W.H. The impact of impressio—Management tactics on supervisor ratings of organizational citizenship behavior. J. Organ. Behav. Int. J. Ind. Occup. Organ. Psychol. Behav. 2006, 27, 281–297.
- Hair, J.F., Jr.; Hult, G.T.M.; Ringle, C.; Sarstedt, M. A Primer on Partial Least Squares Structural Equation Modeling (PLS-SEM); Sage Publications: London, UK, 2016.
- Chin, W.W. The partial least squares approach to structural equation modeling. Mod. Methods Bus. Res. 1998, 295, 295–336.
- Hair, J.F.; Ringle, C.M.; Sarstedt, M. PLS-SEM: Indeed a silver bullet. J. Mark. Theory Pract. 2011, 19, 139–152.
- Ramayah, T.; Lee, J.W.C.; In, J.B.C. Network collaboration and performance in the tourism sector. Serv. Bus. 2011, 5, 411–428.
- Hair, J.; Black, W.; Babin, B.; Anderson, R.; Tatham, R. Multivariate Data Analysis, 6th ed.; Pearson Prentice Hall: Upper Saddle River, NJ, USA, 2006.
- Götz, O.; Liehr-Gobbers, K.; Krafft, M. Evaluation of structural equation models using the partial least squares (PLS) approach. In Handbook of Partial Least Squares; Springer: Berlin/Heidelberg, Germany, 2010; pp. 691–711.
- Hair, J.F., Jr.; Sarstedt, M.; Hopkins, L.; Kuppelwieser, V.G. Partial least squares structural equation modeling (PLS-SEM): An emerging tool in business research. Eur. Bus. Rev. 2014, 26, 106–121.
- Huang, C.-C.; Wang, Y.-M.; Wu, T.-W.; Wang, P.-A. An empirical analysis of the antecedents and performance consequences of using the moodle platform. Int. J. Inf. Educ. Technol. 2013, 3, 217.
- Cohen, J. Statistical Power Analysis for the Behavioral Sciences, 2nd ed.; Erlbaum Associates: Hillsdale, MI, USA, 1988.
- Efron, B. Bootstrap methods: Another look at the jackknife. In Breakthroughs in Statistics; Springer: Berlin/Heidelberg, Germany, 1992; pp. 569–593.
- Yung, Y.F.; Bentler, P.M. Bootstrap—Corrected ADF test statistics in covariance structure analysis. Br. J. Math. Stat. Psychol. 1994, 47, 63–84.
- Rice, W.R. Analyzing tables of statistical tests. Evolution 1989, 43, 223–225.
- Wong, K.K.-K. Partial least squares structural equation modeling (PLS-SEM) techniques using SmartPLS. Mark. Bull. 2013, 24, 1–32.