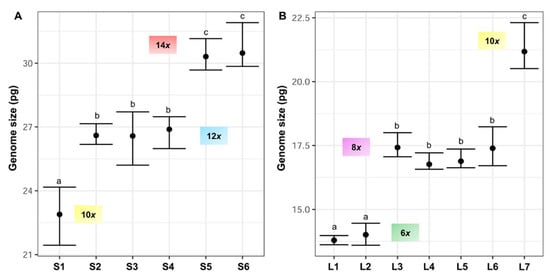
Nuclear 2C DNA content has been estimated for the first time in
F. yvesii subsp.
lagascae. The holoploid genome size estimates obtained were significantly different (up to 2.35-fold) for the two subspecies studied. The lowest 2C values were observed for
Festuca yvesii subsp.
lagascae, ranging from 13.60 to 22.31 pg, while the highest 2C values were found in the
F. yvesii subsp.
summilusitana individuals, ranging from 21.44 to 31.91 pg (, ). The analysis of variance (ANOVA) revealed significant differences between the 2C values (F
12,81 = 837.8,
p < 0.0001) at the subspecies level. Variability in genome size was found among the populations studied, with a maximum variation of 1.33-fold in the subsp.
summilusitana (S1 vs. S6) and 1.54-fold in the subsp.
lagascae (L1 vs. L7) (). Nevertheless, genome size estimates were homogeneous among individuals, with an average variation of 5.9%.
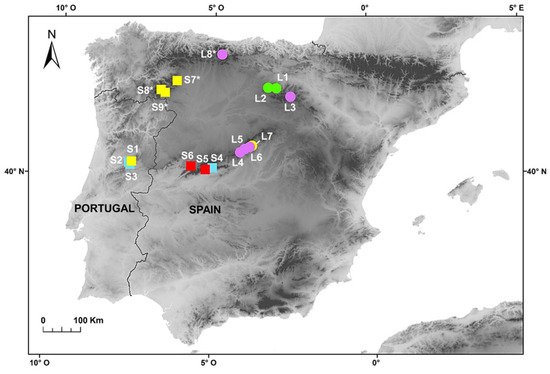
Figure 4. Holoploid genome size range and mean (2C values, in picograms) in the sampled populations of (A) F. yvesii subsp. summilusitana (S1–S6) and (B) F. yvesii subsp. lagascae (L1–L7). DNA-ploidy levels are marked (6x, 8x, 10x, 12x and 14x). Only estimates from fresh material are represented. Abbreviations (S1–S6 and L1–L7) correspond to the populations indicated in . Significant differences among populations at p < 0.05 are denoted by different letters.
Variation in DNA content was not continuous and five nonoverlapping DNA-ploidy levels were identified (
Figure 4): hexaploids (2C = 13.60–14.46 pg), octoploids (2C = 16.57–18.23 pg), decaploids (2C = 20.51–24.17 pg), dodecaploids (2C = 25.20–27.71 pg) and tetradecaploids (2C = 29.68–31.91 pg).
Specifically,
F. yvesii subsp.
summilusitana individuals fell within ploidy levels of 10
x (S1), 12
x (S2, S3 and S4) and 14
x (S5 and S6) (
Figure 1 and A), while individuals of
F. yvesii subsp.
lagascae had nuclear DNA contents that fell within ploidy levels of 6
x (L1 and L2), 8
x (L3, L4, L5 and L6) and 10
x (L7) ( and B). Noticeably, the DNA content of dodecaploids was slightly less than twice that of hexaploids ().
The silica-gel-dried leaves yielded peaks of sufficient quality to assign DNA-ploidy level, although CVs were often higher (mean CVs = 4.9%). The preliminary estimates of dry individuals from northwestern populations of
F. yvesii subsp.
summilusitana (2C = 23.01–25.84 pg; S7, S8 and S9) fell within the same DNA content group as populations inferred as 10
x, and those of
F. yvesii subsp.
lagascae (L8) were within the 8
x range (, ). It should be noted that the dry samples always showed genome size estimates larger than the fresh samples with the same ploidy level, with a difference of up to 1.93 pg for the subsp.
summilusitana (S1 vs. S9) and up to 2.55 pg for the subsp.
lagascae (L4 vs. L8) ().
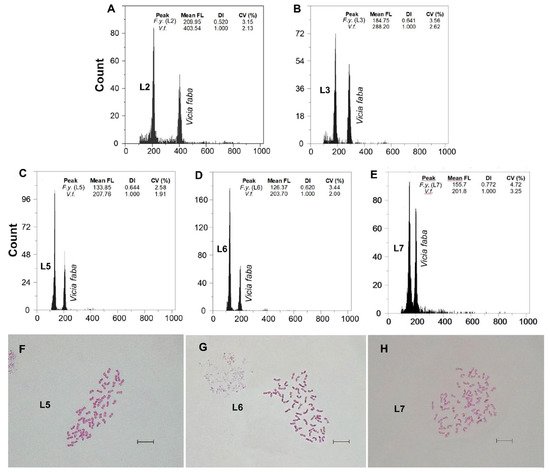
The karyological screenings carried out confirmed the ploidy level detected by FCM (Table 2, Figures 2F–H and 3F–H). The Spearman rank correlation showed a strong positive correlation between 2C nuclear DNA content and the chromosome number observed. New cytotypes were detected on the basic chromosome number. Unexpectedly high ploidy levels were detected for the
F. yvesii subsp.
summilusitana populations from the centre-west of the Iberian Peninsula (Table 2): Puerto del Pico population (S4) was dodecaploid (2n = 12
x = 84; Figure 2F), while Plataforma de Gredos (S5) and La Covatilla (S6) were tetradecaploid (2n = 14
x = 98; Figure 2G,H), the highest chromosome number reported in the
Festuca genus to date
. Two new somatic numbers were found for
F. yvesii subsp.
lagascae: 2n = 56 in the individuals from Puerto de Guadarrama (L4), Puerto de Navacerrada (L5; Figure 3F) and Puerto de Morcuera (L6; Figure 3G), and 2n = 70 in those from Puerto de Canencia (L7; Figure 3H), i.e., octoploid and decaploid, respectively (Table 2). In line with the FCM analyses, non-mixed-ploidy populations were detected.
4. Morphological Variation
In general, the largest sizes for all the characters were found in the subsp. summilusitana, with the exception of the auricle and awn lengths. In both subspecies, most of the morphological traits increased in size with increasing ploidy; however, no significant differences were observed with respect to all ploidy levels. The lemma, upper glume and seed lengths in particular responded significantly to changes in ploidy in both subspecies. The differences observed in the arithmetic mean obtained for most of the characters are significant only among the most extreme cytotypes of each subspecies, and even in these cases, the ranges of variation overlap.