Your browser does not fully support modern features. Please upgrade for a smoother experience.
Please note this is a comparison between Version 2 by Lily Guo and Version 3 by Lily Guo.
Vaccine hesitancy is a complex health problem, with various factors involved including the influence of an individual’s network. According to the Social Contagion Theory, attitudes and behaviours of an individual can be contagious to others in their social networks.
- Vaccination Attitudes
- vaccination
- review
1. Introduction
Vaccination attitudes and uptake can spread within networks and influenced by each individual’s social contacts [1]. According to the Social Contagion Theory, an individual can exhibit behaviour modelled by another person or adopt the attitudes of members of their social network [2][3][4]. For example, the food choices of one spouse can predict similar food choices of the other spouse [5], and having an obese spouse can predict by up to 40% whether the other spouse will become obese [6]. Therefore, the Social Contagion Theory can inform our understanding on how one’s health outcomes can be influenced by their social network and how attitudes and behaviours are transmitted from one individual to another [7]. This can be translated to vaccination research and policy where understanding how vaccination attitudes and uptake are spread within social networks can inform public health policies and interventions to improve vaccination rates.
A number of network topological features are involved in social transmission of attitudes and behaviours within a network including social ties (i.e., the relationship between individuals such as friendships) and the quality of the relationships [2]. Further, social transmission can be influenced by the position of a person within a network such as the person’s centrality, which may influence attitudes and behaviours to a greater extent than those who are in the periphery of the network [8]. For example, in one study [9], adolescents who were more centrally located in the network of friends and siblings were more influential upon other adolescents’ drug use and sleep outcomes than those who were not at the core of the network. Another topological feature influencing social transmission consists of clustering between individual behaviours in a social network (i.e., co-occurrence of a trait of interest among network members) which is quite prevalent across physical exercise, happiness and obesity [2]. Clustering might occur as a compendium of multiple reasons including: (a) homophily of preferences which refers to the tendency of similar individuals to connect with each other [4][10][11], (b) social influence whereby social network members might exert causal social influence on the attitudes and behaviours of the individual [2][11], (c) confounding factors which refers to the propensity that certain areas of a social network are subject to same externalities [4], and (d) simultaneity which refers to the tendency for connected individuals in a social network to co-influence each other [4].
The way that attitudes and behaviours are spread have been examined in both egocentric and sociocentric networks. Egocentric refer to networks of individuals that are mapped with information provided on their ties and sociocentric are networks that entail the interactions of all members of a community or group [7]. Specifically, there have been studies examining the spread of happiness [11], food choices [5], obesity [6], smoking [12], depression [8], alcohol consumption [13], and most recently of social distancing behaviours during the COVID-19 pandemic [14] in several social networks. A significant effect of social networks in individuals’ attitudes and behaviours was identified in all studies [5][6][8][11][12][13][14]. For example, in a longitudinal sociocentric study [12], a sibling, friend or spouse who stopped smoking influenced the decrease in an individual’s smoking by 25–67%.
Vaccination attitudes and uptake may also spread within social networks. A decision to vaccinate or not is usually made based on local vaccine policies, information from social media, as well as an individual’s social network [15][16]. The rates of under-vaccinated adults and children are increasing and this can be attributed to vaccination hesitancy [15][16], which refers to the delay in accepting or refusing vaccination despite its availability [16]. Vaccination hesitancy is an important and complex problem that contributes to outbreaks of diseases and to increased mortality rates [15][16][17]. Examining the influence of social networks in individuals’ vaccination attitudes and uptake is particularly of importance given that at present the world is in the midst of a pandemic for which vaccines are produced and appear to be the only solution to manage the COVID-19 pandemic. For vaccination programs to be successful, a critical mass of the population needs to receive the vaccine, thus the spread of vaccination hesitancy is a major barrier that governments are facing globally.
2. Description of Methodology and Analytical Approach
Most of the included studies used social network analysis to examine influence of social networks on vaccination attitudes and uptake (n = 7, 63.6%) and with the remaining using logistic regression models (n = 4, 36.4%). Convenience sampling methodology (n = 10, 91.0%) was mostly used followed by stratified sampling (n = 1, 9.0%). Most studies collected data using online or paper-based questionnaires (n = 8, 72.7%) and interviews (n = 3, 27.3%). All studies used egocentric networks to examine the outcomes of vaccination attitudes and uptake. Findings of each study are outlined in Table 1.
Table 1. Results of studies on the influence of social network members on individuals’ vaccination attitudes and uptake.
| Study | Analytical Approach | Social Contagion Results | Impact of Social Networks on Vaccinations | Other Findings | ||
|---|---|---|---|---|---|---|
| Clustering 1 | Centrality 2 | Homophily 3 | ||||
| Childhood vaccinations (n = 4) | ||||||
| Brunson (2013) [18] | SNA:
|
NR | NR | NR | Non-vaccination increased when having more non-conformers 4 in network (OR = 30.57, CI: 5.75–162.65). | Non-conformers 4 were more likely to have higher education (i.e., graduate degree; OR = 5.34, CI: 1.05–27.08) |
| Fu et al. (2019) [19] | LR:
|
NR | NR | Participants tended to have similar social networks to themselves:
| ||
][28] found that participants held more positive attitudes towards self and childhood vaccinations when they were discussing them with family and friends/peers who held similar attitudes, or when they perceived their family and friends/peers holding positive attitudes towards self and childhood vaccinations. Vaccination uptake for self or children increased when the individuals’ network was comprised mostly by vaccinated family and friends [19][21][27] or when parents observed their peers vaccinating their child [20]. Conversely, vaccination uptake for self or children decreased if family and friends were vaccine hesitant or held negative attitudes toward vaccinations [19][28]. Moreover, in a sample of foundation doctors, participants were more likely to get vaccinated when they had a higher number of vaccinated neighbours in their network [24]. Additionally, in a sample of individuals working together in organizations (e.g., health and social services, financial services), they were more likely to get vaccinated when they perceived their co-workers holding positive attitudes towards vaccinations [25].
Regarding mechanisms underlying transmission within networks, frequency of communication between network members and prolonged exposure to positive (e.g., safety, effectiveness) or negative (e.g., dangerous, ineffectiveness) self and childhood vaccination attitudes explained transmission in social networks. Specifically, participants held more positive attitudes towards self and childhood vaccinations and greater likelihood to get vaccinated or vaccinate their child when they were more frequently exposed to positive vaccination attitudes than negative [19][27]. In addition, participants were more likely to vaccinate their child when they frequently discussed vaccinations with family and friends who held positive vaccination attitudes [20]. Self-vaccination also increased when participants felt that their significant others wanted them to be vaccinated or when they wanted to comply with the vaccination behaviour of their social networks [25][28].
Clustering of attitudes was identified in a sample of co-workers, with participants tending to share similar vaccination attitudes with people working within the same group [25]. Participants were more likely to get vaccinated when people working within the same group were vaccinated or when they perceived them as supporters of vaccinations. In contrast, no clustering was identified in university students, with vaccinated students being as likely as non-vaccinated students to be friends [23]. Centrality evidence was only reported by one study [20], in which it was found that the centrality of peers and opinion leaders (i.e., political, religious and traditional medicine providers) within social networks did not influence mothers’ behaviour to vaccinate their children.
Further, homophily was found to influence the transmission of vaccination attitudes and uptake within social networks [19][20][26][21]. Out of the five (45.5%) studies that reported results on homophily, four (80.0%) observed the presence of homophily in the social network, with race/ethnicity reported by all studies influencing the formation of networks [19][20][26][21]. Additionally, members of social networks presented with similarities in educational level, and parental and marital status [19][20][26][21]. For example, Goldberg [20] and Fu et al. [19] identified that peers who influenced parents’ decision to vaccinate their children were more likely to be of the same race/ethnicity (African Americans, Muslims, Hausa), gender (females), marital status (married), be parents, and with similar educational level (no formal education). Furthermore, Mascia et al. [21] found that vaccinated children tended to have other vaccinated children in their networks with similar ethnicity and class. Hernandez et al. [26], found that pregnant women with their first child tended to have a social network with similar education, with well-educated women having a well-educated network supporting vaccination uptake. Therefore, individuals tend to have homogeneous networks (see Figure 2 for a summary of the mechanisms). Suggestions for further research based on the type of network, vaccination and attitude are presented in Table 2.
Table 2. Needs for further research based on types of social network, vaccinations and attitudes.
| Study | Analytical Approach | Social Contagion Results | Impact of Social Networks on Vaccinations | Other Findings | ||||||||
|---|---|---|---|---|---|---|---|---|---|---|---|---|
| Clustering 1 | Centrality 2 | Homophily 3 | ||||||||||
| Childhood vaccinations (n = 4) | ||||||||||||
| Brunson (2013) [23] | SNA:
|
NR | NR | NR | Non-vaccination increased when having more non-conformers 4 in network (OR = 30.57, CI: 5.75–162.65). | Non-conformers 4 were more likely to have higher education (i.e., graduate degree; OR = 5.34, CI: 1.05–27.08) | ||||||
|
|
| ||||||||||
| Fu et al. (2019) [28] | LR:
|
NR | NR | Participants tended to have similar social networks to themselves:
|
|
The vaccine advice networks were small, dense, family centric, and homophilous. | ||||||
|
|
|
The vaccine advice networks were small, dense, family centric, and homophilous. | Goldberg (2014) [20] | ||||||||
| Goldberg (2014) [29 | SNA:
|
NR | Centrality did not predict vaccination uptake | ] | Participants tend to have similar peers in networks:
|
|
|
|
|
| ||
| SNA: |
|
|
Mascia et al. (2020) [21] | |||||||||
| Mascia et al. (2020) [30] | SNA:
|
NR | NR | SNA:
| Vaccination uptake was more similar in students with the same ethnicity (OR = 5.39–6.13), different gender (OR = 0.84–0.87) and belonging to the same class (OR = 1.68–1.82). | Students were more likely to report similar vaccination uptake with friendship ties occurring after school rather than those established during school (OR = 1.47). | - | |||||
|
|
NR | NR | Vaccination uptake was more similar in students with the same ethnicity (OR = 5.39–6.13), different gender (OR = 0.84–0.87) and belonging to the same class (OR = 1.68–1.82). | Students were more likely to report similar vaccination uptake with friendship ties occurring after school rather than those established during school (OR = 1.47). | - | Self-vaccination (n = 7) | |||||
| Self-vaccination (n = 7) | ||||||||||||
| Casillas et al. (2011) [22] | LR:
|
NR | NR | NR | Participants were more likely to perceive the vaccine as effective:
| |||||||
| Casillas et al. (2011) [24] | LR:
|
|
|
NR | Having high school education as the highest education level decreased the odds of perceived vaccine effectiveness compared to no school and college levels (OR = 0.47, 95% CI: 0.23–0.96) | |||||||
| NR | NR | Participants were more likely to perceive the vaccine as effective: |
|
|
Having high school education as the highest education level decreased the odds of perceived vaccine effectiveness compared to no school and college levels (OR = 0.47, 95% CI: 0.23–0.96) | Edge et al. (2015) [23] | SNA:
| |||||
| Edge et al. (2015) [25] |
|
SNA:
|
| No clustering observed between vaccinated and non-vaccinated individuals |
| NR |
| NR | Participants were more likely to get vaccinated if they perceived their peers as being vaccinated (no statistical information reported). | - | ||
| No clustering observed between vaccinated and non-vaccinated individuals | NR | NR | Participants were more likely to get vaccinated if they perceived their peers as being vaccinated (no statistical information reported). | - | Edge et al. (2019) [24] | |||||||
| Edge et al. (2019) [26] | SNA:
|
SNA:
|
| NR |
| NR | No homophily observed (Assortativity = −0.03, 95% CI: −0.12–0.10) | Participants were more likely to get vaccinated if they had a higher proportion of vaccinated neighbors in their social network (OR = 2.63, 95% CI: 1.28 −5.38). | - | |||
| NR | NR | No homophily observed (Assortativity = −0.03, 95% CI: −0.12–0.10) | Participants were more likely to get vaccinated if they had a higher proportion of vaccinated neighbors in their social network (OR = 2.63, 95% CI: 1.28 −5.38). | - | Frank (2011) [25] | |||||||
| Frank (2011) [27] | SNA:
|
People in the same working group in the company | NR | NR | SNA:
|
|
People in the same working group in the company | NR | NR |
| - | |
|
|
|
|
- | Hernandez, Pullen and Brauer (2019) [26] | SNA:
|
NR | |||||
| Hernandez, Pullen and Brauer (2019) [31] | SNA:
| NR | Well-educated women tend to have well-educated networks who support vaccination uptake |
|
NR | NR | Well-educated women tend to have well-educated networks who support vaccination uptake |
| - | |||
| - | Nyhan et al. (2012) [27] | ||||||||||
| Nyhan et al. (2012) [ | LR:
|
NR | NR | NR | 32] | LR:
|
|
NR | NR | NR |
| - |
| Ruiz (2015) [28] | LR:
|
NR | NR | NR | Higher vaccination uptake, compared to non-vaccination, was associated with:
|
Vaccinated participants were more likely to trust family members (75%) for information about vaccines compared to non-vaccinated (60%) (p < 0.05 | ||||||
3. Transmission of Vaccination Attitudes and Uptake within Social Networks
Across studies, vaccination attitudes and uptake of participants were highly influenced by their social networks (see Figure 1 2 for a summary). Positive attitudes on self and childhood vaccinations were influenced by social networks’ positive attitudes [22][23][25][19][20][26][27][28], whereas having vaccinated people in networks was related to increased likelihood of participants to be vaccinated [24] or vaccinate their child [20]. Similarly, negative attitudes and lower vaccination uptake were influenced by social networks’ negative attitudes and lower uptake [18][19][27][28]. Positive attitudes referred to beliefs that childhood vaccines are effective at protecting children, reduce the risk for developing a health condition (e.g., cancer), and are safe and effective [22][23][24][25][19][20][26][27][28]. Negative attitudes referred to beliefs that vaccines are dangerous or unsafe, might cause symptoms and are in an experimental stage [19][27][28].
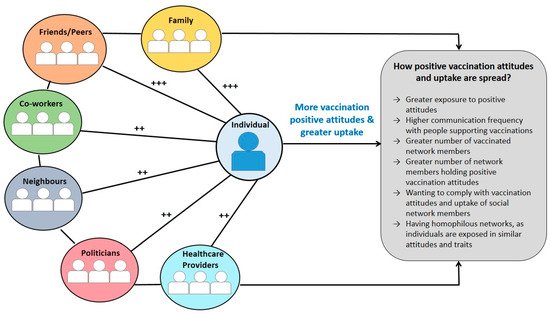
Figure 12. A summary of findings explaining how vaccination attitudes and uptake are transmitted within social networks. Note. ++ Lower influence on vaccination attitudes and uptake of individuals compared to other network members (family, peers and friends) based on the total number of studies reporting this information; +++ Higher influence on attitudes and vaccination uptake of individuals compared to other network members (neighbours, co-workers, politicians, healthcare providers) based on the total number of studies reporting this information.
Most of the included studies (n = 8, 72.7%) reported that family and friends/peers significantly influenced self and childhood vaccination attitudes and uptake. In contrast, only two studies (18.2%) reported that healthcare providers [20][27] and co-workers [18][25] and one study (9.0%) that politicians [20] significantly influenced vaccination attitudes and uptake. For example, Casillas et al. [22] reported that discussing about the vaccine with family and/or friends significantly increased the odds for perceiving the HPV vaccine as effective (Odds Ratio = 1.98, 95% CI: 1.04–3.78) compared to discussing them with the healthcare provider which had a non-significant effect (Odds Ratio = 1.71, 95% CI: 0.86–3.39) Some studies [22][23][19][20][27
| ||||||
| ||||||
| NR | Centrality did not predict vaccination uptake | Participants tend to have similar peers in networks:
| ||||
| - | ||||||
| Ruiz (2015) | ||||||
| [33] | LR:
|
NR | NR | NR | Higher vaccination uptake, compared to non-vaccination, was associated with:
|
Vaccinated participants were more likely to trust family members (75%) for information about vaccines compared to non-vaccinated (60%) (p < 0.05). |
4. Discussion
Eleven studies were identified in this review examining how self and childhood vaccination attitudes and uptake are spread within social networks. Our results suggest that social networks play an important role in shaping positive and negative attitudes and in vaccination uptake. Individuals held more positive attitudes and had a greater likelihood to either self-vaccinate or vaccinate their children if their network was mostly comprised by people holding positive attitudes (e.g., vaccination safety and effectiveness), were vaccinated, or were perceived as vaccine supporters. Frequent discussion on vaccinations with family and friends/peers who held positive attitudes or were vaccinated, and higher exposure to positive attitudes also increased the likelihood of vaccination uptake. In the same way, negative attitudes and lower vaccination uptake were transmitted within networks. Since all people are connected to other people, the effects of an intervention which is delivered to an individual might be indirectly diffused to their social network [29][31]. Clinicians and policymakers could consider network structure of for example communities and general practice patients, in order to result in higher diffusion of interventions’ effect.
It is important to note that by simply being exposed to or discussing vaccinations with others does not imply that an individual will adopt the same behaviour [30]. Social transmission is a complex process involving an individual’s knowledge, skills, motivation and attitudes, and opportunities provided by their network [1]. For example, according to the COM-B model [30], a behaviour change may occur when an individual has opportunities to enable the behaviour such as positive support from family and friends together with other attributes such as the psychological and physical capacity, capabilities and motivation to perform the behaviour. In addition, the Theory of Planned Behaviour (TPB) [32] suggests that the behavioural intentions for performing a behaviour are shaped by the beliefs of significant others and motivation to comply with them, positive or negative attitudes, and perceived behavioural control over the desired behaviour. Even if a person perceives the vaccine as effective and is available to them, if social network members do not perceive it as effective or are not vaccinated, vaccination hesitancy is more likely to occur [33]. High applicability of the COM-B and TPB concepts is observed in our review, as social influence and motivation to comply with the behaviour of significant others were evidenced, with some of the included studies reporting that vaccination uptake increased when participants wanted to comply with the vaccination behaviour of the network [25][28]. Individuals may also adopt the vaccination attitudes of their social network or get vaccinated as a result of social norms; to fit in or to be socially accepted [34][35][36]. Therefore, vaccination uptake should be understood as an interplay of factors involving not only the individual but also his social network.
Family and friends/peers appeared to have more influence on individuals’ attitudes and vaccination uptake than other members of social networks such as healthcare providers and neighbours. This is not uncommon among health outcomes as obesity has been found to be transmitted in a greater extent from those in the immediate environment of the person, siblings and spouses compared to neighbours [6]. The quality of the relationship and the frequency of communication with network members might be more critical in social transmission than the expertise, authority and knowledge of other network members; yet these have not been examined in relation to vaccine behaviours. Future studies can examine the factors underlying how family and friends/peers influence vaccination attitudes and uptake compared to other network members. In addition, clinicians and policymakers are recommended to include social network members in interventions or provide educational family-based programs on vaccinations. For other health behaviours such as smoking-cessation, programs that include peer support are more effective than those who do not involve social network members [31][37]. Further, including network members may result in greater diffusion of an intervention’s effects within networks than individual-based approaches as individuals tend to benefit from indirect exposure to an intervention [29].
Substantial homophily was identified in included studies, with race/ethnicity playing the most important role in forming social networks. Other factors identified being similar between network members were education level, parental and marital status. Existence of homophily within networks is a methodological challenge for researchers as it results into homogeneous samples with restrictions of including people from various backgrounds and thus possibly confound estimates of effects of social networks [38][39]. One way to overcome homophily is by conducting longitudinal studies in order to examine social networks dynamically over time [10]. Additionally, interventions or educational vaccination campaigns could be tailored to the target populations especially with ethnic minorities, who can hold specific beliefs and barriers to vaccination uptake and may not be influenced by individuals of other ethnic background. Tailored interventions are preferable by individuals, can be associated with better health outcomes and present with higher adherence [40][41][42]. For example, in parental populations, public health vaccination campaigns could emphasize the protection of their children from health conditions, whereas in non-parental populations could emphasize the protection of themselves and significant others. Targeting each network using recommendations for campaign messaging, such as the use of short, risk-reducing or relative risk framing messages with clear and simple language [41], could possibly reduce vaccine hesitancy. Furthermore, our evidence suggests that identifying and intervening to networks with predominantly negative attitudes towards vaccinations can also protect individuals in the network who hold neutral or positive attitudes.
Future studies can conduct longitudinal experimental research to better understand the mechanism of spread of vaccination attitudes and uptake, infer causal relationships, and determine how social networks are formed and function. In addition, although clustering was identified in one study [25], the mechanisms underlying clustering could not be understood as the research design was cross-sectional. Possible explanations of clustering might be due to homophily as individuals might have chosen to cluster with co-workers with similar vaccination attitudes, or induction as the members of the group might have exerted social influence on the individual [13]. In contrast, no clustering was identified within a medical student network [23], with vaccinated students being as likely as non-vaccinated students to be friends, possibly due to the way people make friends in younger ages as opposed to how they form or maintain relationships in older ages. In younger ages people tend to have a higher number of friendship networks with emphasis given on their common interests, compared to older ages with more emphasis given in mutual beliefs [43]. Future studies are advised to examine mechanisms underlying clustering. Additionally, future studies are suggested to examine the impact of specific sociodemographic characteristics such as age and gender in forming social networks and in the spread of vaccination attitudes and uptake as either were not examined in the included studies or mixed findings were observed (i.e., same vs. opposite gender) [19][21]. Based on promising findings of previous studies on the high impact of centrality in health behaviours such as depression [11], future studies are also advised to examine centrality in social networks and its influence on transmission of vaccination attitudes and uptake. Further, examining the influence of social networks using sociocentric networks is needed as all included studies used egocentric networks. Sociocentric networks may offer the opportunity for more robust evidence of contagion in entire networks as information are collected from both the individual and their network members [7]. Researchers interested in examining transmission of vaccination attitudes and uptake within social networks should additionally refer to Table 3 for specific recommendations for each type of network (e.g., family), vaccinations (e.g., HPV) and attitudes (positive vs. negative).
Limitations
As this study was a rapid scoping review, quality assessment of included studies was not conducted. Furthermore, the studies included a variety of populations (e.g., students, mothers, parents, children), making it more complex to assess or synthesize all studies under the same rubric. In addition, although we searched several databases, we may have missed some studies due to the inclusion of studies published only in English.
5. Conclusions
Vaccination attitudes and uptake can be highly influenced by ones’ social network. Being exposed to positive attitudes, frequently discussing vaccinations with family and friends/peers or wanting to comply with their behaviour increases the likelihood of an individual to get vaccinated or vaccinate their child. Homophily was observed within networks with individuals tending to have similar networks, especially in respect to race and ethnicity. Public health authorities and policymakers could consider including social networks of individuals when delivering interventions or educational campaigns on vaccinations to benefit members of the network who can be influenced negatively towards vaccinations. Tailoring interventions and campaigns to the target populations is strongly advised. Only then may vaccine hesitancy rates be reduced, contr
References
- Brunson, E.K. The impact of social networks on parents’ vaccination decisions. Pediatrics 2013, 131, e1397–e1404.
- Fu, L.Y.; Zimet, G.D.; Latkin, C.A.; Joseph, J.G. Social Networks for Human Papillomavirus Vaccine Advice among African American Parents. J. Adolesc. Health 2019, 65, 124–129.
- Goldberg, A.B. Norms within Networks: Opinion Leader and Peer Network Influences on Mothers/Caregivers’ Childhood Immunization Decisions in Rural Northern Nigeria. Ph.D. Thesis, Columbia University, New York, NY, USA, 2014.
- Mascia, D.; Iacopino, V.; Frisicale, E.M.; Iacovelli, A.; Boccia, S.; Poscia, A. The impact of school and after-school friendship networks on adolescent vaccination behavior. Vaccines 2020, 8, 55.
- Casillas, A.; Singhal, R.; Tsui, J.; Glenn, B.A.; Bastani, R.; Mangione, C.M. The Impact of Social Communication on Perceived HPV vaccine effectiveness in a low-income, minority population. Ethn. Dis. 2011, 21, 495–501.
- Edge, R.; Heath, J.; Rowlingson, B.; Keegan, T.J.; Isba, R. Seasonal influenza vaccination amongst medical students: A social network analysis based on a cross-sectional study. PLoS ONE 2015, 10, e0140085.
- Edge, R.; Keegan, T.; Isba, R.; Diggle, P. Observational study to assess the effects of social networks on the seasonal influenza vaccine uptake by early career doctors. BMJ Open 2019, 9, e026997.
- Frank, L.B. Contagious: Social Norms about Health in Work Group Networks; University of Southern California: Los Angeles, CA, USA, 2011.
- Hernandez, E.M.; Pullen, E.; Brauer, J. Social networks and the emergence of health inequalities following a medical advance: Examining prenatal H1N1 vaccination decisions. Soc. Netw. 2019, 58, 156–167.
- Nyhan, B.; Reifler, J.; Richey, S. The role of social networks in influenza vaccine attitudes and intentions among college students in the southeastern united states. J. Adolesc. Health 2012, 51, 302–304.
- Ruiz, J.B. Immunizing against Vaccine Hesitancy: An Assessment of Online Communication and Social Network Factors Impacting Vaccine Adoption; Unversity of California: Oakland, CA, USA, 2015.
- Christakis, N.A.; Fowler, J.H. The Collective Dynamics of Smoking in a Large Social Network. N. Engl. J. Med. 2008, 358, 2249–2258.
- Rosenquist, J.N.; Murabito, J.; Fowler, J.H.; Christakis, N.A. The spread of alcohol consumption behavior in a large social network. Ann. Intern. Med. 2010, 152, 426–433.
- Holtz, D.; Zhao, M.; Benzell, S.G.; Cao, C.Y.; Rahimian, M.A.; Yang, J.; Allen, J.; Collis, A.; Moehring, A.; Sowrirajan, T.; et al. Interdependence and the cost of uncoordinated responses to COVID-19. Proc. Natl. Acad. Sci. USA 2020, 117, 19837–19843.
- Dubé, E.; Laberge, C.; Guay, M.; Bramadat, P.; Roy, R.; Bettinger, J.A. Vaccine hesitancy: An overview. Hum. Vaccin. Immunother. 2013, 9, 1763–1773.
- Salmon, D.A.; Dudley, M.Z.; Glanz, J.M.; Omer, S.B. Vaccine hesitancy: Causes, consequences, and a call to action. Vaccine 2015, 33, D66–D71.
- World Health Organization. Report of the SAGE Working Group on Vaccine Hesitancy; World Health Organization: Geneva, Switzerland, 2014; Available online: (accessed on 1 January 2021).
- Brunson, E.K. The impact of social networks on parents’ vaccination decisions. Pediatrics 2013, 131, e1397–e1404.
- Fu, L.Y.; Zimet, G.D.; Latkin, C.A.; Joseph, J.G. Social Networks for Human Papillomavirus Vaccine Advice among African American Parents. J. Adolesc. Health 2019, 65, 124–129.
- Goldberg, A.B. Norms within Networks: Opinion Leader and Peer Network Influences on Mothers/Caregivers’ Childhood Immunization Decisions in Rural Northern Nigeria. Ph.D. Thesis, Columbia University, New York, NY, USA, 2014.
- Mascia, D.; Iacopino, V.; Frisicale, E.M.; Iacovelli, A.; Boccia, S.; Poscia, A. The impact of school and after-school friendship networks on adolescent vaccination behavior. Vaccines 2020, 8, 55.
- Casillas, A.; Singhal, R.; Tsui, J.; Glenn, B.A.; Bastani, R.; Mangione, C.M. The Impact of Social Communication on Perceived HPV vaccine effectiveness in a low-income, minority population. Ethn. Dis. 2011, 21, 495–501.
- Edge, R.; Heath, J.; Rowlingson, B.; Keegan, T.J.; Isba, R. Seasonal influenza vaccination amongst medical students: A social network analysis based on a cross-sectional study. PLoS ONE 2015, 10, e0140085.
- Edge, R.; Keegan, T.; Isba, R.; Diggle, P. Observational study to assess the effects of social networks on the seasonal influenza vaccine uptake by early career doctors. BMJ Open 2019, 9, e026997.
- Frank, L.B. Contagious: Social Norms about Health in Work Group Networks; University of Southern California: Los Angeles, CA, USA, 2011.
- Hernandez, E.M.; Pullen, E.; Brauer, J. Social networks and the emergence of health inequalities following a medical advance: Examining prenatal H1N1 vaccination decisions. Soc. Netw. 2019, 58, 156–167.
- Nyhan, B.; Reifler, J.; Richey, S. The role of social networks in influenza vaccine attitudes and intentions among college students in the southeastern united states. J. Adolesc. Health 2012, 51, 302–304.
- Ruiz, J.B. Immunizing against Vaccine Hesitancy: An Assessment of Online Communication and Social Network Factors Impacting Vaccine Adoption; Unversity of California: Oakland, CA, USA, 2015.
- Rulison, K.L.; Feinberg, M.; Gest, S.D.; Osgood, D.W. Diffusion of intervention effects: The impact of a family-based substance use prevention program on friends of participants. J. Adolesc. Health 2015, 57, 433–440.
- Christakis, N.A. Social networks and collateral health effects. BMJ 2004, 329, 184–185.
- Michie, S.; van Stralen, M.M.; West, R. The behaviour change wheel: A new method for characterising and designing behaviour change interventions. Implement. Sci. 2011, 6, 42.
- Icek, A. The Theory of Planned Behavior Organizational Behavior and Human Decision Processes. Organ. Behav. Hum. Decis. Process. 1991, 50, 179–211.
- Jacob, M.; Bradley, J.; Barone, M.A. Human papillomavirus vaccines: What does the future hold for preventing cervical cancer in resource-poor settings through immunization programs? Sex. Transm. Dis. 2005, 32, 635–640.
- Oraby, T.; Thampi, V.; Bauch, C.T. The influence of social norms on the dynamics of vaccinating behaviour for paediatric infectious diseases. Proc. R. Soc. B Biol. Sci. 2014, 281.
- Sinclair, S.; Agerström, J. Do Social Norms Influence Young People’s Willingness to Take the COVID-19 Vaccine? PsyArXiv 2021.
- Moehring, A.; Collis, A.; Garimella, K.; Rahimian, M.A.; Aral, S.; Eckles, D. Surfacing Norms to Increase Vaccine Acceptance. SSRN 2021, 1–33.
- Malchodi, C.S.; Oncken, C.; Dornelas, E.A.; Caramanica, L.; Gregonis, E.; Curry, S.L. The effects of peer counseling on smoking cessation and reduction. Obstet. Gynecol. 2003, 101, 504–510.
- Karimi, F.; Génois, M.; Wagner, C.; Singer, P.; Strohmaier, M. Homophily infuences ranking of minorities in social networks. Sci. Rep. 2018, 8, 11077.
- Centola, D.; Gonzalez-Avella, J.C.; Eguíluz, V.M.; San Miguel, M. Homophily, Cultural Drift, and the Co-Evolution of Cultural Groups. J. Confl. Resolut. 2007, 51, 905–929.
- Beck, C.; McSweeney, J.C.; Richards, K.C.; Roberson, P.K.; Tsai, P.F.; Souder, E. Challenges in tailored intervention research. Nurs. Outlook 2010, 58, 104–110.
- Lawes-Wickwar, S.; Ghio, D.; Tang, M.Y.; Keyworth, C.; Stanescu, S.; Westbrook, J.; Jenkinson, E.; Kassianos, A.P.; Scanlan, D.; Garnett, N.; et al. A rapid systematic review of public responses to health messages encouraging vaccination against infectious diseases in a pandemic or epidemic. Vaccines 2021, 9, 72.
- Ghio, D.; Lawes-Wickwar, S.; Tang, M.Y.; Epton, T.; Howlett, N.; Jekinson, E.; Stanescu, S.; Westbrook, J.; Kassianos, A.P.; Watson, D.; et al. What influences people’s responses to public health messages for managing risks and preventing infectious diseases? A rapid systematic review of the evidence and recommendations. PsyArXiv 2020.
- Wrzus, C.; Hänel, M.; Wagner, J.; Neyer, F.J. Social network changes and life events across the life span: A meta-analysis. Psychol. Bull. 2013, 139, 53–80.
More