Land cover patterns in sub-Saharan Africa are rapidly changing. This study aims to quantify the land cover change and to identify its major determinants by using the Drivers, Pressures, State, Impact, Responses (DPSIR) framework in the Ethiopian Gozamin District over a period of 32 years (1986 to 2018). Satellite images of Landsat 5 (1986), Landsat 7 (2003), and Sentinel-2 (2018) and a supervised image classification methodology were used to assess the dynamics of land cover change. Land cover maps of the three dates, focus group discussions (FGDs), interviews, and farmers’ lived experiences through a household survey were applied to identify the factors for changes based on the DPSIR framework. Results of the investigations revealed that during the last three decades the study area has undergone an extensive land cover change, primarily a shift from cropland and grassland into forests and built-up areas. Thus, quantitative land cover change detection between 1986 and 2018 revealed that cropland, grassland, and bare areas declined by 10.53%, 5.7%, and 2.49%. Forest, built-up, shrub/scattered vegetation, and water bodies expanded by 13.47%, 4.02%, 0.98%, and 0.25%. Household surveys and focus group discussions (FGDs) identified the population growth, the rural land tenure system, the overuse of land, the climate change, and the scarcity of grazing land as drivers of these land cover changes. Major impacts were rural to urban migration, population size change, scarcity of land, and decline in land productivity. The outputs from this study could be used to assure sustainability in resource utilization, proper land use planning, and proper decision-making by the concerned government authorities.
- Land cover change
- Remote Sensing
- Image Analysis
- Supervised Classification
- Maximum Likelihood
- DPSIR
Results
Land Cover
The results of land cover classification of Gozamin district for the years 1986, 2003, and 2018 are documented graphically in Figure 1. Quantitative details about the land cover in the respective years are presented in Table 1.
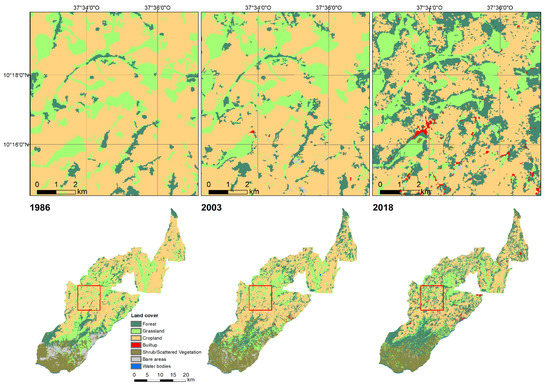
Land cover maps of Gozamin district for 1986, 2003, and 2018.
Total area coverage between the years 1986, 2003, and 2018 for the classified land cover categories.
| Land Cover Type | Area | |||||
|---|---|---|---|---|---|---|
| 1986 | 2003 | 2018 | ||||
| (ha) | (%) | (ha) | (%) | (ha) | (%) | |
| 4.50 | ||||||
| 3630.2 | ||||||
| 2.98 | ||||||
| 2526.6 | 2.01 | |||||
| Water body | 115.1 | 0.09 | 151.6 | 0.12 | 418 | 0.34 |
During the last three decades (1986, 2003, and 2018), the gross changes in area coverage varied from one land cover type to another. Forest and built-up type experienced significant rise, whereas grassland, cropland, and bare areas experienced a reduction in the study area.
Accuracy of Land Cover Maps
The accuracy assessment of the supervised land cover classification is documented in Table 2. It shows an overall accuracy of 87.7% for 1986, 89.2% for 2003, and 94.9% for 2018. The kappa coefficients for 1986, 2003, and 2018 are 0.83, 0.86, and 0.93, respectively. The higher accuracy of Sentinel image (2018) is related to the higher resolution of the images compared to Landsat. The land cover maps fulfilled the accuracy requirements and therefore were used for the further analysis and change detection. In some areas a distinction between spectral similar land cover classes such as bare areas and built-up areas led to lower accuracies. In general, it has to be stated that the analysis of land cover served to identify trends and compare them with the qualitative analysis.
Accuracy assessment (in %) of land cover maps (1986–2018).
| Land Cover Type | 1986 | 2003 | 2018 | |||
|---|---|---|---|---|---|---|
| User’s Accuracy | Producer’s Accuracy | User’s Accuracy | Producer’s Accuracy | User’s Accuracy | Producer’s Accuracy | |
Table 3 highlights the rate of the changes of land cover in the Gozamin district for the periods from 1986 to 2003, from 2003 to 2018, and it documents the land cover changes during the whole observation period from 1986 to 2018. The results give evidence that the study area was affected by substantial land cover changes.
Percentage change, net change, and rate of change occurring between the years 1986, 2003, and 2018 for the classified land cover categories of Gozamin district.
| Land Cover Type | Change (%) | Net Change (ha) | Rate of Change (ha/Year) | ||||||
|---|---|---|---|---|---|---|---|---|---|
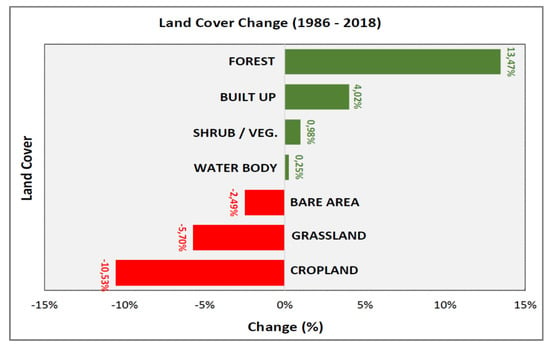
Land cover change of the study area over study period.
Results of Analysis of DPSIR Indicators in Relation to Land Cover Change
Figure 3 documents that 82% of the farmers perceived that the area of forests increased within the last 32 years. A total of 78% of the farmers also witnessed an increase of built-up areas, and 65% and 53% also a majority assumed that shrub/scattered vegetation and water bodies increased, respectively. A total of 85% of the farmers registered a reduction of grassland, and 79% and 77% a decrease of the area of cropland and bare areas, respectively. The farmers’ perceptions of land cover changes, which were assessed by interviews, were according to the quantitative results of the land cover mapping by applying remote sensing technologies.
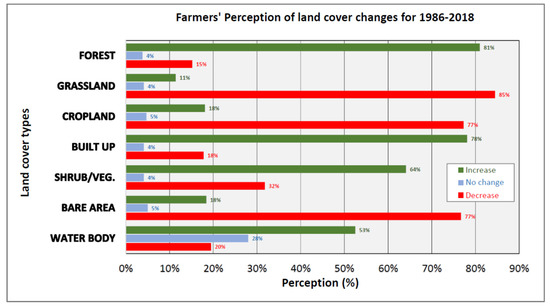
Farmers’ perception of land cover changes for 1986–2018. Numbers indicate the percentage that perceived the indicated changes per land cover type (sample: 343 farmers).
Drivers of Land Cover Change
Land cover changes are the result of a bundle of driving factors. Studies have documented that drivers for land cover change are technological, economic, demographic, political, institutional, and socio-cultural factors [1].
The current study also included an investigation of drivers for land cover changes. Table 4 documents the drivers of land cover change as perceived and reported by household farmers. The main drivers in Gozamin district were increment of population growth (83.4%), land tenure system (71.4%), overuse of land (68.2%), climate change (66.8%), scarcity of grazing land (63.8%), reduced farm size (61.5%), and high wood demand (41.7%).
Drivers of land cover changes as perceived by household farmers (
= 343
).
| Drivers of Land Cover Change | Total | % |
|---|
The pressures exerted due to land cover change as perceived by household farmers were demand for agricultural land (80.8%), agroforestry (75.8%), over grazing of land (74.6%), over competition of communal land (70.0%), selective cutting of trees (66.2%), soil moisture change (46.1%), and increased demand for forest product (44.0%). Results are shown in Table 5.
Pressures perceived by household farmers due to land cover change (
= 343
).
| Pressures of Land Cover Change | Total | % | ||||||
|---|---|---|---|---|---|---|---|---|
| 1986–2003 | 2003–2018 | 1986–2018 | 1986–2003 | 2003–2018 | 1986–2018 | 1986–2003 | 2003–2018 | 1986–2018 |
| Forest | 18,630.4 | 15.30 | 22,880.2 |
| Forest | 96.5 | 93.9 | 18.79 | 34,959.2 | 28.77 |
| 94.9 | 98.9 | 96.5 | 98.8 |
| Forest | 3.49 | 9.98 | 13.47 | 4249.8 | ||||||||||
| Increment of population growth | 12,079 | 16,328.8 | 249.9 | 805.3 | 286 | 83.4 | 510.3 | Grassland | 31,336.7 | 25.72 | 25,301.6 | 20.77 | 24,392.2 | 20.02 |
| Grassland | 94.7 | 96.4 | 96.1 | 93.7 | Cropland | 52,640.4 | 43.21 | 52,360.1 | 42.98 | 39,813.8 | 32.68 | |||
| 97.5 | 96.3 | |||||||||||||
| Grassland | −4.95 | −0.75 | −5.7 | −6035.1 | −909.4 | −6944.5 | −355.0 | −60.6 | −217.0 | Cropland | 79.8 |
| Competition on communal land | 240 | 70.0 | ||||||||||
| Overuse of land | 234 | 68.2 | ||||||||||
| 98.4 | ||||||||||||
| Over grazing of land | 256 | 80.4 | 97.5 | 96.4 | 91.9 | |||||||
| Cropland | −0.23 | −10.3 | −10.53 | −280.3 | −12,546.3 | −12,826.6 | −16.5 | −836.4 | −400.8 | Built-up | 548.8 | |
| Built-up | 1.16 | 0.45 | 1961.1 | 1.61 | 2.86 | 4.02 | 5451.3 | 4.47 | ||||
| Built-up | 87 | 50 | 96 | 55 | 85.7 | 98.3 | 1412.3 | 3490.2 | 4902.5 | 83.1 | 232.7 | 153.2 |
| Loss of soil fertility | Shrub/Veg | 13,070.3 | ||||||||||
| 231 | Shrub/Sc. Vegetation | 10.73 | 15,536.0 | 12.75 | 100 | 14,259.7 | 87.5 | 11.71 | ||||
| 67.3 | 89.7 | 90.9 | ||||||||||
| Shrub/Veg | 94.1 | 80 | ||||||||||
| 2.02 | −1.04 | 0.98 | 2465.7 | −1276.3 | 1189.4 | 145.0 | −85.1 | |||||
| Increase of land prices | 37.2 | 264 | 77.0 | Bare areas | 5479.1 | Bare areas | 85 | 63 | 98 | 78 | ||
| Bare areas | −1.52 | 95.1 | 75.7 | |||||||||
| −0.97 | −2.49 | −1848.9 | −1103.6 | |||||||||
| Increased land fragmentation | 255 | −2952.5 | 74.3 | |||||||||
| Biodiversity change | 270 | 78.7 |
Impacts of Land Cover Change
Studies have reported significant environmental and economic impacts that caused land cover changes in the highlands of Ethiopia [2][3][4]. For the Gozamin district, the main impacts reported by household farmers and documented in Table 7 were an increased rural to urban migration (81.3%), an increase in population (79.6%), a scarcity of land (76.1%), a decline in the productivity of land (67.9%), an increase in resource consumption (67.3%), a loss of soil quality (64.4%), and a loss of biodiversity (54.2%).
Impacts of land cover changes as perceived by household farmers (
= 343
).
| Impacts of Land Cover Change | Total | % |
|---|
| Increase rural to urban migration | 279 | 81.3 |
| Scarcity of land | 261 | 76.1 |
| Land productivity decline | 233 | 67.9 |
The responses for household farmers’ perceptions of the effects of land cover changes were raising awareness of farmers in land management (87.2%), conservation and rehabilitation of resources (82.8%), applying appropriate land use planning (68.8%), and investment in land resources (53.6%). The results are indicated in Table 8.
Responses perceived by household farmers in land cover change (
= 343
).
| Responses of Land Cover Change | Total | % |
|---|
| Conservation and rehabilitation of resource | 284 | 82.8 | |||||||
| 74.6 | |||||||||
| Reduced farm size | 211 | 61.5 | |||||||
| Demand for agricultural land | 277 | 80.8 | Climate change | 229 | 66.8 | ||||
| Increased demand for forest product | 151 | 44.0 | Rural land tenure system | 245 | 71.4 | ||||
| −108.8 | |||||||||
| Agro-forestry | 260 | 75.8 | High wood demand | −73.6 | −92.3 | 143 | |||
| Selective cutting of trees | 41.7 | ||||||||
| 227 | Water bodies | Scarcity of grazing land | 100 | 75 | 100 | 96.3 | 219 | 100 | 97.1 |
| Water body | 63.8 |
Pressures Exerted Due to Land Cover Change
| 66.2 |
| Soil moisture change | ||||||
| 0.03 | ||||||
| 0.22 | ||||||
| 0.25 | 36.5 | 266.4 | ||||
| Overall accuracy | 87.7% | 89.2% | 94.9% | |||
| Kappa statistics | 0.83 | 0.86 | 0.93 |
Land Cover Changes
| 302.9 |
| 2.1 |
| 17.8 |
| 9.5 |
During the period from 1986 to 2003, the areal coverage of forest, built-up, shrub/scattered vegetation, and water body increased by 4249.8 ha (3.49%), 1412.3 ha (1.16%), 2465.7 ha (2.02%), and 36.5 ha (0.03%), respectively. On the other hand, grassland, cropland, and bare areas decreased by 6035.1 ha (4.95%), 280.3 ha (0.23%), and 1848.9 ha (1.52%), respectively. This was due to the conversion of grassland, cropland, and bare areas to forest, built-up, and shrub/scattered vegetation.
Likewise, forest, with 12,079 ha (9.98%), and built-up areas, with 3490.2 ha (2.86%), showed a significant increment in the period from 2003 to 2018. At the same time, cropland decreased by 12,546.3 ha (10.3%).
The analysis showed that between 1986 and 2003, forest, built-up, shrub/scattered vegetation, and water bodies increased at a rate of 249.9 ha/year, 83.1 ha/year, 145.0 ha/year, and 2.1 ha/year, respectively. Grassland, cropland, and bare areas decreased by 355.0 ha/year, 16.5 ha/year, and 108.8 ha/year, respectively. Similarly, between 2003 and 2018, forest, built-up, and water bodies persistently increased at a rate of 805.3 ha/year, 232.7 ha/year, and 17.8 ha/year, respectively. However, grassland, cropland, and bare areas decreased by 60.6 ha/year, 836.4 ha/year, and 73.6 ha/year, respectively. Unlike the first period, between 2003 and 2018, shrub/scattered vegetation decreased by 85.1 ha/year.
Over the last 32 years, the land cover change detection between 1986 and 2018 revealed that forest, built-up areas, shrub/scattered vegetation, and water bodies increased at a rate of 510.3, 153.2, 37.2, and 9.5 ha/year, respectively. Contrary to this, the share of grassland, cropland, and bare areas diminished at a rate of 217.0, 400.8, and 92.3 ha/year, respectively (see Figure 2).
| 158 |
| 46.1 |
States of the Land due to the Land Cover Change
In the study area, the current states (conditions) observed due to land cover change by household farmers were forest cover change (85.1%), biodiversity change (78.7%), increasing land price (77.0%), land fragmentation (74.3%), rainfall variability (73.2%), and soil erosion (61.5%). All results are documented in Table 6.
States perceived by household farmers due to land cover changes (
= 343
).
| States of Land Cover Change | Total | % |
|---|
| Rainfall variability | 251 | 73.2 | |||
| Soil erosion | 211 | 61.5 | |||
| Investment in land resource | 184 | 53.6 | Forest cover change | 292 | 85.1 |
| Change in population size | 273 | 79.6 | |||
| Loss of soil quality | |||||
| Raising awareness of farmers in land management | 221 | 64.4 | |||
| 299 | Loss of biodiversity | 186 | 54.2 | ||
| Increase resource consumption | 231 | 67.3 |
Responses of Farmers on the Effect of Land Cover Change
| 87.2 |
| Applying appropriate land use planning | |
| 236 | 68.8 |
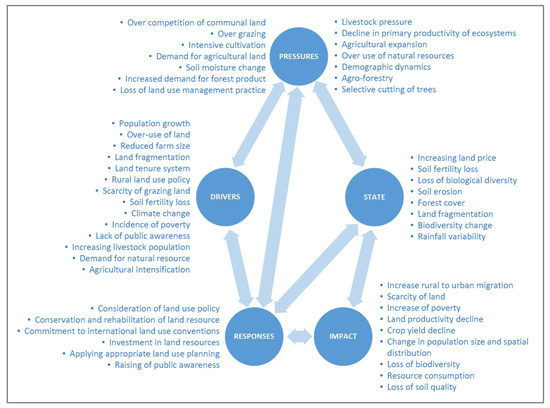
DSPIR Model
Based on the answers from household farmers about their perceptions of different factor concerning the land cover change, a DSPIR model was elaborated. Figure 4 lists all the answers received from household farmers in the questionnaire survey but includes also factors mentioned in the focus group discussions.
- Geist, H.; McConnell, W.; Lambin, E.F.; Moran, E.; Alves, D.; Rudel, T. Causes and Trajectories of Land-Use/Cover Change. In Land-Use and Land-Cover Change: Local Processes and Global Impacts; Lambin, E.F., Geist, H., Eds.; Springer International Publishing: Cham, Switzerland, 2006; pp. 41–70. [Google Scholar]
- Miheretu, B.A.; Yimer, A.A. Determinants of farmers’ adoption of land management practices in Gelana sub-watershed of Northern highlands of Ethiopia. Ecol. Process. 2017, 6, 191. [Google Scholar] [CrossRef]
- Wubie, M.A.; Assen, M.; Nicolau, M.D. Patterns, causes and consequences of land use/cover dynamics in the Gumara watershed of lake Tana basin, Northwestern Ethiopia. Environ. Syst. Res. 2016, 5, 155. [Google Scholar] [CrossRef]
- Gashaw, T.; Tulu, T.; Argaw, M.; Worqlul, A.W. Evaluation and prediction of land use/land cover changes in the Andassa watershed, Blue Nile Basin, Ethiopia. Environ. Syst. Res. 2017, 6, 1–15. [Google Scholar] [CrossRef]
- Food and Agricultural Organization. Methodological Framework for Land Degradation Assessment in Drylands (LADA). Development 2006, 7, 10. [Google Scholar]
References
- Geist, H.; McConnell, W.; Lambin, E.F.; Moran, E.; Alves, D.; Rudel, T. Causes and Trajectories of Land-Use/Cover Change. In Land-Use and Land-Cover Change: Local Processes and Global Impacts; Lambin, E.F., Geist, H., Eds.; Springer International Publishing: Cham, Switzerland, 2006; pp. 41–70.
- Birhan Asmame Miheretu; Assefa Abegaz Yimer; Determinants of farmers’ adoption of land management practices in Gelana sub-watershed of Northern highlands of Ethiopia. Ecological Processes 2017, 6, 191, 10.1186/s13717-017-0085-5.
- Mesfin Anteneh Wubie; Mohammed Assen; Melanie D. Nicolau; Patterns, causes and consequences of land use/cover dynamics in the Gumara watershed of lake Tana basin, Northwestern Ethiopia. Environmental Systems Research 2016, 5, 155, 10.1186/s40068-016-0058-1.
- Temesgen Gashaw; Taffa Tulu; Mekuria Argaw; Abeyou W. Worqlul; Evaluation and prediction of land use/land cover changes in the Andassa watershed, Blue Nile Basin, Ethiopia. Environmental Systems Research 2017, 6, 1–15, 10.1186/s40068-017-0094-5.
- Gabrielsen, P.; Bosch, P. Environmental indicators: Typology and use in reporting. In Internal Working Paper; European Environmental Agency: Copenhagen, Denmark, 2003; pp. 1–20. Available online: https://www.researchgate.net/publication/237573469 (accessed on 15 September 2019).
- Food and Agricultural Organization. Methodological Framework for Land Degradation Assessment in Drylands (LADA). Development 2006, 7, 10.