Your browser does not fully support modern features. Please upgrade for a smoother experience.
Please note this is a comparison between Version 1 by Sriyani Padmalatha Konara Mudiyanselage and Version 3 by Ron Wang.
The incidence of herpes zoster (HZ) in patients infected with HIV is higher than that of the general population. However, the incidence of HZ in HIV patients receiving antiretroviral therapy (ART) remains unclear.
- incidence
- herpes zoster
- HIV-infected patients
- highly active antiretroviral therapy
- meta-analysis
1. Introduction
Herpes zoster (HZ), also known as shingles, is caused by the reactivation of varicella zoster virus (VZV), which remains latent in the sensory ganglia following varicella infection [1]. HZ is a human immunodeficiency virus (HIV)-associated opportunistic infection. HIV infected populations have a 3- to 20-fold higher risk of contracting HZ than HIV seronegative individuals [2][3][4][5][6][2,3,4,5,6]. A systematic review and meta-analysis of the HZ incidence in ART-naive patients was 9.4%. During the first year of ART, the incidence was 2.3%, but this reduction was not statistically significant [7].
Even though the introduction of ART has improved the survival of those living with HIV, the incidence of HZ among HIV cohorts remains higher than that of the general population [4][8][4,8]. The incidence of HZ in the HIV cohort was 9.3–141 per 1000 patient years (PY)s [8][9][10][8,9,10]; but the incidence of HZ in the general population is only 3–5 per 1000 PYs [11]. The general population lifetime risk for HZ is between 23.8% and 30% and affects approximately one in four people in Europe; however, for those aged >85 years, the risk increases to one in two people [12].
ART was previously associated with reduced risk of herpes zoster and other opportunistic infections and could substantially improve the quality of life among HIV infected patients [7]. The long-term effects of ART on HZ incidence among HIV infected cohorts have been inconsistent across previous studies. A study in 2005 noted that the HZ incidence has not significantly decreased since the advent of ART [9]. Conversely, other prior studies found a reduction in the risk of HZ after the initiation of ART in North America, Europe, Taiwan and Africa [4][8][10][13][14][15][16][17][4,8,10,13,14,15,16,17]. Several studies have shown an increase in the HZ incidence during the first to fourth months following ART therapy, which suggests that HZ may be a feature of immune reconstitution inflammatory syndrome (IRIS) [9][18][19][9,18,19].
A better understanding of the risk factors for HZ for the HIV infected population may provide valuable information for health care professionals to identify adult patients at a heightened risk and could help formulate appropriate policies for vaccination strategies for the HIV-infected population [20]. Therefore, the objective of meta-analysis aimed to systematically review studies estimating the incidence and risk factors for HZ in the post-ART era among people living with HIV (PLWH) and discuss implications based on the updated evidence.
2. Results
23.1. Study Characteristics
During the period from 1 January 2000 to 28 February 2021, we identified 2111 records: 221 from PubMed, 1793 from Embase, 23 from Cochrane Library and 74 from CINAHL. After removing duplications and the initial screening, 45 articles were eligible for full-text review (Figure 1). Eleven studies met the inclusion criteria for the meta-analysis. The 11 studies received a quality score of ≥8, with nine studies receiving a score of >10 out of 12 (Table 1). The 11 studies included 10 cohort studies and 1 clinical observational study. Overall, the study quality was acceptable. These 11 studies included 195,190 total HIV infected participants. The incidence was reported for populations in America (four studies), Europe (four studies), Asia (one study) and Africa (two studies). The pooled incidence rate of HZ in the 11 studies was 2.30 (95% CI: 1.56–3.05) per 100 person years (PYs) (Figure 2a). Due to high heterogeneity, subgroup analyses were conducted and stratified by gender, income, AIDS history, study observational years, HIV risk factors and CD4 cell count (Table 2). Among the 10 studies, patients with high income (pooled RR, 2.64; 95% CI, 1.62–3.65) had the pooled HZ incidence greater than those with low income (pooled RR, 1.33; 95% CI, −0.56–3.22). Among the 4 studies, patients without AIDS history (pooled RR, 0.60; 95% CI, 0.46–0.72) had the pooled HZ incidence greater than those who had AIDS history (pooled RR, 0.40; 95% CI, 0.28–0.54). Among the 4 studies, patients being heterosexual had the pooled HZ incidence (pooled RR, 0.41; 95% CI, 0.31–0.52) greater than IDUs and MSM. Of the 4 studies, patients with a CD4 count < 200 cells/mm3 (pooled RR, 0.78; 95% CI, 0.55–0.91) were at increased risk of HZ compared with those with a CD4 count > 200 cells/mm3 (pooled RR, 0.21; 95% CI, 0.06–0.51).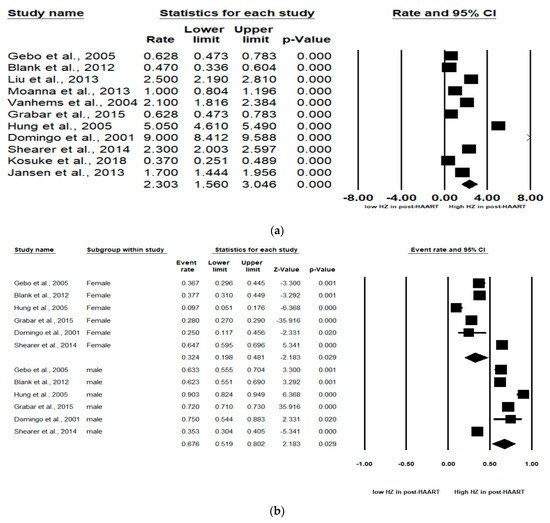
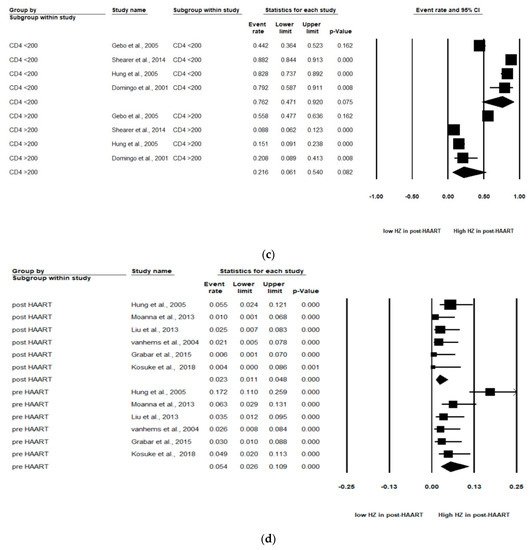
Figure 2. Meta-analyses of (a) HZ incidence of HIV-infected patients among ART-era therapy, (b) subgroup segmented by sex, (c) subgroup segmented by CD4 count level and (d) subgroup segmented by ART use. (Note: in the graph, the square represents the effect size of each study. The bigger the square, the more participants in the study. A horizontal line represents the 95% confidence intervals of the study result, with each end of the line representing the boundaries of the confidence interval. The diamond represents the combined effect. Pre-ART = not receiving ART. Post-ART = receiving ART).
Table 2. Subgroup analysis of HZ incidence in different categories.
| Subgroup Category | No. of Studies | RR (95% Confidence Interval) | I2 (%) | p Value | ||||
|---|---|---|---|---|---|---|---|---|
| Overall HZ | 11 | 2.30 (1.56–3.05) | 99.3 | 0.001 | ||||
| Sex | ||||||||
| Male | 6 | 0.68 (0.52–0.80) | 97.5 | 0.001 | ||||
| Female | 6 | 0.32 (0.20–0.48) | 97.5 | 0.001 | ||||
| Income | ||||||||
| High income | 8 | 2.64 (1.62–3.65) | 99.5 | 0.001 | ||||
| IDU | −0.77 | 0.51 | −1.76–0.22 | 0.13 | Low income | 2 | 1.33 (−0.56–3.22) | 99.3 |
| MSM | 0.001 | |||||||
| 0.19 | 0.48 | −0.76–1.13 | 0.70 | AIDS history | ||||
| CD4 count | ||||||||
| Yes | 4 | 0.40 (0.28–0.54) | 98.3 | 0.001 | ||||
| No | 4 | 0.60 (0.46–0.72) | 98.3 | 0.001 | ||||
| Observation years | ||||||||
| >7 years | 5 | 2.50 (1.29–3.71) | 99.6 | 0.001 | ||||
| ≤7 years | 5 | 2.24 (1.09–3.40) | 99.1 | 0.001 | ||||
| HIV risk factor | ||||||||
| Heterosexual | 4 | 0.41 (0.31–0.52) | 76.5 | 0.005 | ||||
| IDUs | 4 | 0.35 (0.20–0.54) | 88.7 | 0.001 | ||||
| MSM | 4 | 0.32 (0.19–0.49) | 90.2 | 0.001 | ||||
| CD4 count | ||||||||
| CD4 < 200 | 4 | 0.78 (0.55–0.91) | 95.6 | 0.001 | ||||
| CD4 > 200 | 4 | 0.21 (0.06–0.51) | 97.0 | 0.001 | ||||
| ART use | ||||||||
| Pre-ART | 6 | 6.22 (3.59–8.85) | 99.6 | 0.001 | ||||
| Post-ART | 6 | 2.00 (1.04–2.95) | 99.2 | 0.001 | ||||
2.2. Meta-Regression Analyses of Overall HZ Moderators
PWe performed several meta-regression analyses, by which samples were segmented by sex, CD4 count level and ART use.
23.3. Subgroup Analyses by Sex
In six studies, males and females were analyzed. The subgroup analyses revealed that males were at significantly higher HZ risk than females (Pooled RR = 0.32 (female) and 0.68 (male); 95% CI: 0.20–0.48 (female) and 0.52–0.80 (male)). Larger effect sizes were observed for the HZ incidence for males than for females in the HIV-infected population (Figure 2b).
23.4. Subgroup Analyses by CD4 Count Level
As stated, two levels of CD4 count (CD4 count < 200 and CD4 count > 200 cells/mm3) were analyzed in these studies. Of the four studies, patients with a CD4 count < 200 cells/mm3 (pooled RR, 0.76; 95% CI, 0.47–0.92, p < 0.001) were at increased risk of HZ compared with patients with a CD4 count > 200 cells/mm3 (pooled RR, 0.22; 95% CI, 0.06–0.54, p < 0.001). A significant effect was noted in that CD4 count < 200 cells/mm3 among HIV-infected population that would increase the risk of HZ (Figure 2c).
23.5. Subgroup Segmented by ART Use
Among the six studies that enrolled patients in the pre-ART (not receiving ART) and post-ART (receiving ART) era, the subgroup analyses showed that those in the pre-ART era (pooled RR, 0.05 PYs; 95% CI, 0.03–0.11, p < 0.001) were at significantly higher HZ risk than those in the post-ART era (pooled RR, 0.02 PYs; 95% CI, 0.01–0.05, p < 0.001). The HIV-infected population who was not receiving ART was at higher HZ risk than the HIV-infected population receiving ART (Figure 2d).
23.6. Meta-Regression Analysis
We found a high level of heterogeneity in the HZ incidence across the 11 studies (I2 = 99.3%) (Figure 2a). Publication bias was analyzed by generating a funnel plot (Figure 3) and using Egger’s test.
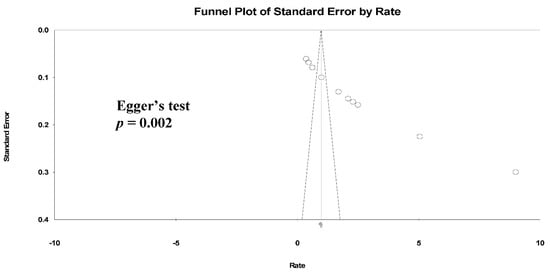
Figure 3. Funnel plots of HZ incidence. (Note: in the graph, the observed studies are shown as open circles and the observed point estimate in log units us shown as a diamond).
Furthermore, significant publication bias existed based on the Egger’s regression analysis (p = 0.002). A univariate analysis was conducted to identify significant independent covariates as potential sources of heterogeneity to be included in the meta-regression model. We found that risk factors for HZ incidence included male sex (AOR: 4.35 (95% CI: 0.54–2.41), p = 0.002), CD4 count < 200 cells/μL (AOR: 11.59 (95% CI: 0.53–4.38), p = 0.013) and not receiving ART (AOR: 2.89 (95% CI: −0.44–2.56), p = 0.16) (Table 3).
Table 3. Meta-regression analysis of HZ risk factors affecting heterogeneity.
| Variable | Coefficient | Standard Error | OR (95% CI) | p Value |
|---|---|---|---|---|
| Sex | ||||
| Female | Reference | |||
| Male | 1.47 | 0.48 | 0.54–2.41 | 0.002 * |
| HIV risk factor | ||||
| Heterosexual | Reference | |||
| CD4 > 200 | Reference | |||
| CD4 < 200 | 2.45 | 0.98 | 0.53–4.38 | 0.013 * |
| AIDS history | ||||
| No | Reference | |||
| Yes | −0.57 | 0.42 | −1.39–0.25 | 0.17 |
| ART use | ||||
| With ART | Reference | |||
| Absence of ART | 1.06 | 0.77 | −0.44–2.56 | 0.16 |
* p < 0.05.