Your browser does not fully support modern features. Please upgrade for a smoother experience.
Please note this is a comparison between Version 2 by Vivi Li and Version 1 by Francesco Pettini.
In the coming age of omics technologies, next gen sequencing, proteomics, metabolomics, and other high throughput techniques will become the usual tools in biomedical cancer research. However, their integrative approach is not trivial due to the broad diversity of data types, dynamic ranges and sources of experimental and analytical errors characteristic of each omics.
- data analysis
- artificial intelligence
- precision medicine
- machine learning models
- computational oncology
- cancer disease
- omics tools
1. Introduction
Last fact sheets from World Health Organization (WHO), updated to March 2021, reports cancer is the second leading cause of death worldwide, accounting for nearly 10 million deaths in 2020. Approximately 70% of the deaths from cancer occur in low- and middle-income countries. Breast, lung, colorectal, and prostate cancers are the most common [1].
A correct cancer diagnosis is essential for adequate and effective treatment because every tumor is involved in interactions with non-cancer elements such as gene-environment interactions (GxE), micro-environmental interactions, and those with the immune system; intercellular interactions within the tumor environment; and intracellular interactions, such as transcriptional regulation and gene co-expression, signaling and metabolic pathways, as well as protein interactions (Figure 1) [2].
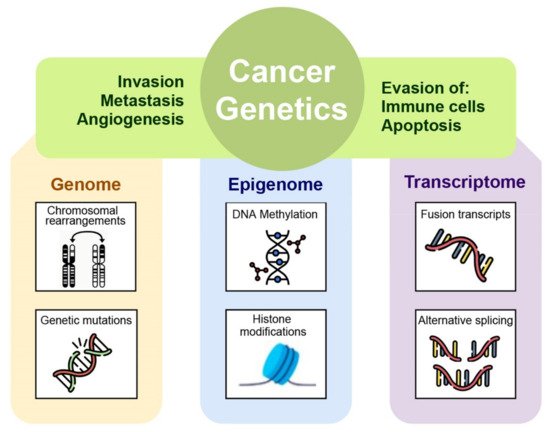
Figure 1. The many levels of interactions found in a cancer system, that can be measured via the different omics technologies, such as genomics, epigenomics, transcriptomic, and proteomic.
This is the reason why only an integrating framework among different omics layers can gather and organize the knowledge gained with each experimental approach into mechanistic or semi-mechanistic descriptions of the biological phenomenon [3].
Multi-omics model is defined as a biological approach that, by using one or more current high-throughput experimental techniques, can investigate physiological or pathological phenomena and characterize biomolecular systems at different levels. As a matter of fact, each omics contributes on a specific fashion to shape the actual biological phenotype of interest.
Thus, a comprehensive recognition of molecular networks based on multi-omics data has an important scientific role to understand the molecular mechanisms of cancer, but this is possible only because of bioinformatics application [4]. Computational oncology can be defined as an integrative discipline incorporating scientific backgrounds from the mathematical, physical, and computational fields to get a deeper understanding on malignancies [2].
In the coming age of omics technologies, next gen sequencing, proteomics, metabolomics, and other high throughput techniques will become the usual tools in biomedical cancer research. However, their integrative approach is not trivial due to the broad diversity of data types, dynamic ranges and sources of experimental and analytical errors characteristic of each omics [2]. The multi-omics systematic study of cancer found many different factors involved in the development/maintenance of the malignant state such as genetic aberrations, epigenetic alterations, changes in the response to signaling pathways, metabolic alterations, and many others [5]. The advent of high-throughput technologies has permitted the development of systems biology. The system biology paradigm tries to analyze cancer as a complex and intricate pathology and to gain insight into its molecular origin by taking into account the different contributions like DNA mutations, deregulation of the gene expression, metabolic abnormalities, and aberrant pathway signaling [2].
The essential basis of systems biology is to consider a biological phenomenon as a system of interconnected elements such as many complex molecular and environmental components interacting with each other at different levels. For example, tumor behavior is determined by a combination of changes in genomic information possibly associated with abnormal gene expression, protein profiles, and different cellular pathways. In this scenario, the complex interaction of DNA and proteins in replication, transcription, metabolic, and signaling networks are considered the decisive causes for cancer cells dis-functioning [2]. The integration of multi-omics data provides a platform to connect the genomic or epigenomic alterations to transcriptome, proteome, and metabolome networks underling the cellular response to a perturbation. Powerful and sophisticated computational tools can identify the interconnection between genomic aberrations with differentially expressed mRNAs, proteins, and metabolites associated with cancer-driven cellular perturbation [6]. If on the one hand this aspect provides an opportunity to better study the cellular response, on the other hand it poses a challenge for systems biology-driven modelling. Therefore, the next step of systems biology approach focuses on dynamic models that can deal with thousands of mRNA, protein, and metabolite changes developing effective strategies to administer personalized cancer therapy [7]. Summarizing, the main goal of the systems biology research driven by multi-omics data is to develop predictive models that are refined by experimental validations in order to select patients based on personalized multi-omics data and stratifying them to determine who are most likely to benefit from targeted therapies [6,8][6][8].
Definition and detection of cancer-distinctive features allow the investigation of the transition process of a normal cell to malignancy. Generally, the hallmarks involve phenotypic and molecular changes in several metabolic pathways such as uncontrolled proliferation by blocking growth suppressors, reprogramming of energy metabolism, evading immune destruction, resisting cell death, angiogenesis, and metastasis [9]. These variations in cellular machinery are driven by molecular aberration in several omics layers such as genome, epigenome, transcriptome, proteome, and metabolome within cancer cells. Specifically, by applying next generation sequencing to cancer cell genomes, it is possible to reveal how mutations in proliferative genes like B-raf drives the activation of mitogen-activated protein- (MAP-) kinase signaling pathway underlying an uncontrolled cell proliferation [10]. Molecular aberrations leading to cancer are involved not only in genomic mutational events but also in the epigenome. In particular, aberrant epigenetic mechanisms can be responsible for silencing of certain cancer suppressor genes [11]. The multistep processes of invasion and metastasis require a transition of epithelial cell toward mesenchymal phenotype to colonize distant sites. Recent studies have revealed that epithelial-mesenchymal transition is induced by specific transcription factors that coordinate the invasion and metastasis processes [9]. By applying transcriptomics techniques it is possible to investigate the transcription factors involved in transcription regulatory networks assumed to be activated in malignancy. Moreover, manifestations of cancer hallmarks also affected cellular metabolism, in fact tumor cells can reprogram glucose metabolism and energy production pathways detectable with a metabolomics approach [6].
2. Roles of Computational Approach in Multi-Omics Era
Computational approach plays central roles not only in the analysis of high-throughput experiments, but also in data acquisition, in processing of raw file derived from several instruments, in storage and management of large streams of omics information and in the data model integration. Bioinformatics workflow management systems can be used in developing and in application of a certain pipeline. Examples of such systems include Galaxy [50][12], Snakemake [51][13], Nextflow [52][14], and the general-purpose Common Workflow Language [53][15]. Several tools for omics data studies are available in Bioconductor project as packages for the R language [54][16] and in Biopython project [55][17].2.1. Data Acquisition
All the omics technologies have a specific role to figure out the complex phenotype of cells especially in complex diseases like cancer. Knowledge of the biological molecular basis of different cellular signaling pathways does not involve only genes and transcripts, in fact, proteins and metabolites are particularly important to predict the phenotypic alterations for diagnosis and prognosis of cancer, and for this reason, in this chapter, we will spend some words about them. Table 1 represents a summary of the applications of different NGS-based and mass spectrometry-based techniques which are at the basis of different omics data acquisition approaches.
Table 1. Summary of the applications of different techniques for sequencing, which are at the basis of different omics data acquisition approaches. Genomics, epigenomics, and transcriptomics are based on NGS techniques, whereas proteomics and metabolomics are driven by mass-spectrometric (LC-MS/MS) method. The main goal of genomics, epigenomics, and transcriptomics is the screening of genome-wide mutations, the identification of altered epigenomic modifications, and exploring differential RNA expression, while for proteomics and metabolomics is the identification of differentially regulated proteins and metabolites (reprinted from reference [6]).
| OMICS | TYPE | PRINCIPLE | APPLICATION | BIOINFORMATICS TOOLS | |
|---|---|---|---|---|---|
| GENOMICS | Whole exome sequencing | NGS | Exome-wide mutational/analysis | BWA Bowtie Bowtie2 SNAP SAM BAM |
|
| Whole genome sequencing | NGS | Genome-wide mutational/analysis | |||
| Targeted gene/exome sequencing | Sanger sequencing | Mutational analysis in targeted gene/exon | |||
| EPIGENOMICS | Methylomics | Whole genome bisulfite sequencing | Genome-wide mapping of DNA methylation pattern | Methylation-Array-Analysis SICER2 PeakRanger GEM MUSIC PePr DFilter MACS |
|
| ChIP-sequencing | NGS | Genome-wide mapping of epigenetic marks | |||
| TRANSCRIPTOMICS | RNA-sequencing | NGS | Genome-wide differential gene expression analysis | Bowtie STAR kallisto Salmon |
|
| Microarray | Hybridization | Differential gene expression analysis | |||
| PROTEOMICS | Deep-proteomics | Mass-spectrometry | Differential protein expression analysis | MaxQuant Perseus |
|
| METABOLOMICS | Deep-metabolomics | Mass-spectrometry | Differential metabolite expression analysis | Metab metaRbolomics Lipidr |
|
2.1.1. Genomics
To date, genomics approach has highly sustained the finding and investigation of variations at both the germline and somatic levels thanks to many progresses in genome-exome sequencing techniques, for instance from the Sanger sequencing-based approaches to the NGS-based sequencing. Bioinformatics has always had a central role in the analysis of downstream genetic data. For example, in the multiscale scale project “The Cancer Genome Atlas” (TCGA), researchers used NGS sequencing associated to bioinformatics tools with the aim to discover somatic mutational landscape across thousands of tumor samples and to understand the complexity underlying different cancer types [56,57][18][19]. For the analysis of NGS data a sequence aligner tool is used on the sequence data (stored in FASTQ format). Some popular aligners are the stand-alone BWA [58][20], Bowtie [59][21], Bowtie2 [60][22], and SNAP [61][23], with aligned sequences being stored in SAM (Sequence Alignment Map, text-based) or BAM (Binary Alignment Map) files.
2.1.2. Epigenomics
Epigenomics is concerned with the genome-wide identification of chemical modifications (i.e., methylation and acetylation of DNA) which are involved in regulatory mechanisms controlling gene expression and cellular phenotypes [62][24]. Chromatin immunoprecipitation (ChIP) assays-coupled NGS (ChIP-seq) and methylation analysis through whole-genome bisulfite sequencing (WGBS) or bisulfite sequencing (BSSeq) are the most widely used methods in epigenomics analysis [6]. By exploiting the advances in NGS field, it is now possible to analyze genome-wide methylome patterns at a single nucleotide resolution and to detect the methylated cytosine bases in genomic DNA. Data from array-based techniques can be analyzed using dedicated packages such as methylationArrayAnalysis [63][25], whereas for ChIP-seq data processing tools like SICER2 [64][26], PeakRanger [65][27], GEM [66][28], MUSIC [67][29], PePr [68][30], DFilter [69][31], and MACS [70][32] are used.
2.1.3. Transcriptomics
The detection and quantification of RNA transcripts (mRNA, noncoding RNA and microRNAs) is possible owing to the employment of several transcriptomics techniques. Differently from the static nature of genome, transcriptome dynamically changes as consequence of temporal cellular and extracellular stimuli. Microarray was the technique of choice to detect alterations in cellular mRNA levels in a high-throughput manner owing to its ability to quantify the relative abundance of mRNAs for thousands of genes at the same time. Microarrays are widely used to facilitate the identification of genes with differential expression between normal and cancer conditions. With the advent of NGS, the identification of the presence and the abundance of RNA transcripts in genome-wide manner became possible. In contrast to microarrays technique, RNA-seq does not depend on the transcript-specific probes and thus can effectively perform an unbiased detection of novel transcripts, also the less abundant, with high specificity and sensitivity. Starting points for RNA-seq bioinformatics analysis include alignment-based methods, such as Bowtie [59][21], and STAR [71][33], or alignment-free methods, such as kallisto [72][34] and Salmon [73][35]. Cancer-related omics experiments often rely on specific, tailor-made analytic pipeline. TCGA and other repositories give the great opportunity to analyze the omics data by a pan-cancer approach where different types of cancers can be compared in terms of genomic and transcriptomic landscapes [74][36].
2.1.4. Proteomics and Metabolomics
Given the high complexity and dynamic range of proteins, their identification and quantification in large scale are significantly challenging. Proteomic analyses are applied to identify and quantify the set of proteins present within a biological system of interest. Progressions of the tandem mass-spectrometry (LC-MS/MS) techniques in terms of resolution, accuracy, quantitation, and data analysis have made it a solid instrument for both the identification and quantification of cells proteome [75][37]. Recently, the advent of cutting edge high-resolution “Orbitrap” mass-spectrometer instruments associated with powerful computational tools (i.e., MaxQuant [76][38] and Perseus [77][39]) simplified the genome-wide detection of all expressed proteins in human cells and tissues paving the way for a first draft of the human proteome [78,79][40][41]. MS-based proteomics techniques have been extensively applied also to investigate the proteome alteration in several human cancer tissues [80][42]. In particular, the study of cancer proteomes is a promising path for biomarkers and therapeutic targets identification because proteins are the molecular unit from which cellular structure and function arise [81][43].
The application of MS techniques is not restricted to proteomics but rather can be extended to smaller molecules such as metabolites. Metabolomics is characterized by the quantifications of metabolites that are synthesized as products of cellular metabolic activities, such as amino acids, fatty acids, carbohydrates, and lipids. Their levels can be dynamically altered in disease states reflecting aberrant metabolic functions in complex disorders like cancer. Indeed, metabolic variations are significant contributors to cancer development [82][44]. This is the reason why cancer metabolomics has become an important research topic in oncology [83][45], with the aim to get new insights on cancer progression and potential therapeutic targets. Lipidomics is a subset of metabolomics [84][46], specifically cancer lipidomics has recently led to the identification of novel biomarkers in cancer progression and diagnosis [85][47]. Metabolomics is still an ongoing field with the potential to be highly effective in the discovery of biomarkers, especially in cancer. This is possible due to the support of bioinformatics tools like metab package [86][48], which provides an analysis pipeline for metabolomics derived from gas chromatography-MS data, or metaRbolomics package [87][49], which is a general toolbox that goes from data processing to functional analysis. Similarly, the lipidr package [88][50] is an analogous framework focused on lipidomics data processing.
2.2. Data Management
The huge amount of data deriving from different omics analyses need to be adequately collected and stored. Challenges of data management include defining the type of data to be stored and how to store it, the policies for data access, sharing, use, and finally, long-term archiving procedures [89][51]. One of the most successful repositories regarding application of multi-omics approach in cancer is NIHs Genome Data Commons (GDC) [90][52] containing all data generated by the Cancer Genome Atlas (TCGA) project [74][36]. TCGA project has performed integrative analysis of more than 30 human cancer types with the aim to create a publicly available comprehensive platform for collecting the molecular alterations in the cancer cells at the forefront of multi-omics research [74][36]. Information about aberrations in the DNA and chromatin of the cancer-genomes from thousands of tumors have been catalogued by matching with the normal genomes and linking these aberrations to RNA and proteins levels. Moreover, it provides data for method development and validation usable in many current projects. In 2020, the collaboration of an international team has completed the most comprehensive study of whole cancer genomes, significantly improving the fundamental understanding of cancer, and indicating new directions for developing diagnostics and treatments. The ICGC/TCGA Pan-Cancer Analysis of Whole Genomes Project (PCAWG, or the Pan-Cancer Project) involved more than 1300 scientists and clinicians from 37 countries, analyzed more than 2600 whole genomes of 38 different tumor types. Commenting this aspect, Rameen Beroukhim, an associate member of the Broad Institute, said: “It was heartening that this very large group was able to bring together disparate resources and work to come up with some groundbreaking findings”. Additionally, Gad Getz, an institute member and the director of the Cancer Genome Computational Analysis Group at the Broad Institute, director of bioinformatics at the Massachusetts General Hospital’s (MGH) Cancer Center and professor of pathology at Harvard Medical School, said: “This large international effort shows the breadth of the types of research and new biological insight that are possible using whole cancer genome data”. He continued: “By analyzing the largest collection of whole cancer genomes studied thus far, we created the most comprehensive catalog of mutational signatures to date, this catalog can be used to understand the mechanisms that generate mutations and drive cancer in each patient” [91][53]. The Pan-Cancer Project improved and developed new methods for exploring not only exome, that represent the 1 percent of the genome, but, also, the remaining 99 percent of the genome, which includes regions that regulate the activity of genes.
With the genomics, epigenomics, and transcriptomics data from over 11,000 tumors representing 33 of the most prevalent forms of cancer, the Pan-Cancer Atlas represents an exceptional chance for a comprehensive and integrated analysis to extend our current knowledge of how a normal cell achieves cancer hallmarks. The pan-cancer analysis involving multi-omics data in combination with structured bioinformatics and statistical instruments provides an effective platform to recognize common molecular signatures for the stratification of patients affected by different cancer types and uncover shared molecular pathology of different cancer types for designing tailored therapies. Investigation of the massive amount of cancer-specific data deposited in TCGA requires special bioinformatics methods to mine biologically meaningful information. Several analytic and visualization platforms have been already developed to support the rapid analysis of TCGA data. For instance, cBioPortal provides the opportunity to visualize, analyze, and download large-scale cancer genomics data sets [92][54]. The impulse for open data in the field of biomedical genomics is important to make data available in public repositories for improving and accelerating scientific discovery, although there are ethical and technological challenges to be overcome.
2.3. Data Integration
The need to integrate multi-omics data has led to the development of new theoretical algorithms and methods that are able to extract biologically significant information of clinical relevance.
Unsupervised data integration refers to the cluster of methods that draw an inference from of an unlabeled input dataset. Learning consists in detecting intrinsic regularities and relationships between the data, without any prior knowledge about the data itself. Examples of unsupervised techniques are matrix factorization methods, Bayesian methods, network-based methods, and multi-step analysis. CNAmet is a powerful multi-step integration tool for CNV, DNA methylation, and gene expression data [93][55]. The identification of genes which are synergistically regulated by methylation and CNV data, allow the understanding of biological process behind cancer progression.
Supervised methods involve the use of a dataset for which the phenotype label is known. In this way, when the system has learned a given task, it will be able to generalize, or to use the experience gained to solve problems that provide the same basic knowledge. Supervised data integration methods are built via information of available known labels from the training omics data. The most common supervised techniques are Network-based methods, Multiple Kernel Learning methods, and multi-step analysis. For example, Feature Selection Multiple Kernel Learning (FSMKL) is a method which uses the statistical score for feature selection per data type per pathway, improving the prediction accuracy for cancer detection.
Semi-supervised integration methods, lies between supervised and unsupervised methods, takes both labeled and unlabeled samples to develop learning algorithm. It is particularly useful in cases where we have a partial knowledge about the data, or if the collection and sampling phase of labeled data is too expensive to be carried out exhaustively. Semi-supervised data integration methods are usually graph-based. Graph-based semi-supervised learning (SSL) methods have been applied to cancer diagnosis and prognosis predictions.
The combination of different biological layers, with the aim to discover a coherent biological signature, remain a challenging process. Furthermore, multi-omics combinations are not necessarily capable to achieve better diagnostic results. Selecting an optimal omics combination is not trivial, since there are economic and technical constraints in the clinical setting in which such diagnostic tools are to be deployed [94][56]. Machine Learning Bioinformatic approaches play an important role in the design of such studies.
2.3.1. Multi-Omics Datasets
Selecting an appropriate dataset that allows for easy manipulation and data calculations could affect the performance of a computational model and reduce the main obstacles to multi-omics data analysis by improving data science applications of multiple omics datasets:
2.3.2. The Problem of Missing Data
Integrating large amounts of heterogeneous data is currently one of the major challenges in systems biology, due to the increase in available data information [98][60]. The problem of missing and mislabeled samples, is a common problem in large-scale multi-omics studies [99][61]. It is common for datasets to have missing data related to some individuals. This often happens in clinical studies, where patients can forget to fill out a form. In other cases, it is possible that the acquisition of data reveals to be too expensive, need much time to be obtained or it is difficult to measure. Missing row values for a table are difficult to manage because most statistical methods cannot be applied directly to incomplete datasets. In recent years, several approaches have already been proposed to address missing row values [100][62]. The missRow package combines multiple imputation with multiple factor analysis to deal with missing data [99][61]. The omicsPrint method detects data linkage errors and family relations in large-scale multiple omics studies [101][63].
2.3.3. Exploratory Data Analysis
Understanding the nature of the data is a critical step in omics analysis [102][64]. For this purpose, it is possible to use exploratory data analysis (EDA) techniques which allow better assessments at a further modeling step. The main techniques for EDA include cluster analysis and dimension reduction, both widely applied to transcriptomics data analysis [103][65]. While cluster analysis consists of a set of methods for grouping objects into homogeneous classes, based on measures related to the similarity between the elements, dimension reduction is the process of reducing the number of variables, obtaining a set of variables called “principal.” Both cluster analysis [104][66] and dimension reduction [105][67] are applied to cancer studies, as shown in Table 2.
2.3.5. Functional Enrichment Approaches
The interpretation of a ML model results could be a difficult task. A strategy that can provide readily interpretable results consist in mapping omic data on functional characteristics, in order to make them more informative and to associate them with a wider body of biomedical knowledge [2]. Some functional enrichment approaches are listed below:
| Package Tools | Description | |
|---|---|---|
| OMICsPCA | Omics-oriented tools for PCA analysis [106] | Omics-oriented tools for PCA analysis [68] |
| CancerSubtypes | Contains clustering methods for the identification of cancer subpopulations from multi-omics data [107] | Contains clustering methods for the identification of cancer subpopulations from multi-omics data [69] |
| Omicade4 | Implementation of multiple co-inertia analysis (MCIA) [108] | Implementation of multiple co-inertia analysis (MCIA) [70] |
| Biocancer | Interactive multi-omics data exploratory instrument [109] | Interactive multi-omics data exploratory instrument [71] |
| iClusterPlus | Integrative cluster analysis combining different types of genomic data [110] | Integrative cluster analysis combining different types of genomic data [72] |
Together with dimensionality reduction and data clustering, data visualization is also an important part of EDA [2]. The combinations of these three factors make it possible to identify complex patterns, subpopulations within a dataset, and understand the variability within a phenomenon. Even if the scatter plot is the most common method for data visualization, there are other visualization tools available. Hexbins [111][73] can be used to explore sc-RNAseq data, while Circos diagram [112][74] can be used for the detailed representation of multi-omic data and their position in specific genomic regions.
Recently it is stated that mapping omics data to pathway networks could provide an opportunity to biologically contextualize the data. A network representation of multi-omics data can enhance every aspect of the multi-omics analysis because the functional level of biological description is fundamentally composed of molecular interactions [2]. The main tools for a network representation of multi-omics data are Pathview [113][75] and Graphite [114][76].
2.3.4. Machine Learning Models
In recent years, machine learning has been proved to be capable of solving many biomedical problems. These mathematical models can represent the relationships between observed variables and provide a useful description of biological phenomena. A ML tool can perform several tasks, including classification task in which the input data are divided into two or more classes and the learning system produces a model capable of assigning one class among those available to each input. These models have important biomedical applications [94][56], because they are capable of discriminating between health and disease, or between different diseases outcomes [2]. In a regression task instead, the output belongs to a continuous rather than discrete domain. These models provide insights into the molecular mechanisms driving physiological states, reveal interactions between different omics, and have been used in prognostic tools [115][77]. In this context, due to the large amounts of heterogeneous data, the removal of non-informative characteristics which simplifies the model, increases its performance, and makes it less expensive to measure, reveals to be a crucial process [2]. Feature selection algorithm is a process which selects the variables that contribute most to the prediction, removing the irrelevant or less important features that can negatively contribute to the performance of the model. Both classification and regression ML techniques combined with feature selection algorithms have been widely used for cancer prognosis and prediction [2]. Moreover, many packages, which combine exploratory, supervised, and unsupervised tools, have been recently implemented in oncology. Table 3 provides a list of some of these new tools.
Table 3. Main packages tools implemented in oncology for machine learning.
| Package Tools | Description | |
|---|---|---|
| mixOmics | R package for the multivariate analysis of biological datasets with a specific focus on data exploration, dimension reduction, and visualization [116]. | R package for the multivariate analysis of biological datasets with a specific focus on data exploration, dimension reduction, and visualization [78]. |
| DIABLO | Package for the identification of multi-omic biomarker panels capable of discriminating between multiple phenotypic groups. It can be used to understand the molecular mechanisms that guide a disease [117]. | Package for the identification of multi-omic biomarker panels capable of discriminating between multiple phenotypic groups. It can be used to understand the molecular mechanisms that guide a disease [79]. |
| MOFA | Package for discovering the principal sources of variation in multi-omics data sets [118]. | Package for discovering the principal sources of variation in multi-omics data sets [80]. |
| Biosigner | Package for the identification of molecular signatures from large omics datasets in the process of developing new diagnostics [119]. | Package for the identification of molecular signatures from large omics datasets in the process of developing new diagnostics [81]. |
| omicRexposome | Package that uses high-dimensional exposome data in disease association studies, including its integration with a variety of high-performance data types [120]. | Package that uses high-dimensional exposome data in disease association studies, including its integration with a variety of high-performance data types [82]. |
| OmicsLonDA | Package that identifies the time intervals in which omics functions are significantly different between groups [121]. | Package that identifies the time intervals in which omics functions are significantly different between groups [83]. |
| Micrographite | Package that provides a method to integrate micro-RNA and mRNA data through their association to canonical pathways [122]. | Package that provides a method to integrate micro-RNA and mRNA data through their association to canonical pathways [84 |
The first two enrichment approaches, ORA and GSEA, are feature extraction methods generally employed as dimensionality reduction methods. The output of these methods could be the starting points for more complex models such as interactions among functions. In particular, ORA method is based on a statistical evaluation of the fraction of pathway components found among a user-selected list of biological components. This input list fulfils the specific criteria (i.e., log fold change, statistical significance, and cutting-off the majority of components from the input list such as all the genes of a microarray experiment). GoMiner [130][92] is one of the most popular examples of ORA method. It was developed for gene-expression analysis of microarray data. It takes as input a set of over-/under-expressed genes plus the complete set list of the microarray, then it calculates over-/under-representation for Gene Ontology categories by means of Fisher’s exact test. Similarly, GSEA was developed for gene expression analysis from microarray data. The input is a list of ranked genes in accordance with their differential gene expression between two phenotypic classes. For each set of genes, an enrichment score (ES) is calculated based on a Kolmogorov–Smirnov pathway-level statistic. Multiple hypothesis testing is applied for the evaluation of ES significance. In the study of [131][93], the GSEA methodology was used to validate the proliferative role of growth-supporting genes involved in cancer treatment [132][94]. Multi-omics gene-set analysis (MOGSA) is an enrichment approach that uses multivariate analysis, which consists in integrating multiple experimental and molecular data types measured on the same data set. The method projects the features across multiple omics data sets to reduce dimensional spaces and calculates a gene set score with the most significant features. MOGSA’s multi-omics approach compensates for missing information in each single data type to find sets of genes not obtainable from the analysis of single omics data. A different approach is the massive integrative gene set analysis (MIGSA). It allows to compare large collections of datasets from different sources and create independent functional associations for each omic layer. The utility of MIGSA was demonstrated in [133][95] by applying the multi-omics perspective method to functionally characterize the molecular subtypes of breast cancer. There are enrichment approaches, such as pathwayPCA and divergence analysis methods, which use functional aggregation as support for other data analysis studies. In pathwayPCA, exploratory data analysis is performed using statistical methodologies to analyze the functional enrichment of each omics set and aggregating them via consensus. pathwayPCA overcomes alternative methods for identifying disease-associated pathways in integrative analysis. Among various case studies, the model was applied for the identification of sex-specific pathway effects in kidney cancer for the construction of integrative models for the prediction of the patient’s prognosis and for the study of heterogeneity in an ovarian cancer dataset. Divergence analysis method instead, is an enrichment approach that uses functional aggregation to classify large amounts of omics data. The omic profile is reduced to a digital representation based on that of a set of samples taken from a baseline population. The state of a subprofile that is not within the basic distribution is interpreted as “divergent.” In [134][96] an application of the divergence analysis within the study of metabolic differences among the interpersonal heterogeneous cancer phenotypes has been described.
References
- Ferlay, J.; Ervik, M.L.F.; Colombet, M.; Mery, L.; Piñeros, M. Global Cancer Observatory: Cancer Today; International Agency for Research on Cancer: Lyon, France, 2021.
- De Anda-Jáuregui, G.; Hernández-Lemus, E. Computational Oncology in the Multi-Omics Era: State of the Art. Front. Oncol. 2020, 10.
- Hernandez-Lemus, E.; Reyes-Gopar, H.; Espinal-Enriquez, J.; Ochoa, S. The Many Faces of Gene Regulation in Cancer: A Computational Oncogenomics Outlook. Genes 2019, 10, 865.
- Long, Y.; Lu, M.; Cheng, T.; Zhan, X.; Zhan, X. Multiomics-Based Signaling Pathway Network Alterations in Human Non-functional Pituitary Adenomas. Front. Endocrinol. 2019, 10.
- Du, W.; Elemento, O. Cancer systems biology: Embracing complexity to develop better anticancer therapeutic strategies. Oncogene 2015, 34, 3215–3225.
- Chakraborty, S.; Hosen, M.I.; Ahmed, M.; Shekhar, H.U. Onco-Multi-OMICS Approach: A New Frontier in Cancer Research. Biomed. Res. Int. 2018, 2018, 9836256.
- Werner, H.M.J.; Mills, G.B.; Ram, P.T. Cancer Systems Biology: A peek into the future of patient care? Nat. Rev. Clin. Oncol. 2014, 11, 167–176.
- GuhaThakurta, D.; Sheikh, N.A.; Meagher, T.C.; Letarte, S.; Trager, J.B. Applications of systems biology in cancer immunotherapy: From target discovery to biomarkers of clinical outcome. Expert Rev. Clin. Pharmacol. 2013, 6, 387–401.
- Hanahan, D.; Weinberg, R.A. Hallmarks of Cancer: The Next Generation. Cell 2011, 144, 646–674.
- Davies, M.A.; Samuels, Y. Analysis of the genome to personalize therapy for melanoma. Oncogene 2010, 29, 5545–5555.
- Berdasco, M.; Esteller, M. Aberrant epigenetic landscape in cancer: How cellular identity goes awry. Dev. Cell 2010, 19, 698–711.
- Goecks, J.; Nekrutenko, A.; Taylor, J.; Galaxy, T. Galaxy: A comprehensive approach for supporting accessible, reproducible, and transparent computational research in the life sciences. Genome Biol. 2010, 11, R86.
- Koster, J.; Rahmann, S. Snakemake—A scalable bioinformatics workflow engine. Bioinformatics 2012, 28, 2520–2522.
- Di Tommaso, P.; Chatzou, M.; Floden, E.W.; Barja, P.P.; Palumbo, E.; Notredame, C. Nextflow enables reproducible computational workflows. Nat. Biotechnol 2017, 35, 316–319.
- Peter, A.; Michael, R.C.; Nebojša, T.; Brad, C.; John, C.; Michael, H.; Andrey, K.; Dan, L.; Hervé, M.; Maya, N.; et al. Common Workflow Language, v1.0. 2016. Available online: (accessed on 30 May 2020).
- Huber, W.; Carey, V.J.; Gentleman, R.; Anders, S.; Carlson, M.; Carvalho, B.S.; Bravo, H.C.; Davis, S.; Gatto, L.; Girke, T.; et al. Orchestrating high-throughput genomic analysis with Bioconductor. Nat. Methods 2015, 12, 115–121.
- Cock, P.J.; Antao, T.; Chang, J.T.; Chapman, B.A.; Cox, C.J.; Dalke, A.; Friedberg, I.; Hamelryck, T.; Kauff, F.; Wilczynski, B.; et al. Biopython: Freely available Python tools for computational molecular biology and bioinformatics. Bioinformatics 2009, 25, 1422–1423.
- Kandoth, C.; McLellan, M.D.; Vandin, F.; Ye, K.; Niu, B.; Lu, C.; Xie, M.; Zhang, Q.; McMichael, J.F.; Wyczalkowski, M.A.; et al. Mutational landscape and significance across 12 major cancer types. Nature 2013, 502, 333–339.
- Lawrence, M.S.; Stojanov, P.; Polak, P.; Kryukov, G.V.; Cibulskis, K.; Sivachenko, A.; Carter, S.L.; Stewart, C.; Mermel, C.H.; Roberts, S.A.; et al. Mutational heterogeneity in cancer and the search for new cancer-associated genes. Nature 2013, 499, 214–218.
- Li, H.; Durbin, R. Fast and accurate short read alignment with Burrows-Wheeler transform. Bioinformatics 2009, 25, 1754–1760.
- Langmead, B.; Trapnell, C.; Pop, M.; Salzberg, S.L. Ultrafast and memory-efficient alignment of short DNA sequences to the human genome. Genome Biol. 2009, 10, R25.
- Langmead, B.; Salzberg, S.L. Fast gapped-read alignment with Bowtie 2. Nat. Methods 2012, 9, 357–359.
- Zaharia, M.; Bolosky, W.J.; Curtis, K.; Fox, A.; Patterson, D.; Shenker, S.; Stoica, I.; Karp, R.M.; Sittler, T. Faster and More Accurate Sequence Alignment with SNAP. arXiv 2011, arXiv:1111.5572.
- Piunti, A.; Shilatifard, A. Epigenetic balance of gene expression by Polycomb and COMPASS families. Science 2016, 352, aad9780.
- Maksimovic, J.; Phipson, B.; Oshlack, A. A cross-package Bioconductor workflow for analysing methylation array data. F1000Res 2016, 5, 1281.
- Zang, C.; Schones, D.E.; Zeng, C.; Cui, K.; Zhao, K.; Peng, W. A clustering approach for identification of enriched domains from histone modification ChIP-Seq data. Bioinformatics 2009, 25, 1952–1958.
- Feng, X.; Grossman, R.; Stein, L. PeakRanger: A cloud-enabled peak caller for ChIP-seq data. BMC Bioinform. 2011, 12, 139.
- Guo, Y.; Mahony, S.; Gifford, D.K. High resolution genome wide binding event finding and motif discovery reveals transcription factor spatial binding constraints. PLoS Comput. Biol. 2012, 8, e1002638.
- Harmanci, A.; Rozowsky, J.; Gerstein, M. MUSIC: Identification of enriched regions in ChIP-Seq experiments using a mappability-corrected multiscale signal processing framework. Genome Biol. 2014, 15, 474.
- Zhang, Y.; Lin, Y.H.; Johnson, T.D.; Rozek, L.S.; Sartor, M.A. PePr: A peak-calling prioritization pipeline to identify consistent or differential peaks from replicated ChIP-Seq data. Bioinformatics 2014, 30, 2568–2575.
- Kumar, V.; Muratani, M.; Rayan, N.A.; Kraus, P.; Lufkin, T.; Ng, H.H.; Prabhakar, S. Uniform, optimal signal processing of mapped deep-sequencing data. Nat. Biotechnol. 2013, 31, 615–622.
- Zhang, Y.; Liu, T.; Meyer, C.A.; Eeckhoute, J.; Johnson, D.S.; Bernstein, B.E.; Nusbaum, C.; Myers, R.M.; Brown, M.; Li, W.; et al. Model-based analysis of ChIP-Seq (MACS). Genome Biol. 2008, 9, R137.
- Dobin, A.; Davis, C.A.; Schlesinger, F.; Drenkow, J.; Zaleski, C.; Jha, S.; Batut, P.; Chaisson, M.; Gingeras, T.R. STAR: Ultrafast universal RNA-seq aligner. Bioinformatics 2013, 29, 15–21.
- Bray, N.L.; Pimentel, H.; Melsted, P.; Pachter, L. Near-optimal probabilistic RNA-seq quantification. Nat. Biotechnol. 2016, 34, 525–527.
- Patro, R.; Duggal, G.; Love, M.I.; Irizarry, R.A.; Kingsford, C. Salmon provides fast and bias-aware quantification of transcript expression. Nat. Methods 2017, 14, 417–419.
- Cancer Genome Atlas Research Network; Weinstein, J.N.; Collisson, E.A.; Mills, G.B.; Shaw, K.R.; Ozenberger, B.A.; Ellrott, K.; Shmulevich, I.; Sander, C.; Stuart, J.M. The Cancer Genome Atlas Pan-Cancer analysis project. Nat. Genet. 2013, 45, 1113–1120.
- Iwamoto, N.; Shimada, T. Recent advances in mass spectrometry-based approaches for proteomics and biologics: Great contribution for developing therapeutic antibodies. Pharmacol. Ther. 2018, 185, 147–154.
- Cox, J.; Mann, M. MaxQuant enables high peptide identification rates, individualized p.p.b.-range mass accuracies and proteome-wide protein quantification. Nat. Biotechnol. 2008, 26, 1367–1372.
- Tyanova, S.; Temu, T.; Sinitcyn, P.; Carlson, A.; Hein, M.Y.; Geiger, T.; Mann, M.; Cox, J. The Perseus computational platform for comprehensive analysis of (prote)omics data. Nat. Methods 2016, 13, 731–740.
- Kim, M.S.; Pinto, S.M.; Getnet, D.; Nirujogi, R.S.; Manda, S.S.; Chaerkady, R.; Madugundu, A.K.; Kelkar, D.S.; Isserlin, R.; Jain, S.; et al. A draft map of the human proteome. Nature 2014, 509, 575–581.
- Wilhelm, M.; Schlegl, J.; Hahne, H.; Gholami, A.M.; Lieberenz, M.; Savitski, M.M.; Ziegler, E.; Butzmann, L.; Gessulat, S.; Marx, H.; et al. Mass-spectrometry-based draft of the human proteome. Nature 2014, 509, 582–587.
- Shruthi, B.S.; Vinodhkumar, P.; Selvamani. Proteomics: A new perspective for cancer. Adv. Biomed. Res. 2016, 5, 67.
- Yakkioui, Y.; Temel, Y.; Chevet, E.; Negroni, L. Integrated and Quantitative Proteomics of Human Tumors. Methods Enzym. 2017, 586, 229–246.
- Vazquez, A.; Kamphorst, J.J.; Markert, E.K.; Schug, Z.T.; Tardito, S.; Gottlieb, E. Cancer metabolism at a glance. J. Cell Sci. 2016, 129, 3367–3373.
- Armitage, E.G.; Ciborowski, M. Applications of Metabolomics in Cancer Studies. Adv. Exp. Med. Biol 2017, 965, 209–234.
- Yang, K.; Han, X. Lipidomics: Techniques, Applications, and Outcomes Related to Biomedical Sciences. Trends Biochem. Sci. 2016, 41, 954–969.
- Perrotti, F.; Rosa, C.; Cicalini, I.; Sacchetta, P.; Del Boccio, P.; Genovesi, D.; Pieragostino, D. Advances in Lipidomics for Cancer Biomarkers Discovery. Int. J. Mol. Sci. 2016, 17.
- Aggio, R.; Villas-Boas, S.G.; Ruggiero, K. Metab: An R package for high-throughput analysis of metabolomics data generated by GC-MS. Bioinformatics 2011, 27, 2316–2318.
- Stanstrup, J.; Broeckling, C.D.; Helmus, R.; Hoffmann, N.; Mathe, E.; Naake, T.; Nicolotti, L.; Peters, K.; Rainer, J.; Salek, R.M.; et al. The metaRbolomics Toolbox in Bioconductor and beyond. Metabolites 2019, 9.
- Mohamed, A.; Molendijk, J.; Hill, M.M. lipidr: A Software Tool for Data Mining and Analysis of Lipidomics Datasets. J. Proteome Res. 2020.
- Jansen, P.; van den Berg, L.; van Overveld, P.; Boiten, J.W. Research Data Stewardship for Healthcare Professionals. Fundam. Clin. Data Sci. 2019, 37–53.
- Grossman, R.L.; Heath, A.P.; Ferretti, V.; Varmus, H.E.; Lowy, D.R.; Kibbe, W.A.; Staudt, L.M. Toward a Shared Vision for Cancer Genomic Data. N. Engl. J. Med. 2016, 375, 1109–1112.
- McPherson, S. Collaboration Generates Most Complete Cancer Genome Map. 2020. Available online: (accessed on 30 May 2020).
- Cerami, E.; Gao, J.; Dogrusoz, U.; Gross, B.E.; Sumer, S.O.; Aksoy, B.A.; Jacobsen, A.; Byrne, C.J.; Heuer, M.L.; Larsson, E.; et al. The cBio cancer genomics portal: An open platform for exploring multidimensional cancer genomics data. Cancer Discov. 2012, 2, 401–404.
- Louhimo, R.; Hautaniemi, S. CNAmet: An R package for integrating copy number, methylation and expression data. Bioinformatics 2011, 27, 887–888.
- Yoo, B.C.; Kim, K.H.; Woo, S.M.; Myung, J.K. Clinical multi-omics strategies for the effective cancer management. J. Proteom. 2018, 188, 97–106.
- Ramos, M.; Schiffer, L.; Re, A.; Azhar, R.; Basunia, A.; Rodriguez, C.; Chan, T.; Chapman, P.; Davis, S.R.; Gomez-Cabrero, D.; et al. Software for the Integration of Multiomics Experiments in Bioconductor. Cancer Res. 2017, 77, e39–e42.
- Consortia. STATegRa: Classes and methods for multi-omics data integration. R Package Version 1.24.0. 2020. Available online: (accessed on 30 May 2020).
- Martínez-Mira, C.; Conesa, A.; Tarazona, S. MOSim: Multi-Omics Simulation in R. bioRxiv 2018, 421834.
- Gomez-Cabrero, D.; Abugessaisa, I.; Maier, D.; Teschendorff, A.; Merkenschlager, M.; Gisel, A.; Ballestar, E.; Bongcam-Rudloff, E.; Conesa, A.; Tegner, J. Data integration in the era of omics: Current and future challenges. BMC Syst. Biol. 2014, 8 (Suppl. 2), 1.
- Voillet, V.; Besse, P.; Liaubet, L.; San Cristobal, M.; Gonzalez, I. Handling missing rows in multi-omics data integration: Multiple imputation in multiple factor analysis framework. BMC Bioinform. 2016, 17, 402.
- Pigott, T.D. A Review of Methods for Missing Data. Educ. Res. Eval. 2001, 7, 353–383.
- Van Iterson, M.; Cats, D.; Hop, P.; BIOS Consortium; Heijmans, B.T. omicsPrint: Detection of data linkage errors in multiple omics studies. Bioinformatics 2018, 34, 2142–2143.
- Meng, C.; Zeleznik, O.A.; Thallinger, G.G.; Kuster, B.; Gholami, A.M.; Culhane, A.C. Dimension reduction techniques for the integrative analysis of multi-omics data. Brief. Bioinform 2016, 17, 628–641.
- Brazma, A.; Culhane, A.C. Algorithms for gene expression analysis. In Encyclopedia of Genetics, Genomics, Proteomics and Bioinformatics; John Wiley & Sons, Inc.: Hoboken, NJ, USA, 2005.
- Streicher, K.L.; Zhu, W.; Lehmann, K.P.; Georgantas, R.W.; Morehouse, C.A.; Brohawn, P.; Carrasco, R.A.; Xiao, Z.; Tice, D.A.; Higgs, B.W.; et al. A novel oncogenic role for the miRNA-506-514 cluster in initiating melanocyte transformation and promoting melanoma growth. Oncogene 2012, 31, 1558–1570.
- Biton, A.; Bernard-Pierrot, I.; Lou, Y.; Krucker, C.; Chapeaublanc, E.; Rubio-Pérez, C.; López-Bigas, N.; Kamoun, A.; Neuzillet, Y.; Gestraud, P.; et al. Independent component analysis uncovers the landscape of the bladder tumor transcriptome and reveals insights into luminal and basal subtypes. Cell Rep. 2014, 9, 1235–1245.
- Das, S.; Tripathy, D.S. OMICsPCA: An. R Package for Quantitative Integration and Analysis of Multiple Omics Assays from Heterogeneous Samples. R Package Version 1.5.0. 2019. Available online: (accessed on 30 May 2020).
- Xu, T.; Le, T.D.; Liu, L.; Su, N.; Wang, R.; Sun, B.; Colaprico, A.; Bontempi, G.; Li, J. CancerSubtypes: An R/Bioconductor package for molecular cancer subtype identification, validation and visualization. Bioinformatics 2017, 33, 3131–3133.
- Meng, C.; Kuster, B.; Culhane, A.C.; Gholami, A.M. A multivariate approach to the integration of multi-omics datasets. BMC Bioinform. 2014, 15, 162.
- Mezhoud, K. bioCancer: Interactive Multi-Omics Cancers Data Visualization and Analysis. R package version 1.16.0. 2020. Available online: (accessed on 30 May 2020).
- Shen, R.; Olshen, A.B.; Ladanyi, M. Integrative clustering of multiple genomic data types using a joint latent variable model with application to breast and lung cancer subtype analysis. Bioinformatics 2009, 25, 2906–2912.
- Freytag, S. schex: Hexbin plots for single cell omics data. R package version 1.2.0. Available online: (accessed on 30 May 2020).
- Krzywinski, M.; Schein, J.; Birol, I.; Connors, J.; Gascoyne, R.; Horsman, D.; Jones, S.J.; Marra, M.A. Circos: An information aesthetic for comparative genomics. Genome Res. 2009, 19, 1639–1645.
- Luo, W.; Brouwer, C. Pathview: An R/Bioconductor package for pathway-based data integration and visualization. Bioinformatics 2013, 29, 1830–1831.
- Sales, G.; Calura, E.; Cavalieri, D.; Romualdi, C. Graphite—A Bioconductor package to convert pathway topology to gene network. BMC Bioinform. 2012, 13, 20.
- Syed-Abdul, S.; Iqbal, U.; Jack Li, Y.C. Predictive Analytics through Machine Learning in the clinical settings. Comput Methods Programs Biomed. 2017, 144, A1–A2.
- Rohart, F.; Gautier, B.; Singh, A.; Le Cao, K.A. mixOmics: An R package for ‘omics feature selection and multiple data integration. PLoS Comput. Biol. 2017, 13, e1005752.
- Singh, A.; Shannon, C.P.; Gautier, B.; Rohart, F.; Vacher, M.; Tebbutt, S.J.; Le Cao, K.A. DIABLO: An integrative approach for identifying key molecular drivers from multi-omics assays. Bioinformatics 2019, 35, 3055–3062.
- Argelaguet, R.; Velten, B.; Arnol, D.; Dietrich, S.; Zenz, T.; Marioni, J.C.; Buettner, F.; Huber, W.; Stegle, O. Multi-Omics Factor Analysis-a framework for unsupervised integration of multi-omics data sets. Mol. Syst. Biol. 2018, 14, e8124.
- Rinaudo, P.; Boudah, S.; Junot, C.; Thevenot, E.A. biosigner: A New Method for the Discovery of Significant Molecular Signatures from Omics Data. Front. Mol. Biosci. 2016, 3, 26.
- Hernandez-Ferrer, C.; Wellenius, G.A.; Tamayo, I.; Basagana, X.; Sunyer, J.; Vrijheid, M.; Gonzalez, J.R. Comprehensive study of the exposome and omic data using rexposome Bioconductor Packages. Bioinformatics 2019, 35, 5344–5345.
- Metwally, A.A.; Zhang, T.; Snyder, M. OmicsLonDA: Omics Longitudinal Differential Analysis. R package version 1.4.0. 2020. Available online: (accessed on 30 May 2020).
- Calura, E.; Martini, P.; Sales, G.; Beltrame, L.; Chiorino, G.; D’Incalci, M.; Marchini, S.; Romualdi, C. Wiring miRNAs to pathways: A topological approach to integrate miRNA and mRNA expression profiles. Nucleic Acids Res. 2014, 42, e96.
- Wachter, A.; Beissbarth, T. pwOmics: An R package for pathway-based integration of time-series omics data using public database knowledge. Bioinformatics 2015, 31, 3072–3074.
- Boyle, E.I.; Weng, S.; Gollub, J.; Jin, H.; Botstein, D.; Cherry, J.M.; Sherlock, G. GO::TermFinder--open source software for accessing Gene Ontology information and finding significantly enriched Gene Ontology terms associated with a list of genes. Bioinformatics 2004, 20, 3710–3715.
- Subramanian, A.; Tamayo, P.; Mootha, V.K.; Mukherjee, S.; Ebert, B.L.; Gillette, M.A.; Paulovich, A.; Pomeroy, S.L.; Golub, T.R.; Lander, E.S.; et al. Gene set enrichment analysis: A knowledge-based approach for interpreting genome-wide expression profiles. Proc. Natl. Acad. Sci. USA 2005, 102, 15545–15550.
- Meng, C.; Basunia, A.; Peters, B.; Gholami, A.M.; Kuster, B.; Culhane, A.C. MOGSA: Integrative Single Sample Gene-set Analysis of Multiple Omics Data. Mol. Cell Proteom. 2019, 18, S153–S168.
- Rodriguez, J.C.; Merino, G.A.; Llera, A.S.; Fernandez, E.A. Massive integrative gene set analysis enables functional characterization of breast cancer subtypes. J. Biomed. Inf. 2019, 93, 103157.
- Odom, G.J.; Ban, Y.; Colaprico, A.; Liu, L.; Silva, T.C.; Sun, X.; Pico, A.R.; Zhang, B.; Wang, L.; Chen, X. PathwayPCA: An R/Bioconductor Package for Pathway Based Integrative Analysis of Multi-Omics Data. Proteomics 2020, e1900409.
- Dinalankara, W.; Ke, Q.; Xu, Y.; Ji, L.; Pagane, N.; Lien, A.; Matam, T.; Fertig, E.J.; Price, N.D.; Younes, L.; et al. Digitizing omics profiles by divergence from a baseline. Proc. Natl. Acad. Sci. USA 2018, 115, 4545–4552.
- Zeeberg, B.R.; Feng, W.; Wang, G.; Wang, M.D.; Fojo, A.T.; Sunshine, M.; Narasimhan, S.; Kane, D.W.; Reinhold, W.C.; Lababidi, S.; et al. GoMiner: A resource for biological interpretation of genomic and proteomic data. Genome Biol. 2003, 4, R28.
- Folger, O.; Jerby, L.; Frezza, C.; Gottlieb, E.; Ruppin, E.; Shlomi, T. Predicting selective drug targets in cancer through metabolic networks. Mol. Syst. Biol. 2011, 7, 501.
- García-Campos, M.A.; Espinal-Enríquez, J.; Hernández-Lemus, E. Pathway Analysis: State of the Art. Front. Physiol. 2015, 6, 383.
- Rocha, D.; García, I.A.; González Montoro, A.; Llera, A.; Prato, L.; Girotti, M.R.; Soria, G.; Fernández, E.A. Pan-Cancer Molecular Patterns and Biological Implications Associated with a Tumor-Specific Molecular Signature. Cells 2020, 10, 45.
- Baloni, P.; Dinalankara, W.; Earls, J.C.; Knijnenburg, T.A.; Geman, D.; Marchionni, L.; Price, N.D. Identifying Personalized Metabolic Signatures in Breast Cancer. Metabolites 2020, 11, 20.
More