Machine learning (ML) and artificial intelligence (AI) have enabled the identification of highly predictive, disease-specific biomarkers.
- biomarkers
- imaging
- machine learning
- MRI
- oncology
1. Introduction
Imaging is routinely used for cancer diagnosis and staging, for monitoring treatment efficacy, for detecting disease recurrence, or generally for cancer surveillance [1][2][3][4][1,2,3,4]. Understanding the anatomical and physiological aspects of medical images allows experts to distinguish aberrant from normal appearance [5]. Advances in analytical methods and the application of machine learning methods enabled the use of medical images as biomarkers that can potentially optimize cancer care and improve clinical outcome [5]. The imaging biomarkers that are currently, and successfully, used for clinical diagnosis have attracted many researchers’ attention as described in multiple publications [1][5][6][7][8][9][10][11][12][13][14][15][16][17][18][1,5,6,7,8,9,10,11,12,13,14,15,16,17,18].
Magnetic resonance imaging (MRI) is a diagnostic imaging technique that applies strong magnetic and radio waves to generate high quality MRI scans of body organs facilitating the diagnosis of tumors and other conditions such as brain and spinal cord diseases. Currently, MRI is one of the of the big data producers in biomedicine, and is being exploited as important generator of cancer biomarkers. In essence, a biomarker is a characteristic that is measured as an indicator of a biological condition of interest (i.e., normal biological processes, pathogenic processes, or responses to a therapeutic intervention) [19][20][19,20]. The process of biomarker prioritization starts with a theory and ends with biomarker validation in an experimental setting. However, the current dogmas in biomedicine may hinder the process of unbiased hypothesis generation due to the complexity of cancer phenotypes and patient attributes, which makes it harder for human experts and physicians to comprehend all the details in MRI scans [21]. This led to the rise MRI biomarkers, identified by ML, that could capture disease characteristics with high accuracy, efficiency, reproducibility and interpretability [5][22][5,22].
2. Imaging Biomarkers
Biomarker stands for biological marker and it is defined by the U.S. Food and Drug Administration (FDA) as “a defined characteristic that is measured as an indicator of normal biological processes, pathogenic processes, or responses to an exposure or intervention, including therapeutic interventions” [23]. Biomarkers can measure anatomical, histological, physiological, molecular, and radiographic characteristics. Imaging biomarkers are convenient and reliable [5]. In oncology, they represent comprehensive cancer features such as apoptosis, angiogenesis, growth, metabolism, invasion, metastasis, and selective target interaction [24]. Cancer imaging biomarkers are widely used for cancer identification, for the prediction of disease outcome, and for monitoring treatment responses [5]. Examples of imaging biomarkers include Tumor, Node, Metastasis (TNM) reflecting a staging system (i.e., a prognostic biomarker) and Response Evaluation Criteria in Solid Tumors (RECIST) which can be applied as a response biomarker [1]. Confirmed imaging biomarkers are used to support decision-making in clinical practice. The necessity for quantitative evaluation in diagnosis must be validated [5]. Quantitative approach is profound and exhaustive due to technology and apparatus differences as well as quantitative development that influences the extracted data [5]. The well-established QA and QC protocols are perquisite to validate and approve the reliability of medical assessment along with endeavor made by research, radiological, and medical institution [5]. In addition, significant factors should be considered such as isolating normal healthy from ailment tissues to achieve better diagnosis [5]. Table 1 provides a summary of the various types of imaging biomarkers used in cancer besides MRI.
Table 1. Imaging biomarkers for disease detection with examples.
| Disease | Biomarker | Quantitative (Q)/Semi-Quantitative (SQ)/Non-Quantitative (NQ) | Biomarkers Uses |
|---|---|---|---|
| Malignant disease | Lung RADS, pancreatic cancer action network (PanCan), national comprehensive cancer network (NCCN) criteria [25][26][25,26] |
SQ | AUC for malignancy 0.81–0.87 [27] |
| CT blood flow, perfusion, permeability measurements |
Q | Sensitivity 0.73, specificity 0.70 [28] AUC 0.75, sensitivity 0.79, specificity 0.75 [29] |
|
| Breast imaging (BI)-RADS [30] Prostate imaging (PI)-RADS [29] Liver imaging (LI)-RADS [31] |
SQ | positive predictive value (PPV) BI-RADS 0 14.1%, BI-RADS 4 39.1%, BI-RADS 5 92.9% PI-RADS 2 pooled sensitivity 0.85, pooled specificity 0.71 pooled sensitivity for malignancy 0.93 |
|
| Apparent diffusion coefficient (ADC) | Q | Liver AUC 0.82–0.95 Prostate AUC 0.84 |
|
| RECIST/morphological volume |
Q | Ongoing guidelines for treatment evaluation [32] | |
| Positron emission response criteria in solid tumors (PERCIST) /metabolic Volume [33] |
Q | Ongoing guidelines for treatment evaluation [32] | |
| Liver cancer Recurrent glioblastoma |
Dynamic contrast enhanced (DCE) metrics (perfusion parameters Ktrans, Kep, blood flow, Ve) |
Q | Hepatocellular cancer AUC 0.85, sensitivity 0.85, specificity 0.81 [29] Brain- Ktrans accuracy 86% [34] |
| Cancer Sarcoma [35] Lung cancer [36] |
18FDG- standardized uptake value (SUV) |
Q | Sarcoma-sensitivity 0.91, specificity 0.85, accuracy 0.88 Lung-sensitivity 0.68–0.95 |
| Cancer | Targeted radionuclides [37] In-octreotide [38][39][38,39] 68Gallium (Ga)-DOTA-TOC [39] and 68Ga DOTA-TATE [39][40][41][39,40,41] 68Ga prostate-specific membrane antigen (PSMA) [42] |
NQ | Sensitivity 97%, specificity 92% for octreotide [43] Sensitivity 100%, specificity 100% for PSMA [44] |
| Brain cancer | Dynamic susceptibility contrast (DSC)-MRI | SQ | AUC = 0.77 for classifying glioma grades II and III [45] |
| Glioma | Adjuvant paclitaxel and trastuzumab (APT) trial | Q | APT accords with cancer grade and Ki67 index [46] |
| Rectal cancer Lung cancer |
DCE-CT parameters Blood flow, permeability |
Q | Blood flow 75% accuracy for detecting rectal cancers with lymph node metastases [47] CT permeability anticipated survival regardless of treatment in lung cancer [48] |
| Cervix cancer Endometrial cancer Rectal cancer Breast cancer |
DCE-MRI parameters |
Q | Cancer volume with increasing metrics is considered a significant independent factor for disease-free survival (DFS) and overall survival (OS) in cervical cancer [49] Low cancer blood flow and low rate constant for contrast agent intravasation (kep) correlated with high risk of endometrial cancer [50] Ktrans, Kep and Ve are higher in rectal cancers accompanied with metastasis [51] Ktrans, iAUC qualitative and ADC anticiptate low-risk breast cancers (AUC of combined parameters 0.78) |
| Diverse cancer types [52][53][52,53] | Radiomic signature [54] DCE-MR parameters |
Q | Data endpoints, feature detection protocols, and classifiers are important factors in lung cancer prediction [55] Radiomic signature is significantly associated with lymph node (LN) status in colorectal cancer [56] Evaluating therapeutic effect subsequent to antiangiogenic agents [57] |
| Lymphoma | Deauville or response evaluation criteria in lymphoma (RECIL) score on 18F-FDG-PET |
SQ | Assessment of lymphoma treatment in clinical trials employs the summation of longest diameters of three target lesions [58] |
| Breast cancer [59] Prostate cancer [60] |
Receptor tyrosine-protein kinase erbB-2, CD340, and HER2 prostate-specific membrane antigen (PSMA) |
SQ | Selective cancer receptor; investigation of cancer treatment on receptor expression. Assessing therapy response to antiangiogenic agents [57] |
| Oesophageal cancer |
CT perfusion/blood flow | Q | Multivariate analysis detects blood flow as a predictor of response [61] |
| Gastrointestinal stromal cancers |
CT density HU | Q | Decrease in cancer density of > 15% on CT associated with a sensitivity of 97% and a specificity of 100% in identifying PET responders compared to 52% and 100% by RECIST [61] |
3. MRI Biomarkers
MRI can be exploited to extract numerous variables according to diverse inherent tissue properties such as proton density, diffusion, and T1-and T2 relaxation times [1]. In addition, MRI can probe the alterations in parameters due to the association of macromolecules and contrast agents [5]. For example, the apparent diffusion coefficient (ADC) is an extensively used criterion in cancer identification [16][62][16,62], diagnosis, and treatment assessment [63][64][63,64]. However, post-processing tools to derive absolute quantitation are widely disputed [65][66][67][65,66,67], although the protocol itself is versatile and reliable for cancer detection [68]. Quantification of T1 relaxation has an impact on cardiovascular MRI rather than depending on image contrast [69]. T1 values are significant in differentiating cardiac inflammation [70], multiple sclerosis [71][72][71,72], liver fat and iron concentration [73][74][73,74], and endocrine glands [75].
Quantitative chemical exchange saturation transfer (CEST) imaging is promising in evaluating brain ischemic disease [76], osteoarthritis [77], lymphedema [78], cancer pH and metabolomics [79]. Furthermore, MRI offers beneficial effects such as optimum images distinction, superior resolution, providing many contrasts per each testing; probing histological features (oxygenation, perfusion, and angiogenesis) [1].
Distinctive MRI biomarkers have been assigned in cancer diagnosis [1] including Breast Imaging Reporting and Data System (BI-RADS) [2], Liver Imaging Reporting and Data System (LI-RADS) [80][81][80,81], Prostate Imaging Reporting and Data System (PI-RADS) [4], TNM, and RECIST [1]. Quantitative biomarkers have been employed in clinical research studies such as initial area under the gadolinium curve (iAUGC) or transfer constant (Ktrans) from dynamic gadolinium enhanced (DGE) imaging and apparent diffusion coefficient (ADC) [1]. Morphological-based cancer biomarkers use many contrasts and moderate to high spatial resolution of MRI [1][82][83][84][1,82,83,84]. T1-weighted and T2-weighted imaging are utilized in cancer profiling [1].
4. MRI Data Preprocessing
Applying machine learning directly on raw MRI scans often yields poor results due to noise and information redundancy. Furthermore, machines read and store images in the form of number matrices. Raw MRI data are transformed into numerical features that can be processed by machines while preserving the information in the original data set.
5. Machine Learning for MRI Data
Machine learning (ML) algorithms are becoming useful components of computer-aided disease diagnosis and decision support systems. Computers seem to be able to recognize patterns that humans cannot perceive. Hence, ML provides a tool to analyze and utilize a massive amount of data more efficiently than the conventional analysis carried by human. This realization has led to heightened interest in ML and AI applications to medical images. Recently, employing ML in analyzing big data resulting from medical images, including MRI data, have been useful in obtaining significant clinical information that can aid physicians in making important decisions regarding clinical diagnosis, clinical prognosis, or treatment outcome [55][85][86][55,85,86]. ML can be used also to prioritize MRI biomarkers. The workflow for prioritizing MRI biomarkers using ML is summarized in Figure 1.
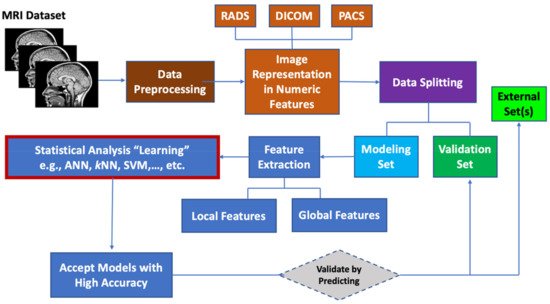
Figure 1. Workflow for prioritizing ML MRI biomarkers.
(Editors will rearrange the references after the entry is submitted)