MR spectroscopy (MRS) and spectroscopic imaging (MRSI) obtain metabolic information noninvasively from nuclei spins. For in vivo applications, common MR-active nuclei are protons (1H), phosphorus (31P), carbon (13C), sodium (23Na), and xenon (129Xe). The most common are protons due to their high gyromagnetic ratio and natural abundance in the human body. Since most metabolic processes involve carbon, 13C spectroscopy is a valuable method to measure in vivo metabolism noninvasively [1,2,3]. 13C spectra are characterized by a large spectral range (162–185 ppm), narrow line widths, and low sensitivity due to the low gyromagnetic ratio (a quarter as compared to protons) and natural abundance of 1.1% in vivo. However, the sensitivity can be increased with the use of 13C-enriched agents and by hyperpolarization.
Hyperpolarized (HP) 13C MRI is a method that magnetizes 13C probes to dramatically increase signal as compared to conventional MRI [3]. Metabolic and functional HP 13C MRI is a promising diagnostic tool for detecting disorders linked to altered metabolism such as cancer, diabetes, and heart diseases [4], increasing sensitivity sufficiently to map metabolic pathways in vivo without the use of ionizing radiation, as in positron emission tomography (PET) imaging. Metabolic imaging using HP 13C compounds has been translated successfully into single-organ examinations in healthy controls and various patient populations.
MR spectroscopy (MRS) and spectroscopic imaging (MRSI) obtain metabolic information noninvasively from nuclei spins. For in vivo applications, common MR-active nuclei are protons (1H), phosphorus (31P), carbon (13C), sodium (23Na), and xenon (129Xe). The most common are protons due to their high gyromagnetic ratio and natural abundance in the human body. Since most metabolic processes involve carbon, 13C spectroscopy is a valuable method to measure in vivo metabolism noninvasively [1,2,3]. 13C spectra are characterized by a large spectral range (162–185 ppm), narrow line widths, and low sensitivity due to the low gyromagnetic ratio (a quarter as compared to protons) and natural abundance of 1.1% in vivo. However, the sensitivity can be increased with the use of 13C-enriched agents and by hyperpolarization.
Hyperpolarized (HP) 13C MRI is a method that magnetizes 13C probes to dramatically increase signal as compared to conventional MRI [3]. Metabolic and functional HP 13C MRI is a promising diagnostic tool for detecting disorders linked to altered metabolism such as cancer, diabetes, and heart diseases [4], increasing sensitivity sufficiently to map metabolic pathways in vivo without the use of ionizing radiation, as in positron emission tomography (PET) imaging. Metabolic imaging using HP 13C compounds has been translated successfully into single-organ examinations in healthy controls and various patient populations [5,6,7,8,9,10].
- hyperpolarized carbon-13 MRI
- review
- clinical application
1. Hyperpolarized Carbon-13 MRI
13
Figure 1) [1]. A sample of the probe (typically (1-
13
13C-enriched molecules of the sample, which typically takes 30–180 min [2][3][4]. Following this procedure, the sample is then rapidly dissolved in a hot water solution to obtain an injectable solution matching the body pH, temperature, and osmolarity before injection. After a final quality assessment, the hyperpolarized solution can be injected into the subject, preferably via an injector. Following the injection of the probe, optimized fast MR sequences for the targeted organs image the uptake and subsequent metabolic conversion of the hyperpolarized
13
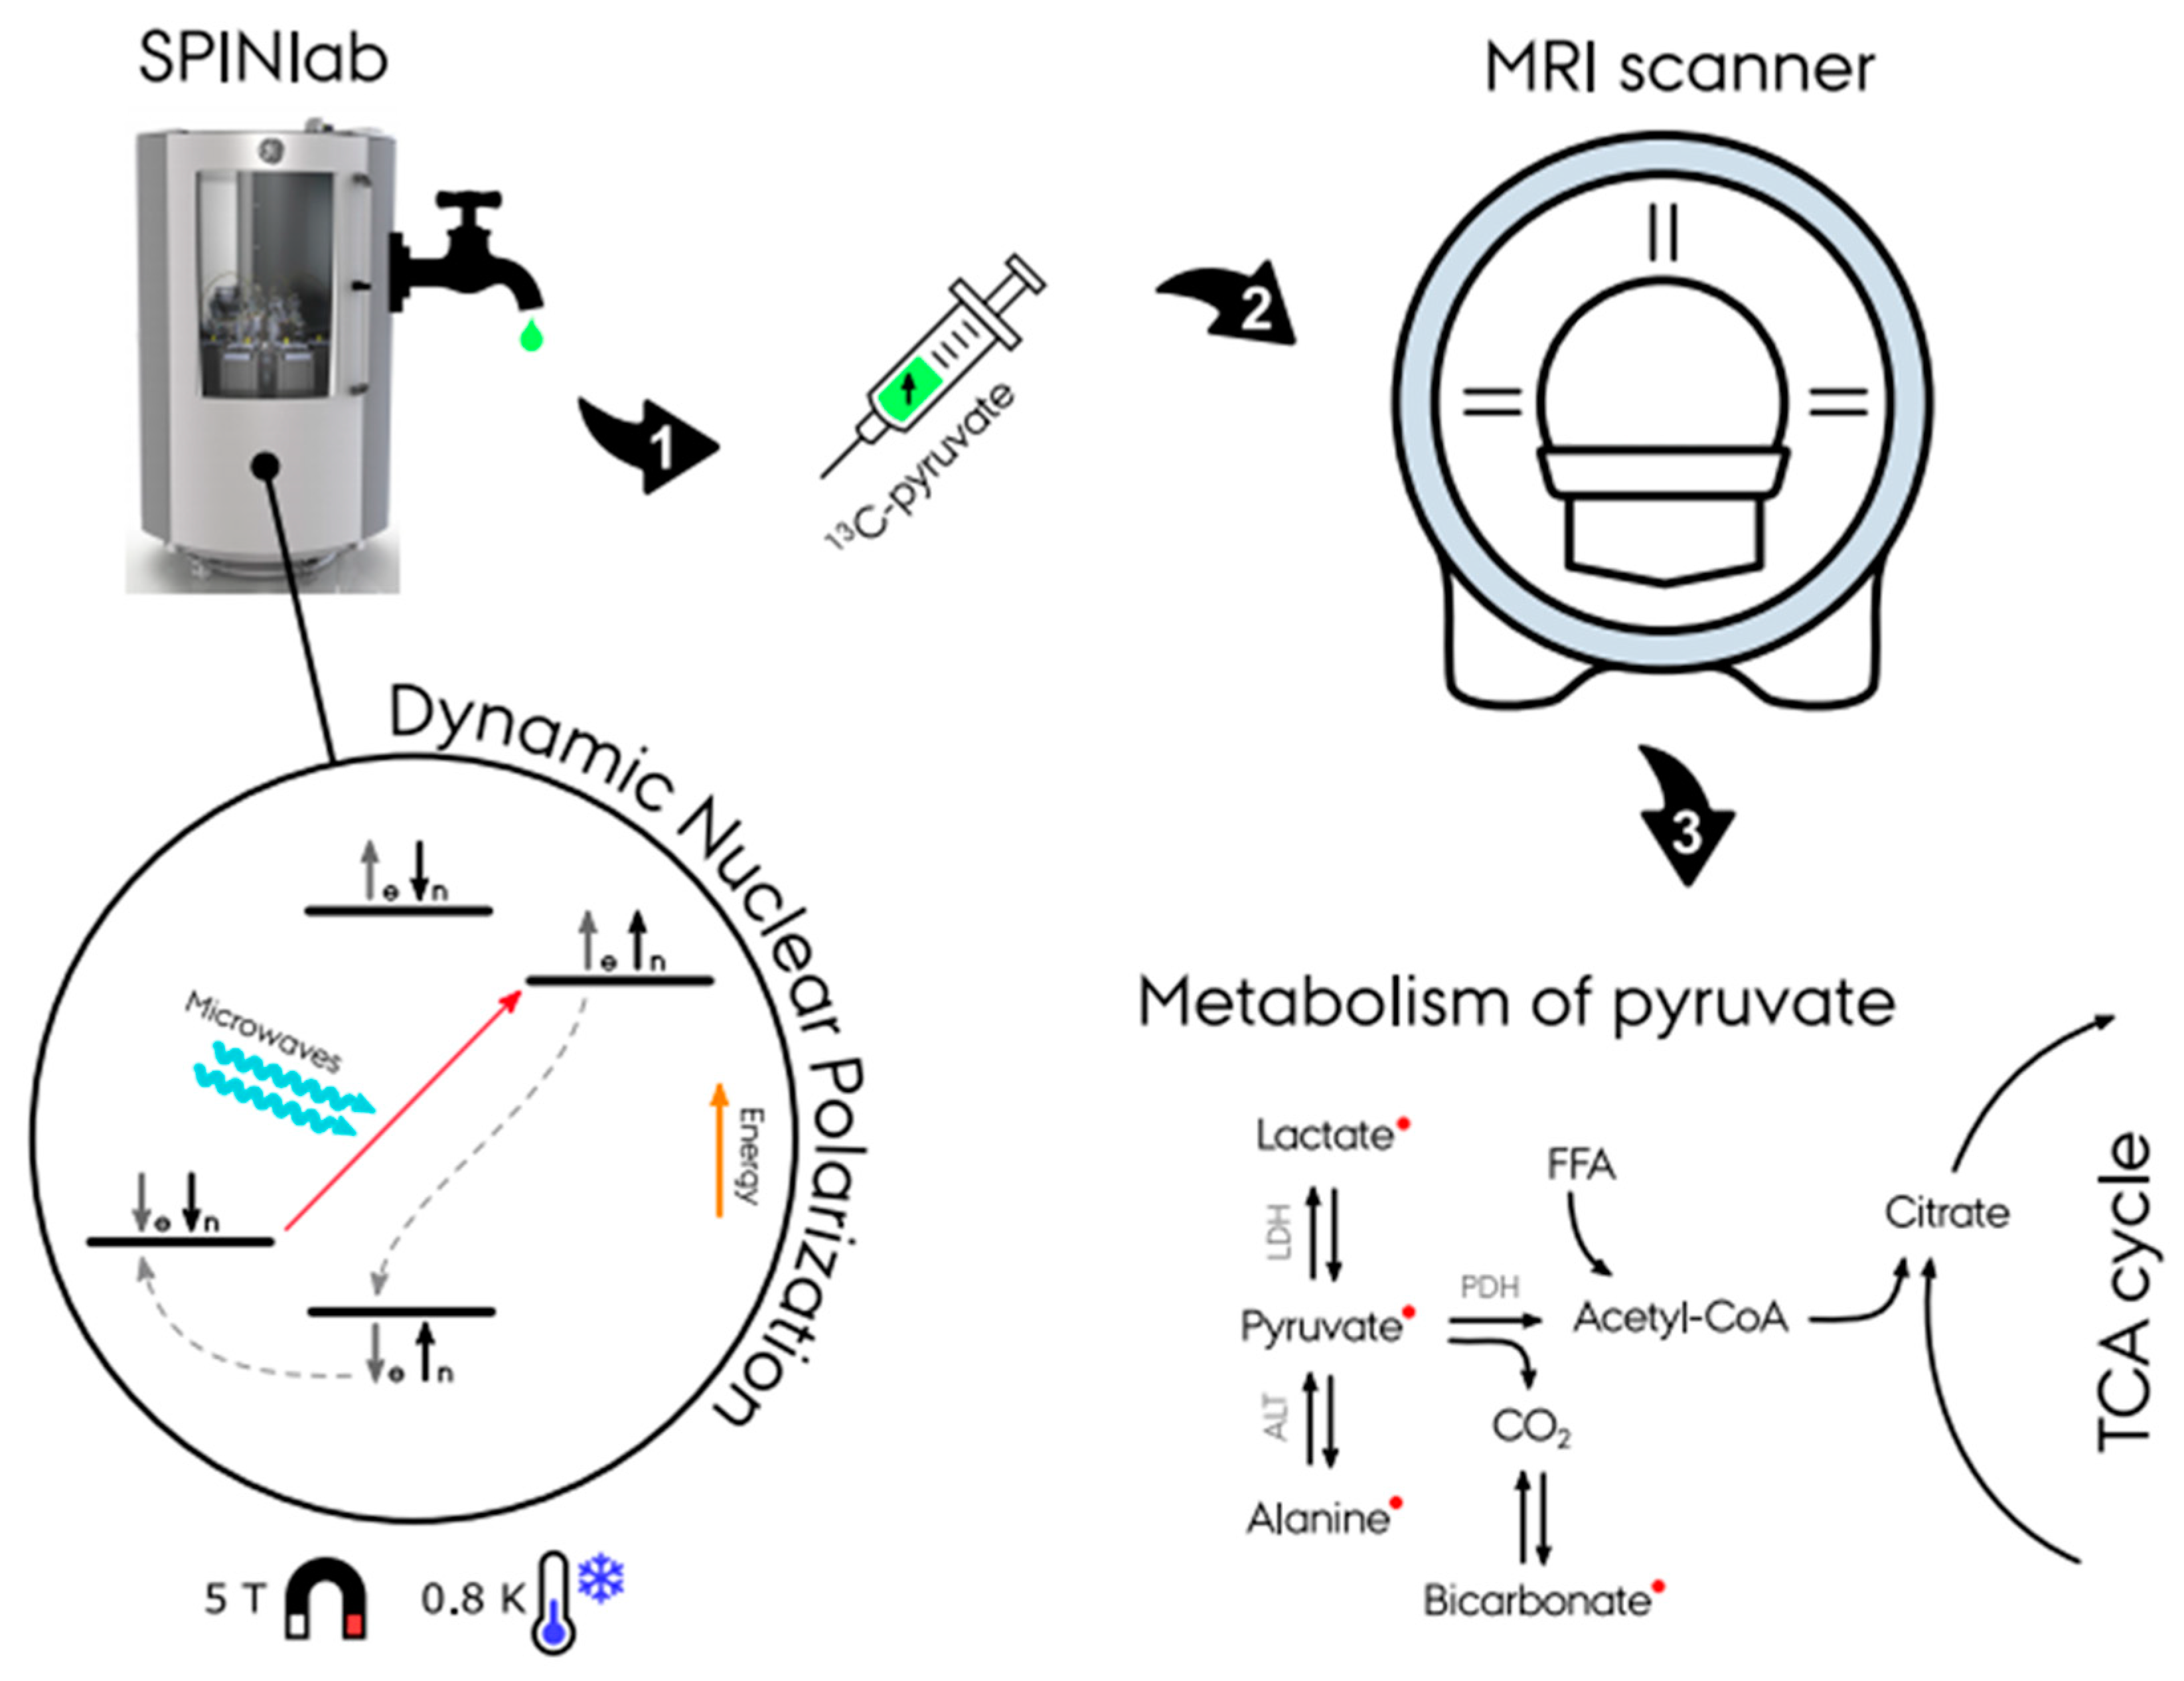
Figure 1.
13
13C probes currently includes more than 24 different metabolites. A description of their chemical structures is given by Keshari et al. [5]. A description of the T1, chemical shift, applications, metabolic, and physiological processes of the most common probes has recently been published in a paper by Wang et al. and is considered outside the scope of this paper [3].
2. Applications of Hyperpolarized Carbon-13 MRI
2.1. Hyperpolarized [1-13C]pyruvate: The Most Used Biomarker
2
2
13
13
13
3-) by the enzyme PDH [6].
2.2. Oncology
13C MRI are dominated by oncologic applications because this technology is particularly well suited for studying cancer. Elevated glycolysis and thus lactate production even under sufficient oxygen availability, denoted by the Warburg effect [7], is a fundamental property of many cancers [8]. This phenomenon is indicated by an upregulation of the pyruvate to lactate conversion [9]. Therefore, imaging of the metabolic conversion of [1-
13
13C]lactate holds particular promise for cancer diagnosis as well as monitoring of response to treatment [10]. The first clinical
13C study targeted prostate cancer in 2013 [11]. As of today, [1-
13C]pyruvate has been applied clinically in several different cancer types ranging from prostate [11][11][12][13][14][15][16][17][18], pancreas [19], breast [20][21][22], brain [23][24][25], to kidney [26]. However, several studies are on the way as indicated by assessment of studies on clinical.trails.gov (
Table A2). Future clinical studies might include probes such as urea (perfusion) and glutamine [27].
2.3. Brain
The metabolic imaging of the brain has been applied in multiple sclerosis [28], stroke [29], traumatic brain injury [30][31][32], and brain tumors (mentioned in the Oncology section). Brain metabolism must consider the blood–brain barrier (BBB), which limits the uptake into brain tissue of hyperpolarized probes and thus ultimately the obtainable signal in the brain. This has been an obstacle for pre-clinical studies in which the animals are anesthetized [33][34][35]. Conventionally, anesthetics are not needed in brain studies in humans; nevertheless, in some cases of intensive care patients, children (2–10 years old), or claustrophobic patients it may be preferred to apply sedation prior to the examinations, though this method can complicate metabolic response. Brain studies using multichannel receiver head coils can increase cortical signal at the expense of inhomogeneous receiver profiles and less signal-to-noise ratio (SNR) in the center of the brain [36][37][38][39]. Clinical trials of the brain (non-cancer) are reported in three studies on healthy brain (n = 4 [40]; n = 4 [4]; n = 14 [2]).
2.4. Cardiovascular Disease
The MRI of cardiovascular diseases commonly evaluates the restriction of blood flow and ischemic areas of the heart [41]. It is, however, well established that the metabolic balance between the fat and sugar utilization of the heart is important in determining the underlying pathophysiology and best treatment for the individual patient [42]. HP
13C MRI has been shown to measure the metabolism and perfusion of the heart [43], which can be advantageous for evaluation of myocardial complications associated with diabetes, ischemic heart disease, cardiac hypertrophy, and heart failure [44][45]. The ability to image in rapid succession ensures that HP
13C MRI can be incorporated in stress test imaging sessions without adding significant time to these protocols. Cardiac imaging protocols need to consider cardiac cycle timing, motion correction, distortion correction, etc. [46][47]. To date, only a few clinical studies have been performed on the heart covering initially normal hearts (n = 4) [48] and later hearts of patients with type 2 diabetes (T2MD = 5, HC = 5) [49]. Evaluation of the pre-clinical literature supports a growing intention for the transition of HP
13C MRI towards cardiac applications [50].
2.5. Kidney Disease
There is a lack of good biomarkers for early diagnosis, patient stratification, and treatment monitoring for kidney diseases. MRI is increasingly being used to characterize important pathophysiological processes such as perfusion, fibrosis, and oxygenation [51][52].
2
13C]pyruvate studies have been demonstrated to allow differentiation of various renal pathophysiological conditions in pre-clinical models of diabetes, acute kidney disease (AKI), and chronic kidney disease (CKD) [53][54][55][56]. The use of gadolinium-based contrast agents is contraindicated in patients with renal insufficiency [57]. Thus, alternative non gadolinium-based biomarkers to noninvasively determine hemodynamic properties, perfusion, and glomerular filtrations constitute a valuable tool for a patient group in which repeated exposure to ionizing radiation is a concern [58][59][60]. Currently, only one non-cancer human kidney study is underway.
13
13
13
13C-urea [61] and [1-
13C]lactate [62]. Alternative biomarkers with improved relaxation properties also hold great promise in perfusion assessment [63].
2.6. Liver Disease
13C MRI in diagnosis and monitoring of compilations related to liver disease in pre-clinical studies [64][65][66][67]. Examples include the assessment of hepatic metabolism in non-alcoholic fatty liver disease (NAFLD) induced by a high-fat diet (HFD) in rats [68] or the effect of liver metabolism in inflammatory liver injury [69] and ethanol consumption as an early indicator of complications related to fatty liver disease, hepatitis, cirrhosis, and cancer [70]. Furthermore, assessment of metabolism in genetically modified knockout [71][72][73] and insulin-deficient rodent models [73][74] has been studied in detail. Like kidney, liver disease imaging is limited in human studies; however, one study has been reported on clinicaltrials.gov as “active, not recruiting” on the effect of fatty liver disease (
Table A1). Recently a novel hyperpolarized probe, [2-13C]dihydroxyacetone (DHAc), has been applied to enable estimation of liver metabolism (gluconeogenesis, glycolysis, and the glycerol pathways), and this could very well be an important finding for further clinical attention [75].
2.7. Technical Advances
2.7.1. Polarizer
Multiple methods to achieve hyperpolarization have been explored including brute force polarization, parahydrogen-induced polarization (PHIP)-based methods [76][77][78], and dynamic nuclear polarization (DNP). Currently, the only polarization process approved to be used for clinical studies of carbon-13 is DNP [1].
Brute force polarization is achieved by placing the probe in a strong magnetic field at a temperature close to 0 K [79]. While the method is straightforward to apply, it is very impractical and not useable for in vivo experiments given the temperature and very long T1 times in the solid state.
PHIP utilizes the change in parahydrogen and orthohydrogen spin states at low temperatures. Hydrogen molecules exists in two energy states—parahydrogen and orthohydrogen. At room temperature the spin states are 25% parahydrogen and 75% orthohydrogen; however, the spin states are almost complete parahydrogen (>99%) at very low temperatures (<20 K). Applying a catalyst, such as alkenes, breaks the symmetry of hydrogen, inducing a change in the spin order, known as PHIP [80]. Transfer of the polarization is thereafter performed by field cycling or polarization methods. PHIP has the advantage of being cheap and easy to use and allows for very rapid polarization. Several proposals to alter the PHIP process have been suggested, such as signal amplification by reversible exchange (SABRE [77]), synthesis amid the magnet bore allows dramatically enhanced nuclear alignment (SAMBADENA [78]), and PHIP by means of side arm hydrogenation (PHIP-SAH [81]). Until recently, the requirements of unsaturated precursor molecules, toxic solutions, and catalyzers have been a significant limitation for in vivo applications. However, PHIP-SAH may have found a way to overcome these limitations by using propargyl alcohol in the parahydrogen-induced polarization process.
DNP is based on the spin interaction of free electrons with nearby nuclear spins at low temperatures (<4 K). At this temperature the electrons have a low energy state and can achieve total polarization (100%). Applying irradiation with microwaves causes polarization exchange from the electrons to nearby nuclear spins. Electrons have a short T1 relaxation time causing them to return to their thermal equilibrium state and making them able to repeat the process on unpolarized nuclei. The process is repeated until a desired polarization is achieved according to the nuclei T1 relaxation time (polarization decreases in accordance with T1 relaxation time) [82].
Hyperpolarized carbon-13 using dissolution dynamic nuclear polarization was disseminated in 2003 by J. H. Ardenkjær-Larsen et al., demonstrating the so-called (“alpha” polarizer [82]). The technique was then commercialized in the form of HyperSense (Oxford Instruments, Abingdon, UK) and as the clinical 5 T SPINLab (GE Research Circle Technology Inc., GE Healthcare, Chicago, IL, USA) [83] in 2011. Furthermore, a new commercial 6.7 T pre-clinical polarizer has been introduced—the Spin-Aligner (Polarize IVS, Frederiksberg, DK) in 2018 [84]. The effectiveness of the polarizers has increased rapidly (from 20% to 40% to 70%), and clinical systems are able to achieve polarization up to 55% [85], which is twice the polarization used in the first clinical trial [11]. However, new technological and methodological advances are still needed to improve the polarization method, especially with respect to cost effectiveness and user friendliness [1][86][87].
2.7.2. Sequences
MR spectroscopic imaging is often preferred over single voxel spectroscopy to evaluate local changes in metabolism inside the organ of interest. The dimensionality of hyperpolarized MRSI data is higher, and one must consider possible contamination of signal from nearby voxels (signal bleed) [88], B0 field inhomogeneities across the organ, and increased data acquisition time. As the hyperpolarized signal is non-recoverable, rapid sequences are paramount to ensure collection of metabolic information. The hyperpolarized [1-13C]pyruvate MRSI experiment is composed of data in up to five dimensions (up to three spatial, one temporal, and one spectral) often leading to compromise in one or more dimensions to ensure rapid acquisition [89].
In proton MRI, a successful means of reducing acquisition time is to modify or sample fewer k-space points. These methods are, however, not directly applicable in MRSI. This is partly due to the inherent low number of sampling points, which do not introduce the required level of sparsity. Therefore, the focus of fast MRSI is on more efficient k-space sampling either as echo-planar imaging (EPI) [90] or spiral [91], radial [92], or concentric rings [93].
Fast imaging techniques can generally be grouped into three main approaches: (1) spectroscopic imaging; (2) prior knowledge model-based approaches; and (3) metabolite-specific imaging [94][95][96]. Acquisition time can be decreased with the combination of multiple receiver channel elements as in parallel imaging (SENSE [97], calibrationless [38]), compressed sensing [98][99][100][101], and multiband excitation [101][102] methods. Nevertheless, parallel imaging methods are challenging as acquisition of the needed sensitivity profiles is limited.
(2) Prior knowledge model-based approaches are a faster imaging method often combined with spectroscopic imaging. The speed comes from efficient acquisition of k-space points and avoiding sampling of unnecessary signal, thereby utilizing prior knowledge of the substrates to improve temporal resolution or to reduce the required sampling matrix (SLIM [103], SLOOP [104], and SLAM [105][106]). There are several variations of the prior knowledge model-based techniques; however, recent developments with spectroscopic imaging by exploiting spatiospectral correlation (SPICE) and chemical shift encoding (CSE) could be preferred options for hyperpolarized carbon-13 MRSI.
SPICE utilizes a combination of a two acquisitions: first a set of low-spatial and high-temporal resolution data, followed by a set of high-spatial and low-temporal resolution data [107]. From the two acquisitions, high resolution spectroscopic images with an adequate spectral resolution are reconstructed [108]. The method has recently been evaluated in kidney models of mice [109]; nonetheless, results of the application of this novel technique will be interesting to follow in other organs.
CSE methods include Dixon or iterative decomposition with echo asymmetry and least squares estimation (IDEAL), which apply prior knowledge of the substrates and products [110]. CSE encodes the spectral dimension sparsely by acquiring only with a few different echo times (TEs) [111].
(3) Metabolite-specific imaging is the fastest imaging method of the three approaches, making it less sensitive to motion (shorter repetition time (TR)). However, the disadvantages are the requirement of a sparse spectrum and increased sensitivity to B0 field distortions [94]. The method rapidly acquires spectral and spatial data with frequency and slices selective RF pulses in an EPI [112] or spiral readout trajectory [48]. By exciting a single metabolite at a time and changing RF pulse resonance frequencies, dynamic datasets of desired metabolites are acquired.
2.7.3. Data Acquisition, Reconstruction, Processing, and Analysis
13
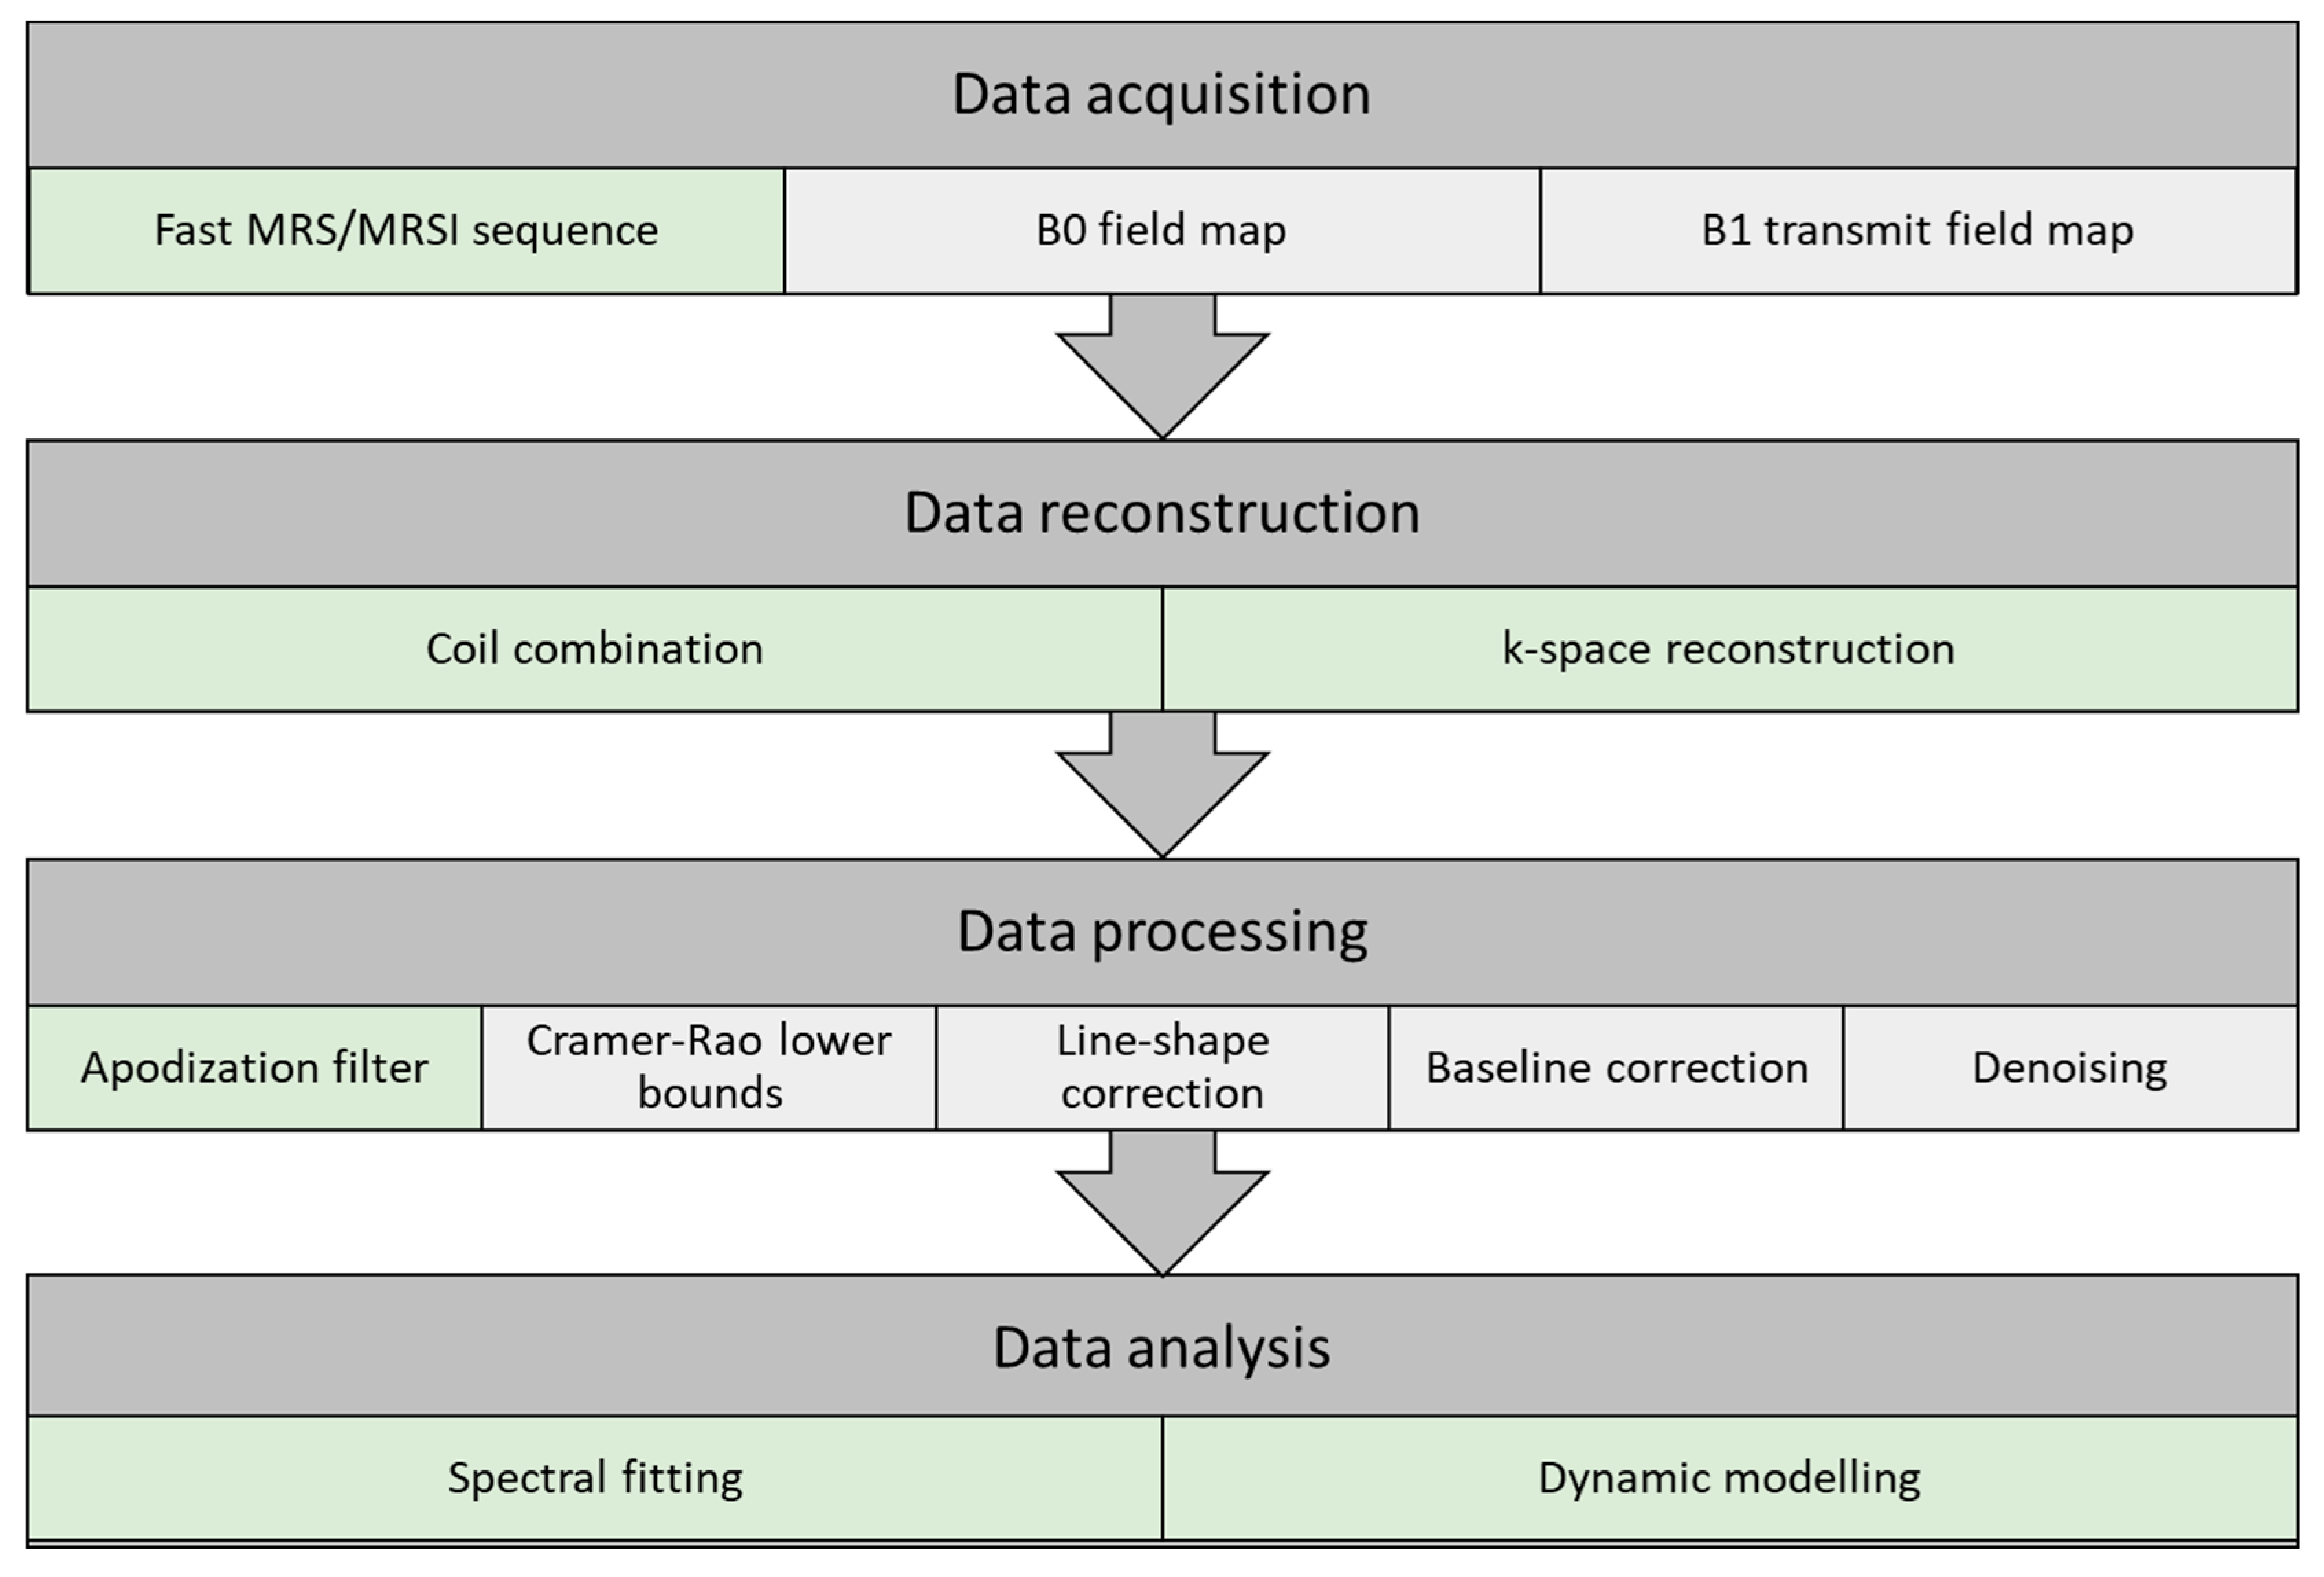
Figure 2.
Data Acquisition
13
13
13
Data Reconstruction
Coil combination: Combination of multiple receiver coils may introduce phase cancelation. This can be avoided by combining the signal acquired from the coils at each voxel either by weighted sum of squares, first point phasing, or singular value decomposition methods [37].
Phase and frequency correction can be manually performed in the data processing step to accommodate for signal loss due to phase cancellation with the use of zero- and first-order phase correction. Nevertheless, several spectral fitting approaches have included phase correction as part of the data processing pipeline (OXSA-AMARES [113], JMRUI [114], and LC model [115]), alleviating this as a data processing requirement.
13C MRI sequences and reconstruction methods has recently been published by Gordon et al. [94].
Data Processing
Cramér–Rao lower bounds: Quality assurance of the spectra can be performed by evaluation of the metabolite separation, signal-to-noise ratio, and temporal resolution. One approach is to quantitatively evaluate the SNR, spectra line width, and spectra separation with the Cramér–Rao lower bounds (CRLBs) [116][117]. CRLBs can be used as a measure to determine voxels to be included or excluded before or even after metabolite spectral fitting.
Spectral baseline correction: Acquired spectra may have shifts in the baseline and thereby overestimate the metabolite resonance peaks. The spectral baseline can be corrected by applying a low-order signal fit [118]. This leads to more robust data and improved data quantification.
13C MRI given the low SNR, good peak separation, and representation of metabolite peaks. Several applications of signal denoising have been evaluated for improvement of data quality, and recent applications of multidimensional tensor value decomposition show promising results by changing from a fixed rank [119] to an automatic cost function-based rank selection approach [37]. Nevertheless, denoising with the use of singular value decomposition (SVD)-based methods should be carried out with caution. The application could introduce oversimplification and thereby filter out lower SNR metabolites or disease metabolism as noise. Furthermore, if too few singular components (low rank) are used, kinetics of pyruvate could modulate the reconstructed dynamics/kinetics of the lower SNR metabolites.
Data Analysis
Figure 3B). Residual pyruvate may be detected in the spectrum as pyruvate hydrate. Analyses of the metabolic flux or exchange rates can be determined by fitting single-compartment or multicompartmental models. The forward rate constant of substrate conversion is calculated as an apparent conversion from pyruvate to, for example, lactate (kpl) [120][121] (
Figure 3C). The results may, however, be prone to systemic errors if not combined with the pyruvate input function [122].
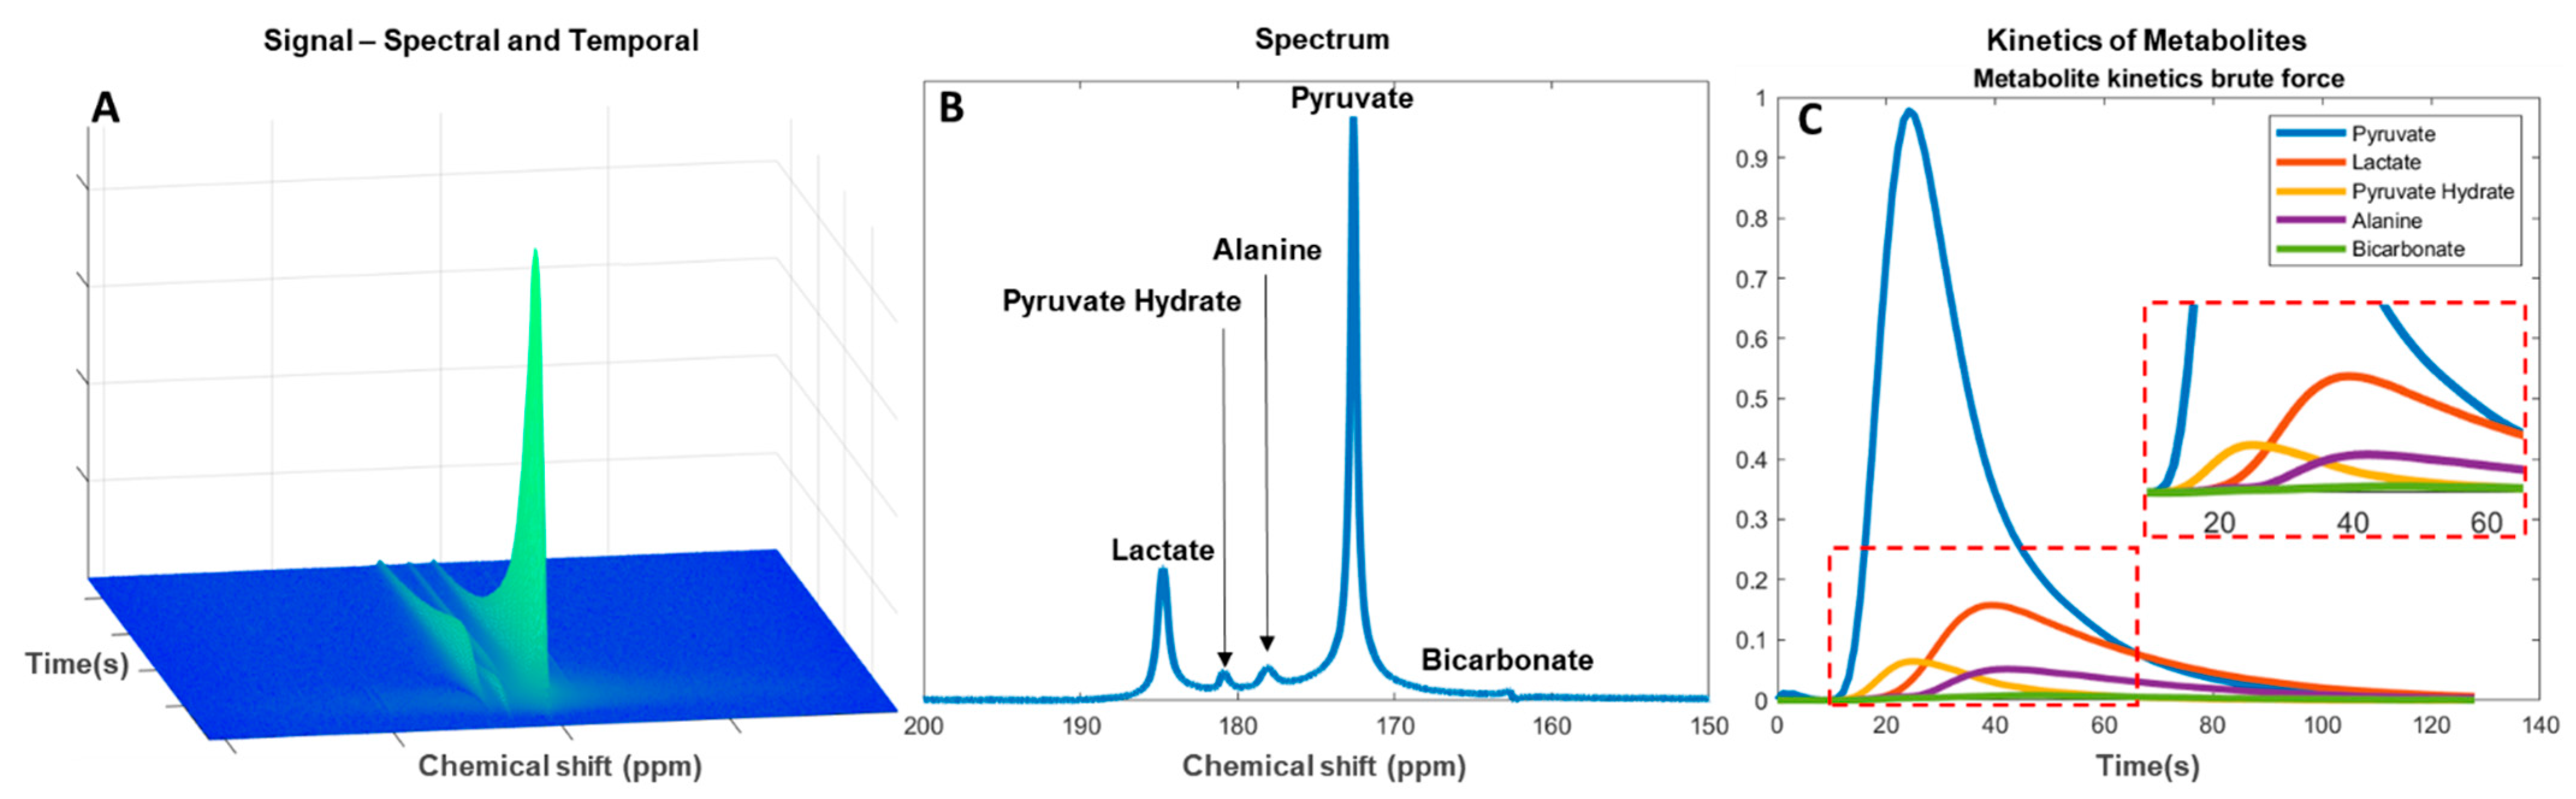
Figure 3.
A
B
C
Alternatively, a model-free formulism based on the ratio of area under the curve (AUC) of the injected and downstream metabolite can be used. This has shown to be a robust and clinically relevant alternative to kinetic model-based rate measurements [123], especially in the lactate-to-pyruvate AUC ratio, which represents the full reaction as determined by compartment kinetic modelling [124]. In addition to being a simplified approach the benefit of evaluating the downstream signal of an AUC is to reduce bias in the later acquired time series [125]. In both approaches, kpl consistency should be evaluated. This could be done by only accepting kpl where the standard deviation is smaller than determined mean kpl. Furthermore, this approach may be beneficial in low SNR measurements for determination of pH from the
13
2
13
2.8. Other
This review focuses on the clinical transition; therefore, areas other than those listed in the previous sections (e.g., lung [128][129], angiography [130], placenta [131][132], muscle [133][134][135]), diseases (e.g., diabetes [58][136][137][138], rheumatoid arthritis [139][140], toxin-induced neuroinflammation [141], radiation injury [142][143]), and physiology (e.g., cell metabolism [144][145], pH [126], blood serum [146][147], bacteria metabolism [148]) are not be covered.
2.9. Clinical Transition
Hyperpolarized MRI is on the verge of clinical translation [27]; however; to ensure clinical adaptation, it is important to improve and validate the workflow. As of today, 50 polarizers prepared for injection into humans are installed worldwide [3], and more than 10 sites are performing clinical trials. More than 200 human subjects have participated in clinical trials with HP
13C MRI [27].
Table 1.
| Area of Interest | Publications | Human Trials | Translation State |
|---|
| Title | Condition | ||
|---|---|---|---|
| Oncology | 170 | prostate: [11][12][14][15][16][7,20,22,23,24] pancreas: [19][27], breast: [20][21][28,29], brain: [23][12][25][149][9,20,32,153], kidney: [26][33] |
High |
| Brain | 37 | [2][4][40][8,13,46] | Low |
| Heart | 87 | [48][49][5,54] | Medium |
| Kidney | 31 | - | Low |
| Liver | 21 | - | Low |
| Technical advances 1 | 349 | - | - |
| Other 2 | 118 | - | - |
1 Sequence, polarization, coils, etc. 2 Other anatomical studies (e.g., lung, angiography, placenta, muscle), diseases (e.g., diabetes, rheumatoid arthritis, toxin-induced neuroinflammation, radiation injury), and physiology (e.g., cell metabolism, pH, blood serum, bacteria metabolism).
13
13C MRI has been performed in clinical studies [48][49], while no kidney or liver studies have so far been published (excluding renal cancer). Three brain studies have been reported in the recent years on healthy brain [2][4][40]; however, none are reporting metabolic changes due to pathology. Therefore, we consider the current translational state of the four areas to be low to medium.
13C MRI in cancer models has proven great potential, not only from the clinical trials but also from the possibilities of targeting cancer cell models in advanced experimental studies [27]. This provides a measure of going from specific cell culture analysis in small animal models to clinical trials with accurate and reproducible results. Transition from research to clinical implementation is plausible in prostate cancer given the large number of studies performed since the first clinical trial in 2013. Nevertheless, it has recently been proposed that there could be an even greater advantage of the application in breast cancer, potentially reducing the number treatments and treatment time (today approximately 12 treatments in 3 months) [150]. The level of detail and experience of HP
13
Table A1.
| Title | Condition | Trial Number |
|---|
| EudraCT Number | |||
|---|---|---|---|
| 1 | Pilot Study of Safety and Toxicity of Acquiring Hyperpolarized Carbon-13 Imaging in Children With Brain Tumors | Pediatric brain tumors | NCT02947373 |
| 2 | Hyperpolarized Carbon-13 Imaging of Metastatic Prostate Cancer |
| 1 | |||||||
| Prostate cancer | NCT02844647 | ||||||
| Early detection of effects of chemotherapy in pancreatic cancer patients—a study using MR-hyperpolarization scanning based on hyperpolarized Pyruvate (13C) injection | Pancreatic cancer | 2016-004491-22 | 3 | Imaging of Traumatic Brain Injury Metabolism Using Hyperpolarized Carbon-13 Pyruvate | |||
| 2 | Traumatic brain injury | NCT03502967 | |||||
| MRI of neurometabolic impairment in ALS and TIA using hyperpolarized pyruvate | Amyotrophic lateral sclerosis | 2020-000352-36 | 4 | Metabolic Characteristics of Brain Tumors Using Hyperpolarized Carbon-13 Magnetic Resonance Spectroscopic Imaging (MRSI) | |||
| 3 | Brain tumor adult | ||||||
| 4 | MRI with hyperpolarised pyruvate in glioblastoma—a phase II study | NCT03067467 | |||||
| Glioblastoma multiforme | 2020-000310-15 | 5 | Hyperpolarized Carbon 13-Based Metabolic Imaging to Detect Radiation-Induced Cardiotoxicity | Thoracic cancer/left sided breast cancer | NCT04044872 | ||
| 5 | Metabolic imaging of patients with mycosis fungoides using hyperpolarized 13C-Pyruvate magnetic resonance imaging—A feasibility study | Mycosis fungoides | 2018-001656-35 | 6 | Hyperpolarized Carbon-13 (13C) Pyruvate Imaging in Patients With Glioblastoma | Glioblastoma multiforme (GBM) | NCT04019002 |
| 7 | Hyperpolarized 13C Pyruvate MRI for Treatment Response Assessment in Patients With Locally Advanced or Metastatic Pancreatic Cancer | Pancreatic ductal adenocarcinoma | NCT04565327 | ||||
| 8 | Feasibility of Acquiring Hyperpolarized Imaging in Patients With Primary CNS Lymphoma | Primary CNS lymphoma | NCT04656431 | ||||
| 9 | Effect of Cardiotoxic Anticancer Chemotherapy on the Metabolism of [1-13C]Pyruvate in Cardiac Mitochondria | Breast neoplasms | NCT03685175 | ||||
| 10 | Hyperpolarized Carbon C 13 Pyruvate Magnetic Resonance Spectroscopic Imaging in Predicting Treatment Response in Patients With Prostate Cancer | Prostate cancer | NCT03581500 | ||||
| 11 | Hyperpolarized 13C Pyruvate MRI Scan in Predicting Tumor Aggressiveness in Patients With Localized Renal Tumor | Benign kidney cancer | NCT04258462 | ||||
| 12 | Hyperpolarized Pyruvate (13C) MR Imaging in Monitoring Patients With Prostate Cancer on Active Surveillance | Prostate adenocarcinoma | NCT03933670 | ||||
| 13 | Hyperpolarized Carbon C 13 Pyruvate in Diagnosing Glioma in Patients With Brain Tumors | Primary brain neoplasm | NCT03830151 | ||||
| 14 | Serial MR Imaging and MR Spectroscopic Imaging for the Characterization of Lower Grade Glioma | Glioma | NCT04540107 | ||||
| 6 | A Dose-Ranging Pharmacodynamic Study to Evaluate the Effects of IMB-1018972 on Myocardial Energetics, Metabolism, and Function in Patients with Type 2 Diabetes | Diabetic cardiomyopathy | 2020-003280-26 | 15 | Hyperpolarized 13C MR Imaging of Lactate in Patients With Locally Advanced Cervical Cancer (LACC) Cervical Cancer | Uterine cervical neoplasms | NCT03129776 |
| 16 | Role of Hyperpolarized 13C-Pyruvate MR Spectroscopy in Patients With Intracranial Metastasis Treated With (SRS) | Brain metastases | NCT03324360 | ||||
| 17 | Hyperpolarized Imaging in Diagnosing Participants With Glioma | Glioma | NCT03739411 | ||||
| 18 | Metabolic Imaging of the Heart Using Hyperpolarized (13C) Pyruvate Injection | Hypertension/hypertrophy | NCT02648009 | ||||
| 19 | Magnetic Resonance Imaging (MRI) With Hyperpolarized Pyruvate (13C) as Diagnostic Tool in Advanced Prostate Cancer | Prostate cancer | NCT04346225 | ||||
| 20 | Imaging Oxidative Metabolism and Neurotransmitter Synthesis in the Human Brain | Brain cancer | NCT03849963 | ||||
| 21 | Study to Evaluate the Feasibility of 13-C Pyruvate Imaging in Breast Cancer Patients Receiving Neoadjuvant Chemotherapy | Breast cancer | NCT03121989 | ||||
| 22 | Development and Evaluation of a Quantitative HP MRI for Clinical Prostate Cancer Exam | Prostate adenocarcinoma | NCT04286386 | ||||
| 23 | A Pilot Study of (MR) Imaging With Pyruvate (13C) to Detect High Grade Prostate Cancer | Prostate cancer | NCT02526368 | ||||
| 24 | An Investigational Scan (hpMRI) for Monitoring Treatment Response in Patients With Thyroid Cancer Undergoing Radiation Therapy and/or Systemic Therapy | Thyroid gland carcinoma | NCT04589624 | Fatty liver | NCT03480594 | ||
| Clinical and pathophysiological aspects of visualization of metabolic flux in the failing human heart using hyperpolarized [1-13C]-pyruvate cardiac magnetic resonance | Chronic heart failure | 2018-003533-15 | |||||
| 25 | Effect of Fatty Liver on TCA Cycle Flux and the Pentose Phosphate Pathway | 26 | Hyperpolarized C-13 Pyruvate as a Biomarker in Patients With Advanced Solid Tumor Malignancies | Prostate cancer | NCT02913131 | ||
| 27 | Characterization of Hyperpolarized Pyruvate MRI Reproducibility | Malignant solid tumors | NCT02421380 |
Table A2.