By using M4,5 X-ray Emission Spectroscopy (XES) in the tender X-ray regime, it is possible to quantify 5f delocalization in the actinides. Previous analyses, utilizing the Branching Ratio (BR) in the N4,5 X-ray Absorption Spectroscopy (XAS), could not discriminate between the cases of localized n = 2 and delocalized n = 3, in uranium materials, where n is the number of 5f electrons on the U entity. Here, it is shown that, by employing the ubiquitous 6p→3d XES as a point of normalization, the localized n = 2 and delocalized n = 3 cases can be easily distinguished and quantified.
- x-ray emission spectroscopy
- actinides
- uranium
Introduction
X-ray spectroscopy has become a powerful tool for the analysis of the electronic structure of actinides, based upon the original ground breaking work of (1) Veal and coworkers using X-ray Photoelectron Spectroscopy (XPS); (2) Naegele and others employing the lower energy Photoelectron Spectroscopy (PES) and references therein; (3) Baer et al. utilizing Bremstrahlung Isochromat Spectroscopy (BIS); (4) Chauvet and Baptist, with the lower energy Inverse Photoelectron Spectroscopy (IPES); and Kalkowski, Kaindl, Brewer and Krone, who did a pioneering X-ray Absorption Spectroscopy (XAS) study.
A particularly effective approach has been to measure the Branching Ratios (BR) in the N
4,5X-ray Absorption Spectroscopy, where BR = I
4d5/2/(I
4d5/2+ I
4d3/2), I
x being the intensity of the respective level x. (Figure 1) The combination of strong electric dipole selection rules in the d to f transitions and a firm theoretical foundation for localized systems provided by van der Laan and Thole has permitted the determination of the quantity of 5f electrons (n) in a number of localized actinide systems. While this may seem trivial, it was in fact a topic of serious disagreement for a number of years. For example, early on there was a viewpoint that championed 6d filling instead of 5f filling and the reconciliation between the accepted n = 6 in atomic Pu and n = 5 in solid Pu was only realized completely in the recent past. Nevertheless, there remained a very troublesome “fly in the ointment”: the indistinguishability of the BR for the localized n = 2 U systems and the delocalized n = 3 of uranium metal, as shown in Figure 2. This issue was first reported by Kalkowki, Kaindl, Brewer and Krone in 1987 and addressed more recently elsewhere.being the intensity of the respective level x. (Figure 1) The combination of strong electric dipole selection rules in the d to f transitions and a firm theoretical foundation for localized systems provided by van der Laan and Thole has permitted the determination of the quantity of 5f electrons (n) in a number of localized actinide systems. While this may seem trivial, it was in fact a topic of serious disagreement for a number of years. For example, early on there was a viewpoint that championed 6d filling instead of 5f filling and the reconciliation between the accepted n = 6 in atomic Pu and n = 5 in solid Pu was only realized completely in the recent past. Nevertheless, there remained a very troublesome “fly in the ointment”: the indistinguishability of the BR for the localized n = 2 U systems and the delocalized n = 3 of uranium metal, as shown in Figure 2. This issue was first reported by Kalkowki, Kaindl, Brewer and Krone in 1987 and addressed more recently elsewhere.
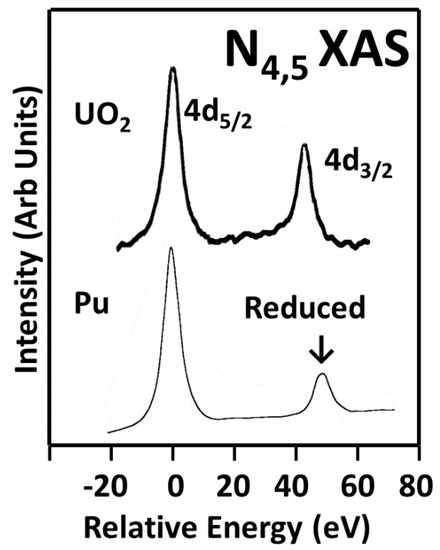
The N4,5 X-ray Absorption Spectroscopy (XAS) of uranium dioxide and δ-Pu(Ga) are shown here. Note the significant reduction in the intensity of the Pu 4d
3/2peak relative to that of the U in uranium dioxide. (The spectra are normalized with the 4d
5/2level.) This has been shown to be due to the population of the 5f levels: n = 2 for UO
2and n = 5 for Pu. The UO
2 spectrum is courtesy of DK Shuh, Lawrence Berkeley National Laboratory (LBNL).spectrum is courtesy of DK Shuh, Lawrence Berkeley National Laboratory (LBNL).
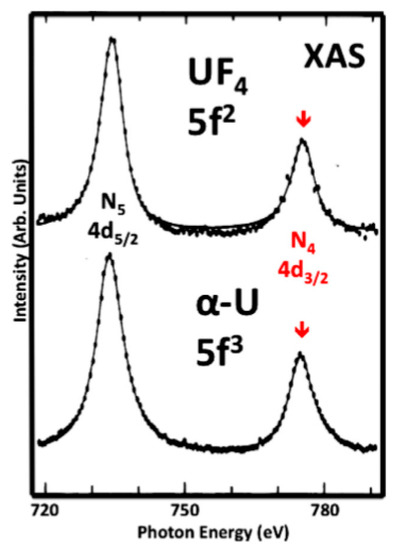
The N
4,5XAS spectra of UF
4and α-U are shown here, analogous to Figure 1. UF
4is a localized n = 2 system, very similar to UO
2. The data are originally from Kalkowski, Kaindl, Brewer and Krone. The figure is reproduced from their paper. Note that the two spectra cannot be distinguished; they have the same BR.. The data are originally from Kalkowski, Kaindl, Brewer and Krone. The figure is reproduced from their paper. Note that the two spectra cannot be distinguished; they have the same BR.
From other measurements and analyses, it has long been accepted that α-U has three 5f electrons and that there is significant delocalization in the 5f states. An example of this is shown below in Figure 3. In Figure 3, the BIS of Baer et al. is compared to the calculations of Kutepov. The agreement between the BIS and the Unoccupied density of states (UDOS) derived from Kutepov’s calculations is very good. Moreover, the underlying j-specific calculations demonstrate the admixture of the 5f
5/2and 5f
7/2 states, consistent with strong delocalization.states, consistent with strong delocalization.
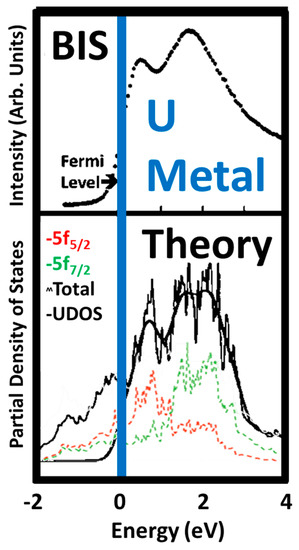
Comparison of the Bremstrahlung Isochromat Spectroscopy (BIS) results of Baer and Lang with the Unoccupied density of states (UDOS) derived from the theory by Kutepov. In the lower panel, the unsmoothed 5f
5/2calculation is shown in red, the unsmoothed 5f
7/2 calculation is shown in green, the partially smoothed total is the jagged black line and the UDOS is shown by the very smooth, heavier black line. The UDOS was derived by applying an inverse Fermi function and more extensive smoothing to the total.calculation is shown in green, the partially smoothed total is the jagged black line and the UDOS is shown by the very smooth, heavier black line. The UDOS was derived by applying an inverse Fermi function and more extensive smoothing to the total.
The essence of the problem is that the BR approach works very well for localized systems but cannot rule out the possibility of delocalization with a slightly different number of 5f electrons. However, there now appears to be a solution to this “blind spot.” Recently, it has been shown that the M
4,5X-ray Emission Spectroscopy of UF
4exhibits results consistent with the Intermediate Coupling Model of van der Laan and Thole. Normalizing to the 6p → 3d peaks, it can be seen that there is a tremendous differential in the intensities of the 5f peaks in the two spectra, a factor of 5. Figure 4 (The X-ray Emission Spectroscopy (XES) results for UO
2are very similar to those of UF
4and are omitted here.) It has been shown that this is consistent with the almost pure n
5/2nature of the two 5f electrons in UF
4 and strong, albeit not complete, adherence to electric dipole select rules. It will be demonstrated here that this type of data will provide (1) a direct pathway to the experimentally driven discernment of the localized n = 2 and delocalized n = 3 cases in particular and (2) the degree of delocalization in 5f systems in general.and strong, albeit not complete, adherence to electric dipole select rules. It will be demonstrated here that this type of data will provide (1) a direct pathway to the experimentally driven discernment of the localized n = 2 and delocalized n = 3 cases in particular and (2) the degree of delocalization in 5f systems in general.
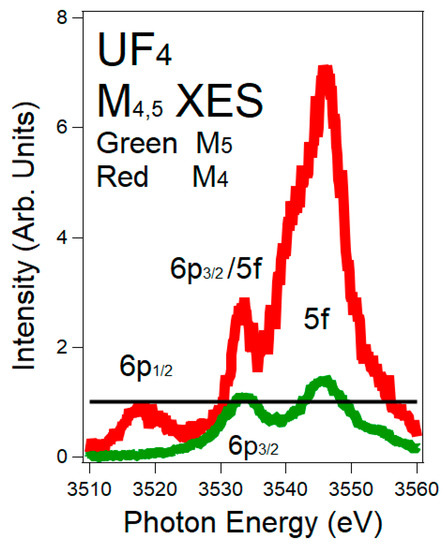
M
4and M
5X-ray Emission Spectroscopy (XES) spectra of UF
4are shown here. The M
4(M
5) spectrum corresponds to the 3d
3/2(3d
5/2) hole. The normalization of the spectra is via the 6p peaks: M
46p
1/2(p
1/2→ d
3/2) and M
56p
3/2(p
3/2→ d
5/2), both Δj = 1. Red = M
4. Green = M
5. The black horizontal line is at unity (1). The intensity ratio of the 6p
1/2:6p
3/2is 0.8, following the electric dipole cross sections. In order to align the peaks on the M
5energy scale, the M
4spectrum has been shifted to −181 eV. There is a very large enhancement of the 5f peak in the M
4spectrum, versus that in the M
5 spectrum.spectrum.
Summary and Conclusions
By using M
4,5X-ray Emission Spectroscopy (XES) in the tender X-ray regime, it has been shown that it is possible to quantify 5f delocalization in the actinides. Previous analyses, utilizing the Branching Ratio (BR) in the N
4,5X-ray Absorption Spectroscopy (XAS), could not discriminate between the cases of localized n = 2 and delocalized n = 3, in uranium materials, where n is the number of 5f electrons on the U entity. Here it is shown that, by employing the ubiquitous 6p XES as a point of normalization, the localized n = 2 and delocalized n = 3 cases can be easily distinguished and quantified via the M
5 X-ray emission spectrum.X-ray emission spectrum.
As can be seen from the Introduction, XAS, XES, BIS and XPS each provide different types of information. Of course, all spectroscopies provide a measure of the joint density of states of the initial and final manifolds, connected by the appropriate operator. BIS and XPS can give a picture of the unoccupied and occupied DOS of a material, respectively, generally without elemental specificity but possibly with linear (translational) momentum resolution. On the other hand, XAS and XES provide information about the unoccupied and occupied DOS, respectively, but with elemental and generally angular momentum resolution. In the case of the 5f states, the XES and XAS of the d-f transitions can provide a measure of the 5f state occupations, including a breakdown into the 5f
5/2and 5f
7/2distributions. The discussions today have been made within the framework of the n = 3 delocalization problem for metallic U. However, there are also other perturbations that can mix the 5f
5/2and 5f
7/2 states, e.g., magnetic effects and crystal field effects. XES and XAS together should produce a measure of the magnitude of the number and distribution of the 5f electrons, but to assign the distribution as being due to delocalization will require a demonstration that other mixing effects are not significantly in effect. Obvously, all of this is played out under the conditions of the competition between angular momentum and delocalization effects, i.e., 5f duality.states, e.g., magnetic effects and crystal field effects. XES and XAS together should produce a measure of the magnitude of the number and distribution of the 5f electrons, but to assign the distribution as being due to delocalization will require a demonstration that other mixing effects are not significantly in effect. Obviously, all of this is played out under the conditions of the competition between angular momentum and delocalization effects, i.e., 5f duality.
References
- J. G. Tobin, S. Nowak, S.-W. Yu, R. Alonso-Mori, T. Kroll, D. Nordlund, T.-C. Weng and D. Sokaras; Towards the Quantification of 5f Delocalization. Appl. Sci. 2020, 10, 2918, doi:10.3390/app10082918.