Introduces the Uncertainty-Certainty Matrix Logic Model and Algorithms for making human services licensing decisions and avoiding inspection bias and reliability/validity errors.
- regulatory compliance
- licensing measurement
- differential monitoring
- logic models
- human services licensing
- decision making models
1. Introduction
The Uncertainty-Certainty Matrix Logic Model and Algorithms
Richard Fiene PhD
Penn State Edna Bennett Pierce Prevention Research Center
May 2024
This research abstract will take the Confusion Matrix which is a well-known metric in the decision-making research literature and refocus it on regulatory science within the context of the definition of regulatory compliance and licensing measurement. It will also deal with the policy implications of this particular metric. In this abstract, it is proposed that the Uncertainty-Certainty Matrix (UCM) is a fundamental building block to licensing decision making. The 2 x 2 matrix is the center piece for determining key indicator rules, but it is also a core conceptual framework in licensing measurement and ultimately in program monitoring and reviews.
The reason for selecting this matrix is the nature of licensing data, it is binary or nominal in measurement. Either a rule/regulation is in compliance or out of compliance. Presently most jurisdictions deal with regulatory compliance measurement in this nominal level or binary level. There is to be no gray area, this is a clear distinction in making a licensing decision about regulatory compliance. The UCM also takes the concept of Inter-Rater Reliability (IRR) a step further in introducing an uncertainty dimension that is very important in licensing decision making which is not as critical when calculating IRR. It is moving from an individual metric to a group metric (See Figures 1 & 2) involving regulatory compliance with rules.
The key pieces to the UCM are the following: the decision (D) regarding regulatory compliance and actual state (S) of regulatory compliance. Plus (+) = In-compliance or Minus (-) = Out of compliance. So, let’s build the matrix:
Table 1. Uncertainty-Certainty Matrix (UCM) Logic Model.
Table 1: Uncertainty-Certainty Matrix (UCM) Logic Model
|
UCM Matrix Logic |
Decision (D) Regarding |
Regulatory Compliance |
|
|---|---|---|---|
|
(+) In Compliance |
(-) Not In Compliance |
||
|
Actual State (S) of |
(+) In Compliance |
Agreement |
Disagreement |
|
Compliance |
(-) Not In Compliance |
Disagreement |
Agreement |
The above UCM matrix demonstrates when agreement and disagreement occur which establishes a level of certainty (Agreement Cells) or uncertainty (Disagreement Cells). In a perfect world, there would only be agreements and no disagreements between the decisions made about regulatory compliance and the actual state of regulatory compliance. But from experience, this is not the case based upon reliability testing done in the licensing research field in which a decision is made regarding regulatory compliance with a specific rule or regulation and then that is verified by a second observer who generally is considered the measurement standard.
Disagreements raise concerns in general, but the disagreements are of two types: false positives and false negatives. A false positive is when a decision is made that a rule/regulation is out of compliance when it is in compliance. Not a good thing but its twin disagreement is worse where with false negatives it is decided that a rule/regulation is in compliance when it is out of compliance. False negatives need to be avoided because they
place clients at extreme risk, more so than a false positive. False positives should also be avoided but it is more important to deal with the false negatives first before addressing the false positives.
Let’s look at this from a mathematical point of view in the following matrix. In order to better understand the above relationships and determine when ameliorative action needs to occur to shore up the differences between the agreements and disagreements, it is easier to do this mathematically than trying to eyeball it.
Table 2. Uncertainty-Certainty Matrix (UCM) Math Model.
Table 2: Uncertainty-Certainty Matrix (UCM) Math Model
|
UCM Matrix Math Model |
Decision (D) Regarding |
Regulatory Compliance |
Totals |
|
|---|---|---|---|---|
|
(+) In Compliance |
(-) Not In Compliance |
|||
|
Actual State (S) |
(+) In Compliance |
A |
B |
Y |
|
Of Compliance |
(-) Not In Compliance |
C |
D |
Z |
|
Totals |
W |
X |
Formulae based upon above: Agreements = (A)(D); Disagreements = (B)(C); Randomness = sqrt ((W)(X)(Y)(Z))
UCM Coefficient = ((A)(D)) - ((B)(C)) / sqrt ((W)(X)(Y)(Z)) in which a coefficient closer to 1 indicates agreement (certainty) and a coefficient closer to –1 indicates disagreement (uncertainty). A coefficient closer to 0 indicates randomness. Obviously, we want to see (A)(D) being predominant and very little in (B)(C) which are false positives and negatives where decisions and the actual state of regulatory compliance are not matching. If (WXYZ) is predominant then there is just randomness in the data. Also, not an intended result.
The reason for even suggesting this matrix is the high level of dissatisfaction with the levels of reliability in the results of program monitoring reviews as suggested earlier. If it were not so high, it would not be an issue; but with it being so high the field of licensing needs to take a proactive role in determining the best possible way to deal with increasing inter-rater reliability among licensing inspectors. Hopefully, this organizational schema via the UCM Matrix will help to think through this process related to licensing measurement and monitoring systems.
UCM = ≪ A × D ≫ - ≪ B × C ≫ ÷ √≪ W × X × Y × Z ≫
The above formula provides a means to calculate when action needs to be taken based upon the respective UCM coefficients. A UCM coefficient from +.25 to +1.00 is in the acceptable range; +.24 to -.24 is due to randomness and needs to be addressed with additional inter-rater reliability training; -.25 to –1.00 indicates a severe disagreement problem that needs to be addressed both in reliability training and a full review of the targeted rules/regulations to determine if the specific rule needs additional clarification.
Table 3. Uncertainty-Certainty Matrix (UCM) Licensing Decision Coefficient Ranges.
Table 3: Uncertainty-Certainty Matrix (UCM) Licensing Decision Coefficient Ranges
|
UCM Coefficient |
Licensing Decision |
|---|---|
|
+.25 to +1.00 |
Acceptable, No Action Needed, In or Out of Regulatory Compliance Verified through mostly Agreements. (Generally, 90% of cases) |
|
+.24 to -.24 |
Random, Agreements + Disagreements, Needs Reliability Training. (Generally, 5% of cases) |
|
-.25 to –1.00 |
Unacceptable, Mostly Disagreements, Needs Training & Rule/Regulation Revision. (Generally, 5% of cases) |
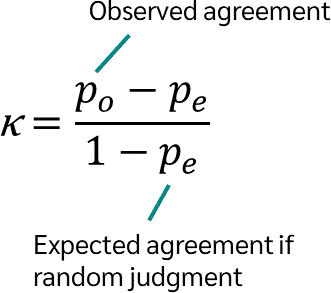
Figure 1.: Kappa Kappa Coefficient.
Coefficient
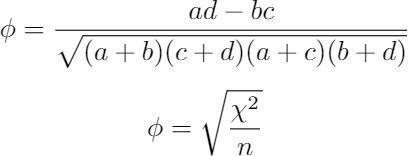
Figure 2.: Uncertainty-Certainty Uncertainty-Certainty Coefficient.
Coefficient
Let’s provide an example of how this could work. A standard/rule/regulation that is common is the following:
Do all caregivers/teachers and children wash their hands often, especially before eating and after using the bathroom or changing diapers?
This is obviously an observation item where the licensing staff would observe in a sample of classrooms in a child care center for a set period of time. During their observations, there were several opportunities where the necessary behavior was required, and the staff complied with the rule and washed their hands. So, on the surface this specific rule was in compliance and there would appear to be full compliance with this rule based upon the observation.
A second scenario is where the observation is made, and the licensing staff observes the child care staff not washing their hands on several occasions. Then this specific rule would be out of compliance, and it would be duly noted by the licensing staff. These two scenarios establish a certain level of certainty during this observation session. However, there are other outcomes, for example, possibly one of the classrooms that was not observed had the opposite finding than what was observed in these particular classrooms. If data were being aggregated and a specific percentage was to be used the final decision about this rule could be different. Now we are getting into the uncertainty cells of the matrix where a false positive or negative could be the result. The licensing staff records the rule as being in compliance when in reality it is not = false negative or the rule is recorded as being out of compliance when in reality it is in compliance = false positive.
Another example which involves either Random Clinical Trials (RCT) or the use of abbreviated inspections (AI) and the results from these two interventions. The decision making in both RCT and AI is basically the same. We want to make sure that the results match reality. Every time an abbreviated review is done the following four regulatory compliance results should occur based upon the UCM matrix: 1) no additional random non-compliance is found; 2) there are no false negatives (abbreviated review finds no non-compliance but in reality there is); 3) when there is non-compliance found in abbreviated inspections, other related non-compliance is found; and 4) lastly the level of false positives (abbreviated review finds non-compliance but in reality there are no other related non-compliances) is kept to a minimum. This last result based upon copious research is that it is difficult to obtain but as the regulatory science moves forward hopefully this will become more manageable.
Hopefully these above examples provided some context for how the Uncertainty-Certainty Matrix (UCM) can be used in making specific licensing decisions based upon the regulatory compliance results.
21. Uncertainty-Certainty Matrix for Validation and Reliability Studies
The purpose of this part of this research abstract is to explore the possibility of utilizing the Uncertainty-Certainty Matrix (UCM) in validation and reliability studies in licensing decision making. The UCM has been proposed for use in licensing decision making but this would be an extension of this thinking to studies that involve validating licensing decisions such as when key indicators are used in comparison with comprehensive reviews of rules, and in reliability studies to determine individual inspector bias in regulatory compliance.
The basic premise of the UCM is that individual decision-making matches reality. When it comes to regulatory compliance decision making a 2 x 2 matrix can be drawn with the possible outcomes as is indicated in the following table (Table 4).
Table Table 4.4
|
UCM Matrix Logic |
Decision Regarding |
Regulatory Compliance |
|
|---|---|---|---|
|
(+) In Compliance |
(-) Not In Compliance |
||
|
Actual State of |
(+) In Compliance |
Agreement (++) |
Disagreement (+-) |
|
Compliance |
(-) Not In Compliance |
Disagreement (-+) |
Agreement (--) |
In using this table, the hope is that the decision regarding regulatory compliance matches the actual state of compliance where the coefficient is as close to +1.0 as possible, in other words, perfect agreement. So, the agreement cells are heavily weighted. We do not want to see all the cells, both agreement and disagreement cells, equally weighted. That would indicate a random response rate and a coefficient close to 0.0.
But there is another possibility which involves bias on the part of the licensing inspector in which they have certain biases or tendencies when it comes to making regulatory compliance decisions about individual rules. So, it is possible that decisions made regarding regulatory compliance could be either overall (+) positive In-Compliance or (-) negative Not-In-Compliance when in reality the actual state of compliance is more random.
When this occurs, the coefficient falls off the range category and is not between 0 and +/-1.0 because there is no variance detected in the data. It is always biased either positively or negatively.
The UCM can be used for both reliability and validity testing as suggested in the above. Just look for different results. For validity, false positives and negatives should either be eliminated or reduced as well as possible and the remaining results should show the typical diagonal pattern as indicated by the agreement cells.
For reliability, the same pattern should be observed as in the validity testing above but there is an additional test in which bias is tested for. Bias will be ascertained if the patterns in the results indicate a horizontal or vertical pattern in the data with little or no diagonal indication. Bias can be found at the individual inspector level as well as at the standard level or the actual state of compliance.
In both reliability and validity testing, random results in which each of the cells are equally filled is not a desirable result either.
The following tables 5-10 depict the above relationships with results highlighted in red: Table Table 5.5
|
Valid & Reliable Results |
(+) In Compliance |
(-) Not In Compliance |
|---|---|---|
|
(+) In Compliance |
Agreement (++) |
Disagreement (+-) |
|
(-) Not In Compliance |
Disagreement (-+) |
Agreement (--) |
Table 6.
Table 6
|
Random Results |
(+) In Compliance |
(-) Not In Compliance |
|---|---|---|
|
(+) In Compliance |
Agreement (++) |
Disagreement (+-) |
|
(-) Not In Compliance |
Disagreement (-+) |
Agreement (--) |
Table 7.
Table 7
|
Positive Bias Results Individual |
(+) In Compliance |
(-) Not In Compliance |
|---|---|---|
|
(+) In Compliance |
Agreement (++) |
Disagreement (+-) |
|
(-) Not In Compliance |
Disagreement (-+) |
Agreement (--) |
Table 8.
Table 8
|
Negative Bias Results Individual |
(+) In Compliance |
(-) Not In Compliance |
|---|---|---|
|
(+) In Compliance |
Agreement (++) |
Disagreement (+-) |
|
(-) Not In Compliance |
Disagreement (-+) |
Agreement (--) |
Table 9.
Table 9
|
Positive Bias Results Standard |
(+) In Compliance |
(-) Not In Compliance |
|---|---|---|
|
(+) In Compliance |
Agreement (++) |
Disagreement (+-) |
|
(-) Not In Compliance |
Disagreement (-+) |
Agreement (--) |
Table 10.
Table 10
|
Negative Bias Results Standard |
(+) In Compliance |
(-) Not In Compliance |
|---|---|---|
|
(+) In Compliance |
Agreement (++) |
Disagreement (+-) |
|
(-) Not In Compliance |
Disagreement (-+) |
Agreement (--) |
Tables 5 – 10 demonstrate the different results based upon individual response rates when making regulatory compliance decisions about rules. Table 5 is what needs to be attained and tables 6 – 10 need to be avoided. Only in table 5 are false negatives and positives eliminated or avoided. In tables 6 – 10, false negatives and/or false positives are introduced which is not desirable when making validity or reliability decisions.
Table 6 results clearly indicate that a great deal of randomness has been introduced in the regulatory compliance decision making in which the individual licensing inspector decisions do not match reality. Tables 7 and 8, demonstrate bias in the decision-making process either positively (inspector always indicates in compliance) or negatively (inspector always indicates out of compliance). It is also possible that the standard being used has bias built into it, this is less likely but is still a possibility. The results in Tables 9 and 10 demonstrate where this could happen.
All these scenarios need to be avoided and should be monitored by agency staff to determine if there are patterns in how facilities are being monitored.
32. Uncertainty-Certainty Matrix for Differential Monitoring Studies
The purpose of this part of the research abstract is to explore the possibility of utilizing the Uncertainty-Certainty Matrix (UCM) not only in validation and reliability studies in licensing decision making but also with differential monitoring studies. The UCM has been proposed for use in licensing decision making but this would be an extension of this thinking to studies that involve validating licensing decisions such as when key indicators are used in comparison with comprehensive reviews of rules, and in the development of risk rules as part of the risk assessment methodology. This new Differential Monitoring 2x2 Matrix can also be used to depict the relationship between full and substantial regulatory compliance and the nature of rulemaking.
The basic premise of the DMM: Differential Monitoring Matrix is similar to the original thinking with the UCM but there are some changes in the formatting of the various cells in the matrix (see Table 11). When it comes to regulatory compliance decision making a 2 x 2 matrix can be drawn with the possible outcomes as is indicated in Table 11 where each individual rule is either in (+) or out (-) of compliance. Also, there is the introduction of a high regulatory compliant group (+) and a low regulatory compliant group (-) which is different from the original UCM.
Table 11.
Table 11
|
DMM Matrix |
High Group (+) |
Low Group (-) |
|---|---|---|
|
(+) Rule is In Compliance |
(++) |
(+-) |
|
(-) Rule is Not In Compliance |
(-+) |
(--) |
By utilizing the format of Table 11, several key components of differential monitoring can be highlighted, such as key indicators and risk assessment rules, as well as the relationship between full and substantial regulatory compliance.
Regulatory compliance is grouped into a high group (+), generally this means that there is either full or substantial regulatory compliance with all rules. The low group (-) usually has 10 or more regulatory compliance violations. Individual rules being in (+) or out (-) of regulatory compliance is self-explanatory.
Tables 12-18 below will demonstrate the following relationships:
Table 12 depicts the key indicator relationship between individual rules and the high/low groups as indicated in red. In this table, the individual rule is in compliance with the high group and is out of compliance with the low group. This result occurs on a very general basis and should have a .50 coefficient or higher with a p value of less than .0001.
Table 13 depicts what most rules look like in the 2x2 DMM. Most rules are always in full compliance since they are standards for basic health and safety for individuals. This is especially the case with rules that have been weighted as high-risk rules. Generally, one never sees non-compliance with these rules. There will be a substantial number of false positives (+-) found with high-risk rules but that is a good thing.
Table 14 depicts what happens when full compliance is used as the only criterion for the high group. Notice that the cell right below (++) is eliminated (-+). This is highly recommended since it eliminates false negatives (-+) from occurring in the high group. As will be seen in Table 5, when substantial compliance is used as part of the high group sorting, false negatives are re-introduced. If possible, this should be avoided, however in some cases because of the regulatory compliance data distribution it is not always possible where not enough full compliant programs are present.
Table 15 depicts what occurs when substantial compliance is used as part of determining the high group. False negatives can be reintroduced into the matrix which needs to be either eliminated or reduced as best as possible. If substantial compliance needs to be used in determining the high group, then there is a mathematical adjustment that can be made which will impact the equation and essentially eliminate false negatives mathematically (see the research note at the end of this research abstract).
Table 16 depicts what happens if the individual rule is particularly difficult to comply with. Both the high performers as well as the low performers are out of compliance with the rule.
Table 17 depicts a situation where the programs are predominantly in a low group with few at full or substantial regulatory compliance which is indicative of poor performing programs. Very honestly, this is generally not seen in the research literature, but it is a possibility and one to be in tune with.
Table 18 depicts a terrible individual rule which predicts just the opposite of what we are trying to do with programs. Obviously, this rule would need to be rewritten so that it fits with the essence of regulatory compliance in helping to protect individuals.
The following tables 12-18 will depict the above relationships with results highlighted in red: Table 12.Table 12
|
Key Indicators |
High Group (+) |
Low Group (-) |
|---|---|---|
|
(+) Rule is In Compliance |
(++) |
(+-) |
|
(-) Rule is Not In Compliance |
(-+) |
(--) |
Table 13.
Table 13
|
Risk Rules |
High Group (+) |
Low Group (-) |
|---|---|---|
|
(+) Rule is In Compliance |
(++) |
(+-) |
|
(-) Rule is Not In Compliance |
(-+) |
(--) |
Table 14.
Table 14
|
Full Compliance |
High Group (+) |
Low Group (-) |
|---|---|---|
|
(+) Rule is In Compliance |
(++) |
(+-) |
|
(-) Rule is Not In Compliance |
(--) |
Table 15.
Table 15
|
Substantial Compliance |
High Group (+) |
Low Group (-) |
|---|---|---|
|
(+) Rule is In Compliance |
(++) |
(+-) |
|
(-) Rule is Not In Compliance |
(-+) |
(--) |
Table 16.
Table 16
|
Very Difficult Rule |
High Group (+) |
Low Group (-) |
|---|---|---|
|
(+) Rule is In Compliance |
(++) |
(+-) |
|
(-) Rule is Not In Compliance |
(-+) |
(--) |
Table 17.
Table 17
|
Poor Performing Programs |
High Group (+) |
Low Group (-) |
|---|---|---|
|
(+) Rule is In Compliance |
(++) |
(+-) |
|
(-) Rule is Not In Compliance |
(-+) |
(--) |
Table 18.
Table 18
|
Terrible Rule |
High Group (+) |
Low Group (-) |
|---|---|---|
|
(+) Rule is In Compliance |
(++) |
(+-) |
|
(-) Rule is Not In Compliance |
(-+) |
(--) |
Tables 12 – 18 demonstrate the different results based on the relationship between individual regulatory compliance and if a program is either a high performer or a low performer. These tables are provided as guidance for understanding the essence of differential monitoring and regulatory compliance which has various nuances when it comes to data distributions. This research abstract hopefully can be used as a guide in determining from a data utilization point of view how to make important regulatory compliance policy decisions, such as: which rules
are excellent key indicator rules, which are performing as high risk rules, importance of full compliance, what to do when substantial compliance needs to be employed, are there difficult rules to comply with, how well are our programs performing, and do we have less than optimal rules that are in need of revision.
Research Note:
Over the past decade in doing research on the Regulatory Compliance Key Indicator Metric (RCKIm) it has become very clear that false negatives needed to be controlled for because of their potential to increase morbidity and mortality. When dealing with regulatory compliance and full compliance as the threshold for the high grouping variable in the 2 x 2 Regulatory Compliance Key Indicator Matrix (RCKIm) (see matrix below in Table 19), false negatives could be either eliminated or reduced to the point of no concern.
However, if substantial compliance rather than full compliance is used as the threshold for the high grouping variable in the 2 x 2 Regulatory Compliance Key Indicator Matrix (RCKIm) this becomes a problem again. There is the need to introduce a weighting factor. In utilizing the RCKIm, the following equation/algorithm is used to produce the Fiene Coefficient (FC):
FC = ((A)(D)) – ((B)(C)) / sqrt (WXYZ)
This RCKIm needs to be revised/updated to the following to consider the need to again eliminate false negatives being generated by the results of the equation/algorithm; this can be accomplished by cubing B:
FC* = ((A)(D)) – ((B^3)(C)) / sqrt (WXYZ)
By this simple adjustment to cube (B = False Negatives) it will basically eliminate the use of any results in which a false negative occurs when substantial compliance is determined. The table below (Table 19) displays the variables of the Regulatory Compliance Key Indicator Matrix (RCKIm).
|
Table 19. RCKIm |
High RC Group |
RC Low Group |
|
|---|---|---|---|
|
KI In Compliance |
A |
B^3 |
Y |
|
KI Violations |
C |
D |
Z |
|
Totals |
W |
X |
|
|
Table 19: RCKIm |
High RC Group |
RC Low Group |
|
|
KI In Compliance |
A |
B^3 |
Y |
|
KI Violations |
C |
D |
Z |
|
Totals |
W |
X |
In the above examples, FC can be used when the High RC Group is at full regulatory compliance, but FC* needs to be used when the High RC Group is including substantial as well as full regulatory compliance. By using both equations/algorithms, it better deals with the results of the Regulatory Compliance Theory of Diminishing Returns.
The results should clearly show that only positive (+) coefficients will become Regulatory Compliance Key Indicators versus those rules that do not show any relationship to overall regulatory compliance (0), but now the negative (-) coefficients will more clearly show when any false negatives appear and clearly not include them as Regulatory Compliance Key Indicators. This is a major improvement in the Regulatory Compliance Key Indicator methodology which clearly demonstrates the differences in the results. It provides a gateway in regulatory compliance data distributions where substantial regulatory compliance is heavily present while full regulatory compliance is not. This could become a problem as the regulatory science field moves forward with the use of the Regulatory Compliance Theory of Diminishing Returns.
43. Uncertainty-Certainty Matrix Logic Model and Algorithms
The Uncertainty-Certainty Matrix (UCM) has been introduced for licensing decision making and validating differential monitoring approaches. This section builds upon this introduction by presenting a logic model and its corresponding algorithms. The purpose of this section is to expand that original thinking and to introduce the associated algorithms that specify the UCMLMA (Uncertainty-Certainty Matrix Logic Model and Algorithms).
The UCMLMA will build off the contingency table and confusion matrix logic modeling as described above (in tables 1 and 2) in the following matrix (Table 20).
Table 20. UCMLMA: Uncertainty-Certainty Matrix Logic Model and Algorithms.
Table 20: UCMLMA: Uncertainty-Certainty Matrix Logic Model and Algorithms
|
UCMLMA |
Actual: |
Individual |
Inspector |
|---|---|---|---|
|
Reality: |
Decisions: |
C = Compliance |
NC = Non Compliance |
|
Gold |
C = Compliance |
TP = True Positive |
FP = False Positive |
|
Standard |
NC = Non Compliance |
FN = False Negative |
TN = True Negative |
From this matrix certain licensing decision making can be made and certain biases can be avoided with the following algorithms related to compliance and non compliance of rules/regulations.
TP + TN is the ideal situation in which all decisions are made correctly. Accuracy can be measured by ((TP x TN) - (FN x FP) / sqrt ((TP + FN) (FP + TN) (TP + FP) (FN + TN)) with a coefficient closer to +1.00.
TP + FP + FN + TN is a totally random situation where decisions are not reliable nor valid, there is no rhyme or reason to the decision making process by the individual inspector. Randomness can be measured by the following: (TP x TN) - (FN x FP) / sqrt ((TP + FN) (FP + TN) (TP + FP) (FN + TN)) with a coefficient closer to 0.00.
TP + FP introduces a positive bias in which the inspector has a tendency to always make a decision in which the program is in compliance with specific rules. They are overly lenient in their interpretation of the rules. Positive bias sensitivity can be measured by FP / (TP + FP). The higher the percent, the more bias is present.
FN + TN introduces a negative bias in which the inspector has a tendency to always make a decision in which the program is in non compliance with specific rules. They are overly stringent in their interpretation of the rules. Negative bias sensitivity can be measured by FN / (FN + TN). The higher the percent, the more bias is present.
Table 21. UCMLMA: Uncertainty-Certainty Matrix Logic Model and Algorithms Applied to Differential Monitoring.
Table 21: UCMLMA: Uncertainty-Certainty Matrix Logic Model and Algorithms Applied to Differential Monitoring
|
UCMLMA |
Overall |
Compliance |
|
|---|---|---|---|
|
Individual |
Decisions: |
High Group (top 10%) |
Low Group (bottom 10%) |
|
Rule/Standard/ |
C = Compliance |
TP = True Positive |
FP = False Positive |
|
Regulation |
NC = Non Compliance |
FN = False Negative |
TN = True Negative |
From this matrix (Table 21), certain decisions can be made regarding differential monitoring validation related to key indicators, risk assessment, regulatory compliance levels and individual rule performance with the following algorithms.
TP + TN is the ideal result when determining key indicators because the individual rule statistically predicts overall compliance with all rules. Accuracy can be measured with the following: ((TP x TN) - (FN x FP) / sqrt ((TP + FN) (FP + TN) (TP + FP) (FN + TN)) with the coefficient being closer to +1.00.
TP + FP is what happens with high risk rules in that they are always in compliance and one sees very little non compliance with these high risk rules generally. Sensitivity can be measured by FP / (TP + FP). Higher compliance rates would generally indicate higher risk rules.
TP is when 100% full compliance is always present. The greater the number or percent of total programs being 100% in full compliance, the greater the skewness in the data distribution.
TP + FN is present when substantial regulatory compliance is used as a criterion for licensing decision making. The higher the number, the greater the skewness in the data distribution.
FN + TN occurs when a rule is difficult to comply with. The following algorithm can be used FN / (FN + TN) to measure how difficult the rule is. The greater the percent, the more difficult the rule is.
FP + TN occurs when programs are performing poorly and there is a great deal of non compliance with the rules. The greater the number of programs indicates a poorly performing system of rules.
FP + FN is an example of a terrible rule that predicts the opposite of what we intended with overall regulatory compliance. The following algorithm ((TP x TN) - (FN x FP) / sqrt ((TP + FN) (FP + TN) (TP + FP) (FN + TN)) can be used with coefficients closer to -1.00 demonstrating this finding.
The above two tables (table 20 and 21) and their corresponding algorithms give a structured approach to licensing decision making and differential monitoring validation. It should provide the licensing administrator with a data driven and empirical method based upon regulatory science principles. By utilizing the concepts, logic model, and algorithms presented in this working paper, it will hopefully add to a regulatory scientific approach in the human services licensing and regulatory administration field when it comes to making licensing decisions that avoid bias and reliability & validity errors in decision making.