Your browser does not fully support modern features. Please upgrade for a smoother experience.
Please note this is a comparison between Version 2 by Lindsay Dong and Version 1 by Yongxin Teng.
The ever-increasing world population and environmental stress are leading to surging demand for nutrient-rich food products with cleaner labeling and improved sustainability. Plant proteins, accordingly, are gaining enormous popularity compared with counterpart animal proteins in the food industry. While conventional plant protein sources, such as wheat and soy, cause concerns about their allergenicity, peas, beans, chickpeas, lentils, and other pulses are becoming important staples owing to their agronomic and nutritional benefits. However, the utilization of pulse proteins is still limited due to unclear pulse protein characteristics and the challenges of characterizing them from extensively diverse varieties within pulse crops.
- pulse protein
- composition
- structure–property relationship
1. Introduction
By 2050, the world’s population will exponentially increase to over 10 billion from the current 7.9 billion, according to the World Health Organization (UNFPA, 2020). A major challenge of food scarcity will arise from climate change, the rapid growth of the global population, and imbalance in food production, which may inevitably lead to severe human malnutrition. Protein-energy malnutrition (PEM) is responsible for six million deaths worldwide annually [1]. The main source of dietary protein is highly reliant on animal-derived products, such as muscles, eggs, dairy, and their processed products, although livestock farming generates more pollution including sewage and greenhouse gas than crop production [2,3,4][2][3][4].
Pulse crops have drawn increasing attention in the food industry due to their low production cost, non-GMO status, and high yield of nutritious proteins [8][5]. According to the Food and Agriculture Organization (FAO) of the United Nations in 2023, pulses, the seeds of leguminous plants, serve 36 food and feed purposes and offer benefits to both food security and environmental sustainability. In terms of nutritional composition, pulse seeds contain more than 30% protein, carbohydrates including digestible and resistant starch, and dietary fibers, as well as essential vitamins and minerals and bioactive phytochemicals [9][6]. For these reasons, pulses have been suggested as wholesome alternatives to animal proteins. With their advantages of hypoallergenicity, broad acceptance, and better bioaccessibility, pulse proteins have gained popularity in the supply chain [10][7]. However, pulse crops, unlike common staple crops (e.g., soybeans), originate from a vast array of sources and showcase a remarkable diversity of species [11,12][8][9]. As a result, pulse proteins derived from different crops are distinguished from each other in structure, composition, and especially in functional properties. To achieve the full potential of pulse proteins in food applications, it is important to gain a comprehensive understanding of primary pulse crop varieties, their geographic distribution, their production quantities, and, most notably, the specific differentiations in protein attributes.
32. Origins and Compositions of Pulse Crops
The term “pulse” is defined as the nutritional-dense edible legume crops that are harvested solely for dry seeds, e.g., dry peas (Pisum sativum), pigeon peas (Cajanus cajan), chickpeas (Cicer arietinum), cowpeas (Vigna unguiculata), lentils (Lens culinaris), common beans (Phaseolus vulgaris), faba beans (Vicia faba), bambara beans (Vigna subterranea), mung beans (Phaseolus aureus), black gram (Phaseolus mungo), moth beans (Phaseolus aconitifolius), and velvet beans (Stizolobium spp.) [8,12][5][9]. The genera, species, and common names of some typical pulses are systematically summarized in Table 1. According to the U.N. Food and Agriculture Organization (FAO), the annual worldwide production quantities (from 1961 to 2020) of some pulses are depicted in Figure 1A. Over the past four decades, the production of pulse crops experienced obvious upward trends; meanwhile, pulses have also become the second most consumed crops, after cereals, for human diets around the world [11,12][8][9]. Dry beans, peas, and chickpeas are the most popular strains among all pulses, and their annual production is approximately three times higher than those in 1961. Owing to the reduced moisture contents, pulses exhibit a relatively long storage life compared to fresh legumes and thus are widely cultivated all over the world [12][9]. Geographically, pulse crops are grown in India, North America, China, and Europe, which exhibit excellent soil and climate tolerance [11,21][8][10]. For example, beans are primarily produced in South America, North America, Asia, and Africa (Figure 1B), while most peas are grown in Asia, Europe, and North America (Figure 1C).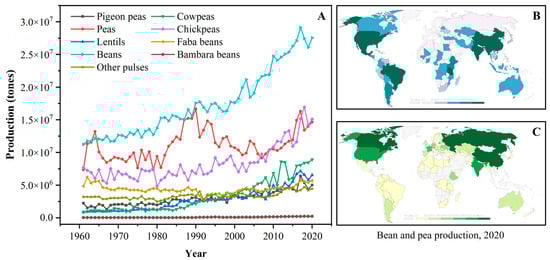
Figure 1. (A): The annual production quantity of pulse crops worldwide from 1961 to 2020 (FAO, 2020); (B): The distribution of bean production worldwide in 2020; (C): The distribution of pea production worldwide in 2020 (data obtained from Our World in Data, https://ourworldindata.org/, accessed on 17 July 2023).
From the nutritional perspective, pulse crops contain carbohydrates, fibers, minerals, vitamins, and other significant bioactive substances, with >30% protein as the most noticeable attribute [12][9]. The macronutrient composition of several common pulses is listed in Table 2 [22,23,24,25,26,27,28,29]. While carbohydrate is typically the highest content among nutrients, protein ranks second in these pulse products. Due to their high protein content and being non-demanding in farming conditions, pulses have been staple crops in regions where meat protein is scarce. Except for chickpeas and lupins, all pulses are low in fat content (<5%, w/w) [27][11]. Even so, a high unsaturated fatty acid profile in pulses has been reported [22][12]. Combined with the high content of dietary fibers, pulses including peas have been proven to protect against cardiovascular disease and obesity [30][13].
43. Composition and Structure of Pulse Protein Isolates
4.1. Amino Acid Composition
3.1. Amino Acid Composition
The nutritional properties and functional characteristics of pulse protein isolates are determined by their amino acid compositions and sequences (primary structure) as well as the derived higher-level structures, i.e., secondary, tertiary, and quaternary, during their folding and complexation. On this basis, the additional advanced structures are assembled through dynamic bonding such as hydrogen bonds, hydrophobic contacts, electrostatic interaction, and disulfide bonds [36][14]. The amino acid (AA) composition of several selected pulse proteins is given in Table 31 [9,11,25,27,37,38,39,40][6][8][11][15][16][17][18][19]. It is notable that the contents of essential amino acids, including lysine, leucine, aspartic acid, glutamic acid, and arginine, are relatively high in pulse proteins. Particularly, lysine, a well-known limiting essential AA in cereals, is abundant in pulse proteins; for example, the lysine content is about 7.7 g per 100 g in chickpea and pea proteins [37,38][16][17]. However, according to the sequences, pulse proteins are deficient in two essential AAs, methionine and tryptophan. Therefore, it is viable to complement pulse with tryptophan-rich proteins such as canola protein to offer a complementary essential AA composition [11,40][8][19]. Variations in AA profiles of different pulse proteins are caused by their species, growth environments, and differences in measurement methods [12,27,37][9][11][16].
Based on solubility in water, saline, dilute acid or alkali, and alcohol, pulse proteins are empirically divided into four primary fractions known as albumin, globulin, glutelin, and prolamin, respectively [24,43][20][21]. The reported range of primary protein compositions is given in Table 42 [23,25,39,44,45,46,47][15][18][22][23][24][25][26]. Pulse protein isolates are predominantly constituted by globulin and albumin at approximately 50–80% and 10–20% of total storage proteins, respectively, where glutelin (10%) and prolamin (less than 5%) are minor constituents. These subunit compositions vary considerably in structures and functions [42,48][27][28].
| Amino Acid | Pea | Chickpea | Lentil | Mung Bean | Lupin | Cowpea | Faba Bean | Pigeon Pea |
|---|
Table 42.
Osborne protein composition of pulse proteins (g/100 g dry matter).
| Albumin | Globulin | Glutelins | Prolamins | ||||||||||
|---|---|---|---|---|---|---|---|---|---|---|---|---|---|
| Essential AA | |||||||||||||
| Pea [43 | ,45] | [21] | [ | 24 | ] | 18–25 | |||||||
| 55–65 | Isoleucine (Ile, I) | 0.4–4.9 | 0.4–4.1 | 0.5–5.0 | 1.0–4.7 | 1.2–3.2 | 4.3–4.4 | 1.1–4.3 | 4.8 | ||||
| Leucine (Leu, L) | 1.3–8.4 | 0.5–7.0 | 0.8–7.9 | 1.8–8.4 | 2.0–7.4 | 7.1–7.5 | 2.0–8.2 | 7.5 | |||||
| 3–4 | 4–5 | ||||||||||||
| Chickpea [44][23] | 8–12 | 53–60 | 19–25 | 3–7 | |||||||||
| Lentil [39,46][18][25] | 16–17 | 51–70 | 11 | 3–4 | Lysine (Lys, K) | 1.4–7.7 | 0.9–7.7 | 0.5–7.2 | 1.7–4.2 | 1.2–7.6 | 3.9–6.6 | ||
| Mung bean [23,39][ | 1.9 | 18][ | 4.4 | ||||||||||
| 22] | 16.3 | 62 | 13.3 | 0.9 | Methionine (Met, M) | 0.2–3.3 | 0.1–1.9 | 0.1–2.9 | 0.3–1.9 | 0.2–0.3 | |||
| Faba bean [47][26 | 1.2–1.3 | ] | 0.2–0.8 | 1.2 | |||||||||
| 18.4–21.9 | 61.6–68 | 10.2–12.2 | 3.4–4.3 | Phenylalanine (Phe, F) | 0.2–8.1 | 0.4–5.9 | 0.6–7.8 | 1.1–5.7 | 1.0–3.3 | 4.0–5.6 | 1.2 | 3.9 | |
| Cowpea [25][15] | 4–12 | 58–80 | 10–15 | 1–3 | Threonine (Thr, T) | 0.9–4.5 | 0.1–3.6 | 0.6–3.8 | 0.8–3.2 | 1.0–4.3 | 2.5–3.7 | 1.0–13.0 | |
| Lupin [25][15 | 2.8 | ||||||||||||
| ] | 9–22 | 44–60 | 6–23 a | Tryptophan (Trp, W) | 0.2–1.0 | 0.2–1.1 | 0.7–0.8 | 0.3–1.0 | 0.2–0.3 | 0.3–1.1 | 0.2–1.1 | NR | |
| Valine (Val, V) | 0.4–5.2 | 0.4–3.8 | 0.7–5.3 | 1.2–5.2 | 1.1–3.5 | 4.6–4.9 | 1.2 | 4.7 | |||||
| Arginine (Arg, R) | 1.2–8.7 | 0.5–10.3 | 0.9–7.8 | 1.7–6.3 | 2.8–10.9 | 7.3 | 2.6–10.3 | NR | |||||
| Histidine (His, H) | 0.5–2.8 | 0.2–3.4 | 0.4–3.4 | 0.7–3.6 | 0.7–3.1 | 2.8–3.5 | 0.9–2.7 | 4.0 | |||||
| Non-essential AA | |||||||||||||
| Alanine (Ala, A) | 0.8–4.8 | 0.3–4.8 | 2.0–4.2 | 3.5–4.4 | 0.9–2.8 | 3.7–4.3 | 1.2–4.2 | 4.5 | |||||
| Aspartic acid (Asp, D) | 2.1–11.9 | 0.6–11.4 | 1.1–11.3 | 8.4–13.5 | 2.8–8.4 | 7.8–11.9 | 3.1 | 8.2 | |||||
| Cystine (Cys, C) | 0.4–1.6 | 1.3–2.3 | 0.0–1.0 | 0.8–1.8 | 0.3–0.6 | 1.0–1.8 | 0.4–1.9 | 2.2 | |||||
| Glutamic acid (Glu, E) | 2.9–18.5 | 1.7–17.3 | 2.4–15.1 | 6.1–21.7 | 6.2–26.1 | 6.0–18.5 | 4.6–13.0 | 6.2 | |||||
| Glycine (Gly, G) | 0.8–4.8 | 0.3–4.1 | 1.0–4.8 | 4.1–4.26 | 1.0–3.7 | 4.1–4.2 | 1.2–4.2 | 4.6 | |||||
| Proline (Pro, P) | 0.8–4.6 | 0.2–4.6 | 0.9–3.8 | 2.8–4.2 | 1.1–4.3 | 2.8–3.6 | 1.2–3.9 | 3.0 | |||||
| Serine (Ser, S) | 0.8–5.7 | 0.1–4.9 | 1.1–4.9 | 2.5–5.0 | 1.3–6.0 | 2.6–5.6 | 1.3 | 2.7 | |||||
| Tyrosine (Tyr, Y) | 0.6–3.8 | 0.2–3.7 | 0.5–3.2 | 3.3–3.4 | 1.0–4.3 | 3.2–5.0 | 0.9 | 3.2 | |||||
4.2. Protein Fractions and Structures
3.2. Protein Fractions and Structures
a = Sum of glutelin and prolamin.
Albumins are small, compact globular units, ranging in molecular weight from 5 to 80 kDa, and typically composed of two polypeptide chains. They have a three-dimensional structure that is abundant in α-helices and a well-preserved skeleton composed of eight cysteine residues [9][6]. Protease inhibitors, lectins, amylase inhibitors, and enzymatic proteins are common in pulses belonging to albumins [45,49][24][29]. As shown in Table 42, pea and faba beans contain higher albumins than other pulses.
Globulins are the dominant protein components found in pulses and can be further classified into main legumin (11 S) and vicilin (7 S) proteins based on their sedimentation coefficients (S = Svedberg Unit), with minor levels of a third type known as convicilin [9,21][6][10].
Legumin is a hexameric protein with a stiff conformation and considerable quaternary structure, with a molecular mass of 300 to 400 kDa [9,51][6][30]. It is composed of six subunit pairs (each around 60 kDa), which interact noncovalently, and is further assembled through two trimeric intermediates.
Vicilin is an oligomeric protein with a trimeric structure that ranges in molecular mass from 150 to 190 kDa. Each monomer is between 50 and 70 kDa and consists of three subunits (α, β, and γ), which are linked together primarily by electrostatic forces and noncovalent hydrophobic interactions [53][31]. Due to the deficiency of sulfur-containing AAs, no disulfide bond is present between vicilin protein molecules. Nevertheless, vicilin includes significant amounts of arginine, lysine, aspartic acid, and glutamic acid [21,37][10][16].
Convicilin, a constituent of globulin, has been found as the third minor storage protein in pulses, in addition to legumin and vicilin [56][32]. A convicilin molecule is about 70 kDa and is often found as a trimer of about 210 kDa (or 290 kDa including an N-terminal extension) comprised of three convicilin molecules or as heteromeric trimers of convicilin and vicilin.
Glutelin and prolamin are also present in trace amounts in pulses. Glutelin contains considerable quantities of methionine and cysteine, unlike globulin. The abundance of sulfur-containing AAs facilitates the formation of disulfide bonds between protein molecules, which promotes aggregation [58][33]. It was reported that the high glutelin content in grains, such as rice, is associated with low aqueous solubility [59][34].
54. Functionality and Food Application of Pulse Protein Isolates
5.1. Solubility
4.1. Solubility
Solubility is one of the most important protein properties affecting its bioavailability and other related functionalities, such as interfacial characteristics, digestibility, and gelling properties [11][8]. The ratio of hydrophilic to hydrophobic residues and their arrangement in AA sequences determine how soluble the protein molecule is in aqueous media. Protein solubility is hampered by the formation of aggregates, which are brought on by hydrophobic interactions between protein molecules caused by hydrophobic surface patches [7,30][13][35]. In addition, pH, temperature, type, and strength of the salt ions, as well as other factors in the solution environment, all have a significant impact on the solubility of pulse proteins [33,43][21][36]. In terms of pH, proteins are least soluble at their isoelectric point due to a zero net surface charge, which causes protein molecules to aggregate into bigger structures. On the other hand, when the pH values are higher or lower than the protein’s isoelectric point, proteins exert a negative or positive net charge on the solution, and the electrostatic repulsion between charged molecules promotes the solubility of the proteins [42][27]. V-shaped solubility characteristics against pH, with better solubility under extremely acidic (below pH 3) or alkaline (above pH 9) environments and lowest solubility at the isoelectric point (pH 4–5), have been reported for lentil, green mung bean, pigeon pea, cowpea, pea, and chickpea protein isolates [27][11].5.2. Water/Oil Holding Capacity
4.2. Water/Oil Holding Capacity
The terms “water holding capacity” (WHC) and “oil holding capacity” (OHC) describe how much water and oil, respectively, can be absorbed per gram of pulse protein. As with solubility, the WHC and OHC of proteins also are determined by the ratio of hydrophilic to hydrophobic amino acids on protein particles’ surfaces [11,33,44][8][23][36]. These two characteristics are crucial when evaluating the quality, texture, and mouth feel of pulse protein products.5.3. Emulsifying and Foaming Properties
4.3. Emulsifying and Foaming Properties
Pulse proteins have both emulsifying and foaming properties, which are both extensively used in food. These two characteristics, like WHC and OHC, are influenced by proteins’ amphiphilic nature [11,12][8][9]. An emulsion is a mixture of two immiscible liquid phases, typically water and oil, in which one liquid is distributed inside the continuous phase of the other. Due to their different densities and immiscibility, the two phases’ interface is thermodynamically unstable. The applications of pulse proteins in emulsion-based foods like milk analogs, batters, cakes, soups, and mayonnaise require their capability of forming or retaining a stable oil/water interface. By creating an interfacial film around oil phases diffused in an aqueous system, pulse protein isolates could function as emulsifiers, preventing structural changes like coalescence, creaming, sedimentation, or flocculation [39,62][18][37]. Two indexes are frequently used to assess the emulsifying capabilities of pulse protein isolates: emulsifying activity (EA) and emulsifying stability (ES). EA quantifies how much oil can be emulsified per unit of protein, while ES quantifies the emulsion’s capacity to withstand structural changes over a predetermined period. Emulsifying qualities of the protein isolates in various pulses and their varieties vary greatly. Foaming is crucial in some specific food applications, such as milk tea, whipped toppings, mousses, chiffon cakes, ice cream mixes, etc. [67][38]. Foam is a dispersion of gas bubbles formed when air bubbles are trapped by thin liquid layers [68][39]. Foam generation depends on the interfacial tension between two immiscible phases (aqueous and air), just as emulsions, and requires an energy input (sparging, whipping, or shaking) [14,60][40][41]. Foams are thermodynamically unstable because of the large free energy present at the gas–liquid interface, which causes them to agglomerate and become disproportionate, thereby decreasing the interfacial area. Due to their capacity to lower surface tension from the amphiphilic properties and create sturdy interfacial membranes through protein–protein interplay, pulse protein isolates can stabilize the air/water interfaces of foams. The foaming properties of pulse protein isolates are evaluated by their foaming capacity (FC) and foam stability (FS), where FC is the ratio of the volume of the whipped foam of the protein solution to the solution volume, and FS is the amount of time needed for the foam to lose a specific amount of volume [27,67][11][38]. The source of protein, environmental factors (like temperature and pH), and whipping strength all affect foaming performance. Different pulse proteins (beans, peas, and chickpeas) exhibited greater foaming in the acidic and alkaline pH ranges while exhibiting lower values at pH levels near the isoelectric point [21,69][10][42].5.4. Gelation Properties
4.4. Gelation Properties
Gel is a three-dimensional spatial network structure formed by the interaction between molecules and polysaccharides, and protein combinations are the most typical gelling composites in food products. Gel-like food products retain their unique structure and resist flow under force, especially heating and then cooling [60,67][38][41]. Gelation controls morphology, texture, and viscoelasticity, which affect foods’ general rheological and taste attributes. In viscous products like mousse, soup, gels, curds, and meat substitutes, gelation is a crucial functional characteristic of pulse protein isolates. The interaction of heat-induced denatured protein molecules to form a three-dimensional spatial structure that encloses water, oil, and other food matrices is the primary cause of the gelation of pulse proteins under temperature changes [71][43]. The protein content needed to produce a stable gel from a liquid is defined as the least gelling concentration (LGC), and it is used to measure the gelation properties of pulse proteins. Therefore, proteins with lower LGC values have a better capacity to form stable gel structures. Protein concentration, pH, ionic strength, amino acid ratio, and interactions with other elements are just a few of the variables that affect the thickening process of protein gels. The LGC values of protein isolates from different pulses were measured in the range of 80 g/L (pigeon bean) to 160 g/L (mung bean) [27][11].5.5. Bioactive Properties
4.5. Bioactive Properties
Pulse protein isolates are widely used as food ingredients mainly due to their macronutrient supplementation and physicochemical functional properties. However, due to the intensive development of the protein’s biological activity in recent years, it has caught the increasing attention of researchers. Pulse proteins are considered to have antimicrobial properties as well as the ability to reduce the risk of certain diseases, such as type 2 diabetes, metabolic syndrome, and obesity [73][44]. Pulse proteins’ ability to interact with elements of bacterial, fungal, or viral cells is what is thought to be responsible for their antimicrobial activity, such as the binding of lectins with hyphae [73][44].5.6. Food Application
4.6. Food Application
Traditionally, pulse crops, as a staple food along with cereals in many parts of the world, were mainly consumed with simple cooking such as soaking and boiling [38][17]. Nowadays, with the advances in food processing technology and the requirement for precision health, pulse protein isolates are separated from grains and then used solely as raw materials or food additives in the formulated products [12,40][9][19]. Nadeeshani et al. reviewed the utilization of pulse protein in food and industrial applications [38][17].65. Modification Strategies of Pulse Protein Isolates
6.1. Chemical Covalent Modifications
5.1. Chemical Covalent Modifications
Chemical covalent modification is an unambiguous strategy for precisely altering pulse protein structure to improve functional properties. Typically, chemical covalent modifications produce tailorable functionalities by selectively incorporating functional groups on protein side chains through reactive residues of interest. Currently, pulse protein isolates have been reported to undergo various chemical covalent modifications, mainly including acylation, amidation, esterification, glycation, and phosphorylation. Protein acylation is the process of adding acyl groups to protein molecules, and acetylation and succinylation are the two main forms that have been successfully performed on pulse protein isolates. Shah et al. performed a hydrophobic modification of pea proteins by using succinic anhydride, octenyl succinic anhydride, and dodecyl succinic anhydride [87][45]. Modified pea proteins exhibited better functional properties and performance as additives in an eggless cake formulation. Charoensuk et al. indicated that succinylation at low succinic anhydride addition altered mung bean protein charge and significantly improved emulsifying properties [88][46]. The process of glycosylation entails the affixing of carbohydrate moieties to lysine residues or the N-terminus of a protein, which is usually accompanied by the Maillard reaction. Caballero and Davidov-Pardo suggested that Maillard conjugation could improve the emulsification properties of pea protein isolates [89][47].6.2. Non-Covalent Complexation Modifications
5.2. Non-Covalent Complexation Modifications
Non-covalent dynamic bonds form through intermolecular forces or interactions with substances, such as protein–protein, protein–polysaccharide, and protein–polyphenol interactions, resulting in protein conformation changes as well as the formation of protein complexation [92,93,94][48][49][50]. Pulse proteins contain hydrophobic groups that spontaneously form hydrophobic cavities in aqueous solutions, allowing non-covalent interactions with hydrophobic small molecules like epigallocatechin-3-gallate (EGCG), rutin, quercetin, chlorogenic acid, and resveratrol [93,94,95,97][49][50][51][52]. In a study by Hao et al., the presence of polyphenols improves the foaming, emulsification, and in vitro digestibility of pea protein isolates [93][49]. Similarly, Han et al. observed enhanced interfacial properties in PPI–EGCG complexes compared to pea protein alone [95][51]. In addition to polyphenolic compounds, specific hydrophilic small molecules, such as arginine [98][53], have been shown to enhance protein functionality.6.3. Physical Modifications
5.3. Physical Modifications
Novel physical processing technologies have emerged as alternatives to traditional heat or chemical modifications for improving pulse protein functionalities, often bearing the label of ‘clean’ and ‘additive-free’ [102,103][54][55]. Generally, physical modifications can be categorized into thermal (such as microwave heating, radio frequency heating, ohmic heating, and infrared heating) and non-thermal (including ultrasonication, cold plasma, pulsed electric fields, and high hydrostatic pressure) processes [16,104][56][57]. Non-thermal modification is garnering substantial attention due to its innovative attributes: it minimizes damage to nutritional and sensory properties with advantages in cleanness, sustainability, and low energy consumption [105][58].6.4. Biological Modifications
5.4. Biological Modifications
Biological modifications of pulse proteins involve the alteration of their primary structure, primarily targeting amino acid residues and polypeptide chains using biological agents, including proteolytic enzymes, non-proteolytic enzymes, and microorganisms [9,18][6][59]. Biological methods are preferred in food product development for their gentle reaction conditions, substrate specificity, and selectivity, which reduce the likelihood of adverse reactions. As a result, biological approaches have gained increasing attention for modifying pulse proteins. One common method is protease hydrolysis, which involves the cleavage of specific peptide bonds with the addition of water molecules, leading to a reduction in molecular weight (Mw). Protease hydrolysis has been demonstrated to enhance the functional properties of pulse proteins, resulting in a more flexible and loosely structured protein. Various proteolytic enzymes (e.g., papain, trypsin, alcalase, and neutrase) have been used in the attempted hydrolysis [116,117][60][61]. Treated pulse proteins showed significantly improved solubility, foaming, and emulsifying properties. These enhancements are attributed to the increased flexibility when the protein molecular weight decreases, which allows the molecules to have superior adsorption capabilities at oil–water or gas–liquid interfaces, leading to an improved interface stability [118][62]. Additionally, non-proteolytic enzymes, such as transglutaminase (TGase), can catalyze the intra- or intermolecular cross-linking of proteins through forming ε-(γ-glutamyl) lysine (ε-(γ-Glu) Lys) isopeptide bonds, significantly enhancing the protein gelation properties [122][63]. Sun and Arntfield used TGase to lower the minimum gelation concentration of pea protein from 5.5% to 3% (w/v) [123][64]. The resulting pea protein gel exhibited increased gel strength and elasticity, confirmed by the increased magnitudes of both G′ and G″ modulus.76. Conclusions
Although many approaches have been developed and attempted to modify pulse protein isolates to improve their functionality in food products, a deep understanding of the composition and structure of pulse proteins is the key to further maximizing their utilization, as well as finding more approachable, scalable, and economic methods to increase their utilization. Till now, the interfacial behaviors, gelation properties, and hydration effects of most pulse proteins, including peas, beans, chickpeas, and lentils, have been widely reported. Meanwhile, the obtained protein powders, hydrogels, or dispersions are playing an increasingly vital role in food formulations. It is also noteworthy that though the clean-label nature and health benefits of pulse proteins are obvious advantages over many other plant/animal resources, the functionalities of pulse proteins are still less competitive. For example, the poor solubility of chickpea protein hinders its use as an aqueous ingredient, and the interfacial stability of pea protein is still worth further improvement compared with that of soybean. Thus, to enable more practical uses of pulse proteins in foods, modification is necessary. And the diversified origins and protein structures of pulse proteins also lead to the distinguished physicochemical properties among different pulse protein isolates. Developing effective and efficient screening mechanisms and workflows is essential considering the diversity of pulse protein products. To address these challenges, research in matching a specific protein candidate for certain food applications can be critical in filling the gap, for example, i.e., chickpea protein for cryoprotectants, lenticel for binders, pea protein for interfacial stabilizers, etc. Moreover, novel and green modification strategies for pulse proteins are still highly desirable, in which non-covalent multicomponent-based complexation, physical field-assisted modification, and enzymatic modifications hold promise. These three aspects of modification strategies, along with suitable applications, of pulse proteins merit further investigation and are worthy of a more in-depth review discussion.
Author Contributions
References
- Marquez-Mota, C.C.; Rodriguez-Gaytan, C.; Adjibade, P.; Mazroui, R.; Galvez, A.; Granados, O.; Tovar, A.R.; Torres, N. The mTORC1-Signaling Pathway and Hepatic Polyribosome Profile Are Enhanced after the Recovery of a Protein Restricted Diet by a Combination of Soy or Black Bean with Corn Protein. Nutrients 2016, 8, 573.
- McClements, D.J.; Grossmann, L. The science of plant-based foods: Constructing next-generation meat, fish, milk, and egg analogs. Compr. Rev. Food Sci. Food Saf. 2021, 20, 4049–4100.
- Jiang, Y.S.; Sun, J.Y.; Yin, Z.T.; Li, H.H.; Sun, X.T.; Zheng, F.P. Evaluation of antioxidant peptides generated from Jiuzao (residue after Baijiu distillation) protein hydrolysates and their effect of enhancing healthy value of Chinese Baijiu. J. Sci. Food Agric. 2020, 100, 59–73.
- Jiang, Y.S.; Wang, R.; Yin, Z.T.; Sun, J.Y.; Wang, B.W.; Zhao, D.R.; Zeng, X.A.; Li, H.H.; Huang, M.Q.; Sun, B.G. Optimization of Jiuzao protein hydrolysis conditions and antioxidant activity in vivo of Jiuzao tetrapeptide Asp-Arg-Glu-Leu by elevating the Nrf2/Keap1-p38/PI3K-MafK signaling pathway. Food Funct. 2021, 12, 4808–4824.
- Lal, R. Improving soil health and human protein nutrition by pulses-based cropping systems. Adv. Agron. 2017, 145, 167–204.
- Zha, F.; Rao, J.; Chen, B. Modification of pulse proteins for improved functionality and flavor profile: A comprehensive review. Compr. Rev. Food Sci. Food Saf. 2021, 20, 3036–3060.
- Rivera, J.; Siliveru, K.; Li, Y. A comprehensive review on pulse protein fractionation and extraction: Processes, functionality, and food applications. Crit. Rev. Food Sci. Nutr. 2022, 1–23.
- Bessada, S.M.F.; Barreira, J.C.M.; Oliveira, M.B.P.P. Pulses and food security: Dietary protein, digestibility, bioactive and functional properties. Trends Food Sci. Technol. 2019, 93, 53–68.
- Reddy, P.P. Pulse Crops. In Nematode Diseases of Crops and Their Management; Springer: Berlin, Germany, 2021; pp. 67–95.
- Shevkani, K.; Singh, N.; Chen, Y.; Kaur, A.; Yu, L. Pulse proteins: Secondary structure, functionality and applications. J. Food Sci. Technol. 2019, 56, 2787–2798.
- Tang, X.; Shen, Y.T.; Zhang, Y.Q.; Schilling, M.W.; Li, Y.H. Parallel comparison of functional and physicochemical properties of common pulse proteins. LWT-Food Sci. Technol. 2021, 146, 111594.
- Boeck, T.; Sahin, A.W.; Zannini, E.; Arendt, E.K. Nutritional properties and health aspects of pulses and their use in plant-based yogurt alternatives. Compr. Rev. Food Sci. Food Saf. 2021, 20, 3858–3880.
- Marinangeli, C.P.; Jones, P.J. Whole and fractionated yellow pea flours reduce fasting insulin and insulin resistance in hypercholesterolaemic and overweight human subjects. Br. J. Nutr. 2011, 105, 110–117.
- Liu, B.; Jiang, M.; Zhu, D.; Zhang, J.; Wei, G. Metal-organic frameworks functionalized with nucleic acids and amino acids for structure-and function-specific applications: A tutorial review. Chem. Eng. J. 2022, 428, 131118.
- Hall, C.; Hillen, C.; Garden Robinson, J. Composition, Nutritional Value, and Health Benefits of Pulses. Cereal Chem. 2017, 94, 11–31.
- Boye, J.; Zare, F.; Pletch, A. Pulse proteins: Processing, characterization, functional properties and applications in food and feed. Food Res. Int. 2010, 43, 414–431.
- Nadeeshani, H.; Senevirathne, N.; Somaratne, G.; Bandara, N. Recent Trends in the Utilization of Pulse Protein in Food and Industrial Applications. ACS Food Sci. Technol. 2022, 2, 722–737.
- Shrestha, S.; van’t Hag, L.; Haritos, V.S.; Dhital, S. Lentil and Mungbean protein isolates: Processing, functional properties, and potential food applications. Food Hydrocoll. 2022, 135, 108142.
- Venkidasamy, B.; Selvaraj, D.; Nile, A.S.; Ramalingam, S.; Kai, G.; Nile, S.H. Indian pulses: A review on nutritional, functional and biochemical properties with future perspectives. Trends Food Sci. Technol. 2019, 88, 228–242.
- Halimi, R.A.; Barkla, B.J.; Mayes, S.; King, G.J. The potential of the underutilized pulse bambara groundnut (Vigna subterranea (L.) Verdc.) for nutritional food security. J. Food Compos. Anal. 2019, 77, 47–59.
- Lam, A.C.Y.; Karaca, A.C.; Tyler, R.T.; Nickerson, M.T. Pea protein isolates: Structure, extraction, and functionality. Food Rev. Int. 2018, 34, 126–147.
- Dahiya, P.K.; Linnemann, A.R.; Van Boekel, M.; Khetarpaul, N.; Grewal, R.B.; Nout, M.J.R. Mung Bean: Technological and Nutritional Potential. Crit. Rev. Food Sci. Nutr. 2015, 55, 670–688.
- Grasso, N.; Lynch, N.L.; Arendt, E.K.; O’Mahony, J.A. Chickpea protein ingredients: A review of composition, functionality, and applications. Compr. Rev. Food Sci. Food Saf. 2022, 21, 435–452.
- Lu, Z.; He, J.; Zhang, Y.; Bing, D. Composition, physicochemical properties of pea protein and its application in functional foods. Crit. Rev. Food Sci. Nutr. 2020, 60, 2593–2605.
- Jo, Y.-J.; Huang, W.; Chen, L. Fabrication and characterization of lentil protein gels from fibrillar aggregates and the gelling mechanism study. Food Funct. 2020, 11, 10114–10125.
- Multari, S.; Stewart, D.; Russell, W.R. Potential of fava bean as future protein supply to partially replace meat intake in the human diet. Compr. Rev. Food Sci. Food Saf. 2015, 14, 511–522.
- Singhal, A.; Karaca, A.C.; Tyler, R.; Nickerson, M. Pulse proteins: From processing to structure-function relationships. Grain Legumes 2016, 3, 55–78.
- Ghumman, A.; Kaur, A.; Singh, N. Functionality and digestibility of albumins and globulins from lentil and horse gram and their effect on starch rheology. Food Hydrocoll. 2016, 61, 843–850.
- Hara-Hishimura, I.; Takeuchi, Y.; Inoue, K.; Nishimura, M. Vesicle transport and processing of the precursor to 2S albumin in pumpkin. Plant J. Cell Mol. Biol. 1993, 4, 793–800.
- Wang, Y.; He, S.; Zhou, F.; Sun, H.; Cao, X.; Ye, Y.; Li, J. Detection of Lectin Protein Allergen of Kidney Beans (Phaseolus vulgaris L.) and Desensitization Food Processing Technology. J. Agric. Food Chem. 2021, 69, 14723–14741.
- Jain, A.; Kumar, A.; Salunke, D.M. Crystal structure of the vicilin from Solanum melongena reveals existence of different anionic ligands in structurally similar pockets. Sci. Rep. 2016, 6, 23600.
- Domoney, C.; Casey, R. Cloning and characterization of complementary DNA for convicilin, a major seed storage protein in Pisum sativum L. Planta 1983, 159, 446–453.
- Zhu, Z.; Bassey, A.P.; Cao, Y.; Ma, Y.; Huang, M.; Yang, H. Food protein aggregation and its application. Food Res. Int. 2022, 160, 111725.
- Amagliani, L.; O’Regan, J.; Kelly, A.L.; O’Mahony, J.A. Composition and protein profile analysis of rice protein ingredients. J. Food Compos. Anal. 2017, 59, 18–26.
- Ma, K.K.; Greis, M.; Lu, J.K.; Nolden, A.A.; McClements, D.J.; Kinchla, A.J. Functional Performance of Plant Proteins. Foods 2022, 11, 594.
- Gowda, C.L.; Chaturvedi, S.; Gaur, P.; Sameer Kumar, C.; Jukanti, A. Pulses research and development strategies for India. In Pulses Handbook 2015; Commodity India: Bangalore, India, 2015; pp. 17–33.
- Vogelsang-O’Dwyer, M.; Zannini, E.; Arendt, E.K. Production of pulse protein ingredients and their application in plant-based milk alternatives. Trends Food Sci. Technol. 2021, 110, 364–374.
- Mohanan, A.; Harrison, K.; Cooper, D.M.L.; Nickerson, M.T.; Ghosh, S. Conversion of Pulse Protein Foam-Templated Oleogels into Oleofoams for Improved Baking Application. Foods 2022, 11, 2887.
- Amagliani, L.; Silva, J.V.C.; Saffon, M.; Dombrowski, J. On the foaming properties of plant proteins: Current status and future opportunities. Trends Food Sci. Technol. 2021, 118, 261–272.
- Wang, Y.T.; Wang, S.S.; Li, R.; Wang, Y.J.; Xiang, Q.S.; Li, K.; Bai, Y.H. Effects of combined treatment with ultrasound and pH shifting on foaming properties of chickpea protein isolate. Food Hydrocoll. 2022, 124, 107351.
- Wang, Y.T.; Wang, Y.J.; Li, K.; Bai, Y.H.; Li, B.; Xu, W. Effect of high intensity ultrasound on physicochemical, interfacial and gel properties of chickpea protein isolate. LWT-Food Sci. Technol. 2020, 129, 109563.
- Shevkani, K.; Kaur, A.; Kumar, S.; Singh, N. Cowpea protein isolates: Functional properties and application in gluten-free rice muffins. LWT-Food Sci. Technol. 2015, 63, 927–933.
- Gharibzahedi, S.M.T.; Smith, B. Effects of high hydrostatic pressure on the quality and functionality of protein isolates, concentrates, and hydrolysates derived from pulse legumes: A review. Trends Food Sci. Technol. 2021, 107, 466–479.
- Shevkani, K.; Singh, N.; Patil, C.; Awasthi, A.; Paul, M. Antioxidative and antimicrobial properties of pulse proteins and their applications in gluten-free foods and sports nutrition. Innov. Food Sci. Emerg. Technol. 2022, 57, 5571–5584.
- Shah, N.N.; Umesh, K.V.; Singhal, R.S. Hydrophobically modified pea proteins: Synthesis, characterization and evaluation as emulsifiers in eggless cake. J. Food Eng. 2019, 255, 15–23.
- Charoensuk, D.; Brannan, R.G.; Chanasattru, W.; Chaiyasit, W. Physicochemical and emulsifying properties of mung bean protein isolate as influenced by succinylation. Int. J. Food Prop. 2018, 21, 1633–1645.
- Caballero, S.; Davidov-Pardo, G. Comparison of legume and dairy proteins for the impact of Maillard conjugation on nanoemulsion formation, stability, and lutein color retention. Food Chem. 2021, 338, 128083.
- Lin, D.Q.; Lu, W.; Kelly, A.L.; Zhang, L.T.; Zheng, B.D.; Miao, S. Interactions of vegetable proteins with other polymers: Structure-function relationships and applications in the food industry. Trends Food Sci. Technol. 2017, 68, 130–144.
- Hao, L.L.; Sun, J.W.; Pei, M.Q.; Zhang, G.F.; Li, C.; Li, C.M.; Ma, X.K.; He, S.X.; Liu, L.B. Impact of non-covalent bound polyphenols on conformational, functional properties and in vitro digestibility of pea protein. Food Chem. 2022, 383, 132623.
- Gunal-Koroglu, D.; Turan, S.; Capanoglu, E. Interaction of lentil protein and onion skin phenolics: Effects on functional properties of proteins and in vitro gastrointestinal digestibility. Food Chem. 2022, 372, 130892.
- Han, S.; Cui, F.Z.; McClements, D.J.; Xu, X.F.; Ma, C.C.; Wang, Y.T.; Liu, X.B.; Liu, F.G. Structural Characterization and Evaluation of Interfacial Properties of Pea Protein Isolate-EGCG Molecular Complexes. Foods 2022, 11, 2895.
- Parolia, S.; Maley, J.; Sammynaiken, R.; Green, R.; Nickerson, M.; Ghosh, S. Structure-Functionality of lentil protein-polyphenol conjugates. Food Chem. 2022, 367, 130603.
- Cao, Y.G.; Li, Z.R.; Fan, X.; Liu, M.M.; Han, X.R.; Huang, J.R.; Xiong, Y.L.L. Multifaceted functionality of l-arginine in modulating the emulsifying properties of pea protein isolate and the oxidation stability of its emulsions. Food Funct. 2022, 13, 1336–1347.
- Niu, D.B.; Ren, E.F.; Li, J.; Zeng, X.A.; Li, S.L. Effects of pulsed electric field-assisted treatment on the extraction, antioxidant activity and structure of naringin. Sep. Purif. Technol. 2021, 265, 118480.
- Niu, D.B.; Zeng, X.A.; Ren, E.F.; Xu, F.Y.; Li, J.; Wang, M.S.; Wang, R. Review of the application of pulsed electric fields (PEF) technology for food processing in China. Food Res. Int. 2020, 137, 109715.
- Grossmann, L.; McClements, D.J. Current insights into protein solubility: A review of its importance for alternative proteins. Food Hydrocoll. 2023, 137, 108416.
- Lian, F.; Sun, D.-W.; Cheng, J.-H.; Ma, J. Improving modification of structures and functionalities of food macromolecules by novel thermal technologies. Trends Food Sci. Technol. 2022, 129, 327–338.
- Pan, J.Y.; Zhang, Z.L.; Mintah, B.K.; Xu, H.N.; Dabbour, M.; Cheng, Y.; Dai, C.H.; He, R.H.; Ma, H.L. Effects of nonthermal physical processing technologies on functional, structural properties and digestibility of food protein: A review. J. Food Process Eng. 2022, 45, e14010.
- Fernando, S. Pulse protein ingredient modification. J. Sci. Food Agric. 2022, 102, 892–897.
- Arteaga, V.G.; Demand, V.; Kern, K.; Strube, A.; Szardenings, M.; Muranyi, I.; Eisner, P.; Schweiggert-Weisz, U. Enzymatic Hydrolysis and Fermentation of Pea Protein Isolate and Its Effects on Antigenic Proteins, Functional Properties, and Sensory Profile. Foods 2022, 11, 118.
- Arteaga, V.G.; Guardia, M.A.; Muranyi, I.; Eisner, P.; Schweiggert-Weisz, U. Effect of enzymatic hydrolysis on molecular weight distribution, techno- functional properties and sensory perception of pea protein isolates. Innov. Food Sci. Emerg. Technol. 2020, 65, 102449.
- Shuai, X.X.; Gao, L.Z.; Geng, Q.; Li, T.; He, X.M.; Chen, J.; Liu, C.M.; Dai, T.T. Effects of Moderate Enzymatic Hydrolysis on Structure and Functional Properties of Pea Protein. Foods 2022, 11, 2368.
- Shen, Y.; Hong, S.; Li, Y. Pea protein composition, functionality, modification, and food applications: A review. Adv. Food Nutr. Res. 2022, 101, 71–127.
- Sun, X.D.; Arntfield, S.D. Gelation properties of salt-extracted pea protein isolate catalyzed by microbial transglutaminase cross-linking. Food Hydrocoll. 2011, 25, 25–31.
More