Your browser does not fully support modern features. Please upgrade for a smoother experience.
Please note this is a comparison between Version 3 by Lindsay Dong and Version 2 by Lindsay Dong.
C is a valuable and versatile tool used in the classification of HF; these tests characterize the dynamic interactions between the cardiovascular, respiratory, and metabolic systems during physical exertion. This testing involves the systematic measurement of respiratory gases, heart rate, and other physiological parameters during controlled exercise. This non-invasive assessment provides a comprehensive evaluation of exercise capacity and helps identify abnormalities in cardiopulmonary function that may not be apparent at rest.
- heart failure
- cardiopulmonary exercise testing
- prognosis
- treatment
1. Cardiopulmonary Exercise Testing
Cardiopulmonary exercise testing is a diagnostic tool used to measure cardiovascular and pulmonary function during exercise. It provides information about an individual’s exercise capacity, fitness, cardiovascular function, and pulmonary function. By interpreting its parameters, it is possible to evaluate and diagnose cardiovascular diseases, pulmonary disorders, and metabolic abnormalities. Dyspnea and fatigue are symptoms that could be present in cardiovascular conditions, such as heart failure (HF); however, other pulmonary conditions and even deconditioning can present with dyspnea and fatigue. Cardiopulmonary testing is a valuable tool that can help in the diagnosis and in medical decisions needed in the management of patients with HF [1][2].
Testing Protocols in Heart Failure
Exercise tolerance is usually determined with a treadmill or cycle ergometer; cardiopulmonary exercise testing (CPET) is a more comprehensive and specialized type of exercise testing that provides an accurate and objective measure of cardiorespiratory function. In general, a CPET report has four divisions: the first part, called metabolics, includes oxygen uptake ( O2), carbon dioxide excretion ( CO2), and respiratory exchange ratio (RER); the second part, called cardiac, includes heart rate and systolic and diastolic blood pressure; the third part, called ventilation, includes minute ventilation, respiratory rate, and dead space ventilation; the fourth part, called gas exchange, includes FiO2, SpO2, pH, PaCO2, PaO2, arterial–alveolar oxygen difference pressure, and lactate levels [3][4]. Therefore, CPET provides invaluable diagnostic and prognostic information about clinical disorders associated with exercise intolerance.
Cardiopulmonary exercise testing can be performed using either incremental or constant work rate protocols, defined by whether the work rate progressively increases or remains constant during the test. The main objective of incremental tests is to maximally stress O2 transport and uptake, and these tests are often used in clinical medicine. Ramp protocols are preferred over conventional incremental tests whenever possible. Several ramp grades are commonly used in patients, and these include 5 Watts/min, 7 Watts/min, 10 Watts/min, and 15 Watts/min. The choice of ramp protocol steepness should be based on the patient’s expected exercise tolerance, and the test should last between 8 and 12 min. Two advantages of ramp protocols are important considerations: first, the work rate increase does not have a brisk step increase used in step protocols (e.g., 25 Watts every 3 min); second, the trends in parameters during the test are not affected by protocol steps, making physiological responses linear and easier to interpret [4][5][6][7][8].
2. Cardiovascular and Respiratory Responses to Exercise
During prolonged exercise, there is an increase in the oxygen requirement to meet metabolic demands. To provide more oxygen to the peripheral tissue during exercise, the cardiovascular system adapts by increasing systolic blood pressure, reducing systemic vascular resistance, increasing blood supply to the muscles, and increasing venous return to the heart, facilitated by the squeezing effect of the calf muscles. Cardiac output increases because of increases in both heart rate (HR) and stroke volume (SV). At the same time, there is an increase in minute ventilation in response to exercise with increases in both tidal volume (VT) and respiratory rate, driven by carbon dioxide (CO2) production. The results of CPET can be illustrated with a nine-plot panel (Figure 1).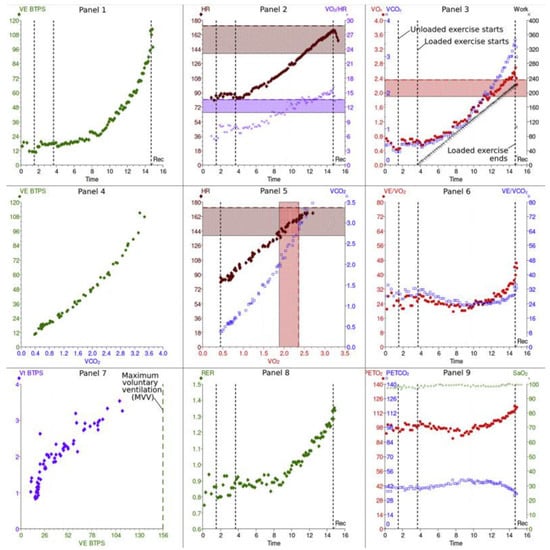
Figure 1. Cardiopulmonary exercise results: 9 panels.
These panels illustrate the information collected during cardiopulmonary exercise testing. Please see the text for more discussion of the information in each panel. This figure is reproduced from Chambers and Wisely, based on the STM Permissions Guidelines in which Elsevier participates. Chambers D, Wisely N. Cardiopulmonary exercise testing—a beginner’s guide to the nine-panel plot [9].
Abbreviations: Panel 2, 5: HR—heart rate; SV—stroke volume; Panel 7: VT—tidal volume; CO2—carbon dioxide; Panel 2, 3, 6: O2—oxygen uptake; Panel 3, 5, 6: CO2—CO2 production; Panel 3: WR—work rate; AT—anaerobic threshold; Panel 1, 4: E—minute ventilation; V/Q—ventilation/perfusion ratio; EqO2—oxygen ventilatory equivalent; EqCO2—CO2 ventilatory equivalent; Panel 9: PETO2—end-tidal pressure of O2; PETCO2—end-tidal pressure of CO2; Panel 7: MVV—maximum voluntary ventilation; FEV1—forced expiratory volume in 1 s; Panel 8: RER—respiratory exchange ratio; BF—breathing frequency.
2.1. Cardiovascular Panels
Panel 3: O2 uptake ( O2) and CO2 output ( CO2) vs. time plus relationship of peak O2 and work rate (WR).
Peak O2 indicates peak exercise capacity and oxygen uptake at the end of an incremental exercise test; it depends on patient effort. An increase in Δ O2/ΔWR provides information about aerobic exercise capacity. Under normal conditions, a person should achieve more than 80% of the predicted work measured in Watts and is expected to have a linear increase in the O2/WR at a rate of 10 mL/min per Watt [9][10][11]. During exercise, a lower ratio suggests less oxygen delivery and increased anaerobic metabolism. This can happen with peripheral artery, cardiovascular, pulmonary vascular, and lung diseases [12][13].
Panel 2: Heart rate and oxygen pulse in relation to time. The O2 pulse ( O2/HR) represents the volume of oxygen extracted by the tissues per heartbeat. The maximum heart rate during exercise can be estimated with this equation: predicted maximum = 220 beats per min—age [9]
Panel 5: Relationship of CO2 output and O2 uptake and the relationship between HR and O2. The key variable determined in this panel is the anaerobic threshold (AT) during exercise, which is the point at which the O2 demand of the muscles surpasses the cardiopulmonary system’s O2 supply capacity. Consequently, skeletal muscle cells generate ATP through anaerobic metabolism, producing lactic acid, which is buffered by bicarbonates, generating excess CO2. The AT corresponds to the point at which CO2 increases disproportionately when compared with O2 in Panel 5, or the point at which E/ O2 starts to increase, whereas E/ CO2 stays comparatively constant, as shown in Panel 6 [9].
2.2. Pulmonary Gas Exchange Panels
Panel 6: The minute ventilation ( E) vs. O2 and vs. CO2 (ventilatory equivalents). Adequate gas exchange is measured by the ventilatory equivalents: EqO2 ≈ E/ O2 and EqCO2 ≈ E/ CO2. In other words, this measures how many liters of minute ventilation are needed to take up 1 L of O2 or exhale 1 L of CO2. The lower these ratios are, the better the gas exchange and breathing effort are, and vice versa [11].
Panel 4: The relationship of E and CO2. The E/ CO2 slope is another key variable of CPET, because it predicts cardiac-related morbidity and mortality in patients with congestive HF and is an independent predictor of perioperative morbidity post-cardiac transplant surgeries [13][14].
Panel 9: End-tidal pressures of O2 (PETO2) and CO2 (PETCO2) vs. time reflect pulmonary gas exchange and ventilation/perfusion mismatch. The more efficient the ventilation, the higher the PETCO2 and the lower the PETO2 in normal lungs. Of note, PETCO2 is greater than PaCO2 during exercise and lower than PaCO2 at rest [11].
2.3. Ventilatory Response Panels
Panel 1: Relationship between E and WR vs. time. The maximum voluntary ventilation (MVV) is calculated indirectly as forced expiratory volume in 1 s (FEV1) × 40 or can be determined by direct measurement of MVV. Exercise is usually not limited by respiratory function but rather by heart rate in normal subjects.
Panel 8: Respiratory exchange rate (RER). The RER describes the ratio of CO2 production to O2 uptake ( CO2/ O2); the normal ratio at rest should be 0.7 to 1. The RER is considered a key variable in patients with chronic HF because higher RERs are associated with worse outcomes, including all-cause mortality and hospital re-admission due to HF exacerbations. The RER is also a prognostic predictor of an AT point, which is helpful in patients who cannot achieve peak O2 because of either musculoskeletal, cardiovascular, or lung diseases [15].
Panel 7: Breathing pattern. Relationships of tidal volume (VT), minute ventilation ( E), and breathing frequency (BF). In obstructive lung diseases, Vt increases, and BF is limited due to prolonged expiratory time. This pattern results in slow, deep breathing. However, in restrictive lung diseases, breathing is shallow and fast because the Vt is limited, secondary to reduced lung volumes, but the BF increases [11].
3. Exercise Parameters of Increased Importance in CHF Patients
Cardiac output is usually normal at rest in patients with mild HF, but it does not increase with physical activity [16]. The peak O2 in HF is directly related to peak cardiac output and perfusion of exercising muscles. The failure to increase cardiac output decreases perfusion to these muscles and can cause anaerobic metabolism at lower workloads and muscle fatigue. Cardiopulmonary exercise testing provides an important and objective method for determining the functional capacity of patients with CHF. There are several variables in addition to O2 that have prognostic implications in HF that can only be measured using the CPET. During CPET, peak O2 and the E/ CO2 slope during exercise are important parameters used to measure functional capacity and have prognostic value.3.1. E/CO2 Slope
In chronic HF, minute ventilation ( E) for a given level of carbon dioxide production ( CO2) might be abnormally high during exercise due to increased dead space ventilation, decreased lung compliance, increased chemo- and metabolic reflex sensitivity, early metabolic acidosis, and abnormal pulmonary hemodynamics. The relationship between E and CO2, in L/min, represents the matching of ventilation and perfusion within the pulmonary system, and a ratio < 30 is considered normal. The explanation for this analysis is that higher ratios indicate that a higher minute ventilation is needed to excrete CO2, which reflects inefficiency in the system. The E/ CO2 slope is a continuous variable that predicted major cardiac events in a study with 448 patients with chronic HF (both HFrEF and HFpEF); a very poor prognosis occurred in patients with a slope ≥45 [17].3.2. Peak O2
This parameter is considered as a universal prognostic marker. The O2 is the amount of oxygen being used by the tissues per minute, and the peak O2 represents the O2 at the peak of exercise. There are three measured units in CPET reports: the absolute peak O2 is measured in mL O2/min, the relative peak O2 in mL O2/kg/min/, or the predicted peak O2 in %, based on the study by Neder et al., which used anthropometric characteristics to create predicted peak O2 tables [18].3.3. Respiratory Equivalent Ratio (RER) and Anaerobic Threshold
Defined as the CO2/ O2 ratio, a normal RER value is usually between 0.7 and 1.0, with a low level (0.7) indicating fat metabolism and a high level (1.0) indicating carbohydrate metabolism, and ratios in between indicating mixed fuel consumption. As exercise increases to higher intensities, CO2 exceeds O2, increasing the ratio. Currently, this ratio is the best non-invasive indicator of exercise effort, and a peak value ≥1.10 is considered an excellent exercise effort [19]. The principle behind this analysis is based on the classic pathways of aerobic and anaerobic glycolysis in which the CO2 produced during the anaerobic glycolysis is higher than in aerobic metabolism, reflecting a less-efficient system of producing energy. The anaerobic threshold represents the point of exercise at which the CO2 increases exponentially relative to the O2.3.4. Partial Pressure of End-Tidal Carbon Dioxide (PETCO2) in mmHg at Rest and during Exercise
The end-tidal carbon dioxide level reflects the matching of ventilation and perfusion in the pulmonary and cardiac systems. Therefore, it reflects disease severity in a number of clinical disorders, including HF, pulmonary hypertension, COPD, and interstitial lung disease.3.5. Exercise Oscillatory Ventilation
Periodic breathing is a form of irregular breathing characterized by a regular cyclic variation in ventilation with increases and decreases in tidal volume interrupted by pauses with a cycle length of approximately 1 min. Periodic breathing, or Cheyne and Stokes respiration in the resting state, has been recognized as a characteristic of HF for over 200 years. This breathing pattern can also occur during exercise and is called exercise oscillatory ventilation (EOV). This develops in a significant percentage of HF patients [19].4. Protocols and Graded Exercise Testing
Different exercise testing protocols have been described in the literature. This equipment, including both cycle ergometers and treadmills, can measure the O2 max, CO2, and E. Generic types of protocols include progressive, incremental, and multistage (every 3 min, with a “pseudo” steady-state metabolic level at each stage) protocols [20]. In clinical practice, maximal incremental protocols are often used. Changes in O2, CO2, and E often lag behind changes in work rate. Therefore, the preferred protocol should increase the work rate at a constant rate.4.1. Important Exercise Protocol Characteristics
Exercise time should be maintained between 6 and 12 min, which is probably the optimal time to obtain efficient and useful metabolic and functional information. Both ergometer and treadmill protocols should be preceded by an initial warm-up phase at 0 Watts for 1–3 min and should include a recovery phase of at least 5 min with a tapering workload.4.2. Gas Analysis Systems
Respiratory gas exchange measurement is a crucial part of the CPET technique; maximal oxygen uptake and anaerobic threshold determination serve as indices of exercise capacity that can be applied to various clinical problems, such as differential diagnosis of exertional dyspnea and fatigue, in which maximal oxygen uptake and anaerobic threshold determination are combined with a simultaneous assessment of circulatory and ventilatory reserves. Arterial blood gas determination can be used to define ventilation–perfusion relationships. During exercise, both components of the Fick equation (cardiac output [CO] and arteriovenous O2 difference [(A-V) O2]) should increase; the O2 max is the maximum amount of O2 that can be used for metabolic work for a given form of exercise and is related to the maximum CO and (A-V) O2 that can be attained [21].5. Interpretation of CPET Parameters
5.1. Target Exercise Load for CPET
The most important benefit of the use of a bike ergometer instead of a treadmill is the linear increase in workload. With a treadmill, it is possible to change slope and speed, but not the workload itself, and therefore it is almost impossible to generate a linear increase in workload that provides an accurate objective measurement of the O2/work rate relationship. The exercise ramp protocol should have an exercise duration of ~10 min with an interval ranging from 8 to 12 min [22]. This means that the workload should be adjusted for each patient to achieve this test duration.5.2. Exercise Limits in Uncomplicated Medical Disorders
Cardiac disorders: Patients with cardiac disorders usually meet their exercise limit when they reach their predicted maximum heart rate. This typically occurs at a lower work level and lower O2 max. They often cross an anaerobic threshold at a lower work rate, and they have higher E/ CO2 slopes. Pulmonary disorders: These patients reach their maximum exercise capacity when they reach their ventilatory limit. The respiratory pattern includes higher respiratory rates and lower tidal volumes that do not increase during exercise. They may desaturate during exercise. Muscular disorders: These patients often stop exercise because of muscle fatigue and have not reached either a cardiac or respiratory limit. Depending on the exact metabolic abnormality in these muscles, these patients may or may not have increased anaerobic metabolism.6. Risk Stratification in HF Using CPET
6.1. Prognostic Value of CPET Parameters
Careful measurement of ventilation and O2 uptake patterns in HF can quantify disease severity and prognosis. Cardiopulmonary exercise testing is routinely used in the prognostic evaluation of patients with HF with reduced ejection fractions (HFrEF), especially when advanced therapies are considered. The first study evaluating the prognostic utility of CPET parameters dates back to 1991, when Mancini et al. published their groundbreaking work on the predictive value of peak O2, and established a peak O2 cutoff of <14 mL/kg/min as a criterion for which 1-year survival was significantly lower (47%) than survival with transplantation (70%) [23]. In contrast, individuals with a peak O2 > 14 mL/kg/min had a higher (95%) 1-year survival, suggesting that cardiac transplantation could be safely deferred in ambulatory patients with severe left ventricular dysfunction and a peak exercise O2 of more than 14 mL/kg/min. Following these results, studies have focused on ventilatory efficiency during CPET, expressed as the minute ventilation per carbon dioxide production ( E/ CO2) slope, and have demonstrated that it is a robust prognostic marker in patients with HFrEF [24][25][26][27]. Risk predictions of hospitalization and/or death is important for both patients and physicians. For patients, this information can help them understand the severity of their illness and thereby guide patients in decision making, including preferences for advanced HF therapies and/or end-of-life care. For physicians, these predictions provide guidance toward which treatment to offer patients, and when to offer treatment. Interpretation of cardiopulmonary exercise testing in the individual patient should start with an assessment of whether maximal effort was achieved or not, as indicated by RER [25]. A RER >1.0 to 1.1 indicates maximal patient physiological effort. A heart rate >85% of predict also correlates with maximum physiological effort but is often not achieved in patients on beta blockers and/or with chronotropic incompetence.6.2. CPET Studies in Patients with Heart Failure with Preserved Ejection Fractions
Nadruz et al. studied the clinical characteristics, CPET results, and outcomes in 195 patients with heart failure with preserved ejection fractions (>50%), 144 patients with heart failure with mid-range ejection fractions (40–49%), and 630 heart failure patients with reduced ejection fractions (<40%) [28]. There were significant differences in the clinical characteristics among these three groups. Ho et al. analyzed clinical information, exercise testing results, and outcomes in 461 patients with left ventricular ejection fractions ≥50% and New York Heart Association Class II–IV symptoms [29][30]. These patients frequently had comorbid diseases, including hypertension, obesity, diabetes, and atrial fibrillation. The patients were placed in separate categories using criteria established by the American College of Cardiology/American Heart Association (ACC/AHA), the European Society of Cardiology (ESC), and the Heart Failure Society of America (HFSA). The use of three different criteria resulted in significant differences in the number of patients classified as HFpEF. The peak O2 max ranged from 16.2 ± 5.2 mL/kg/min in patients classified by ACC/AHA criteria to 12.7 ± 3.1 mL/kg/min in those classified by HFCA criteria. Patients in all three classification groups had elevated E/ CO2 slopes.7. Cardiopulmonary Exercise Testing and Drug Trials
When patients are classified according to their peak O2, patients with a peak O2 less than 12 mL/kg/min had a reduced diffusion capacity, a reduced membrane component of diffusion, a reduced vital capacity, and a reduced alveolar volume. This indicates that pulmonary function tests can identify important changes in pulmonary function in patients with chronic HF and potentially help explain changes in their exercise capacity [30][31]. Patients treated with angiotensin-converting enzyme (ACE) inhibitors have a significant increase in lung diffusion, exercise tolerance, and peak O2, a decrease in peak dead space/tidal volume ratio, and a decrease in the E/ CO2 slope. Studies with carvedilol indicate that it does not affect pulmonary mechanics or exercise capacity. Neither peak workload nor O2 improved with the drug. However, quality-of-life scores did improve, and there were reduced ventilatory responses to exercise, demonstrated by a decrease in the E/ CO2 slope. Patients on carvedilol had a significant decrease in diffusion capacity, which was explained by a reduction in membrane conductance. The diffusion capacity on carvedilol was significantly lower than the diffusion capacity in patients treated with bisoprolol or nebivolol.8. Biomarkers, Cardiopulmonary Exercise Testing, and Cardiac Rehabilitation
Kruger et al. prospectively studied 70 patients with chronic HF who underwent symptom-limited bicycle exercise testing [32]. The mean age of these patients was 60.3 ± 10.4; the mean ejection fraction was 26.4 ± 6.0%. There was a significant negative correlation between BNP concentration and peak O2, O2 at the anaerobic threshold, the relationship between minute ventilation and CO2 production, the number of Watts reached during exercise, and the left ventricular ejection fraction. BNP levels could discriminate between patients who had a peak O2 less than 10 mL/kg/min or a peak O2 less than 14 mL/kg/min. These authors suggest that BNP may be an effective way to monitor therapy and exercise programs in patients with HF. MicroRNA (miRNAs) are non-coding RNAs that help regulate gene expression by inhibiting transcription. The interaction of miRNAs with their target genes depends on the intracellular location of miRNAs, the concentration of the miRNAs and target mRNAs, and the degree of binding of the miRNA to mRNA. These microRNA levels have been studied in patients with chronic HF participating in cardiac rehabilitation. Witvrouwen et al. compared plasma miRNA levels in 25 patients with heart failure enrolled in a 15-week combined aerobic and strength exercise program with 21 sedentary males to determine the effect of exercise [33]. These investigators measured miR-23a, miR-140, miR-146a, miR-191, and miR-210 levels, which are associated with pathways relevant to exercise adaptation, in both patient groups. In HF patients with reduced ejection fractions, capillary density in skeletal muscle is reduced. Both miR-23 and miR-146a stimulate angiogenesis; therefore, reduced miR-23a and miR-146A levels after 15 weeks of training may reflect increased capillary density and a reduced need for angiogenesis. In addition, HF patients with reduced ejection fractions and reduced physical activity levels often have skeletal muscle wasting, and this contributes to fatigue during daily activities and reduces O2 peak during CPET. Both miR-23 and miR146a limit skeletal muscle atrophy by inhibiting the ubiquitin–proteasome pathway and Wnt family member 11 expression, and increased levels of these miRNAs suggest that the patient is having adaptive responses in skeletal muscle to prevent wasting. In conclusion, exercise effects the levels of miRNAs involved in pathways related to exercise adaptation, which may help improve skeletal muscle and the angiogenic response to exercise in HFrEF patients. The study also demonstrates that measuring miRNAs may help classify patients into phenotypes, monitor responses to treatment, especially exercise rehabilitation, and possibly understand the pathogenesis of muscle dysfunction in HF patients [33][34][35][36].References
- De Souza, I.M.A.; Da Silveira, A.D.; Stein, R.; Ramos, J.S.P.; Ribeiro, R.S.; Pazelli, A.M.; De Oliveira, Q.B.; Darze, E.S.; Ritt, L.F. Independent and additional value of cardiopulmonary exercise test to the New York Heart Association classification in heart failure. J. Am. Coll. Cardiol. 2022, 79, 1440.
- Popovic, D.; Guazzi, M.; Jakovljevic, D.G.; Lasica, R.; Banovic, M.; Ostojic, M.; Arena, R. Quantification of coronary artery disease using different modalities of cardiopulmonary exercise testing. Int. J. Cardiol. 2019, 285, 11–13.
- Guazzi, M.; Labate, V.; Cahalin, L.P.; Arena, R. Cardiopulmonary exercise testing reflects similar pathophysiology and disease severity in heart failure patients with reduced and preserved ejection fraction. Eur. J. Prev. Cardiol. 2014, 21, 847–854.
- Lockwood, P.A.; Yoder, J.E.; Deuster, P.A. Comparison and cross-validation of cycle ergometry estimates of V ˙ O2 max. Med. Sci. Sports Exerc. 1997, 29, 1513–1520.
- Mackie, M.Z.; Iannetta, D.; Keir, D.A.; Murias, J.M. Evaluation of the “Step-Ramp-Step” Protocol: Accurate Aerobic Exercise Prescription with Different Steps and Ramp Slopes. Med. Sci. Sports Exerc. 2023.
- Stickland, M.K.; Neder, J.A.; Guenette, J.A.; O’donnell, D.E.; Jensen, D. Using Cardiopulmonary Exercise Testing to Understand Dyspnea and Exercise Intolerance in Respiratory Disease. Chest 2022, 161, 1505–1516.
- Pearson, R.C.; A Garcia, S.; Jenkins, N.T. Comparison of a Ramp Cycle Ergometer and a Staged Assault Fitness AssaultBike Protocol for the Assessment of V ˙ O. Int. J. Exerc. Sci. 2023, 16, 613–619.
- American Thoracic Society. ATS/ACCP Statement on cardiopulmonary exercise testing. Am. J. Respir Crit. Care Med. 2003, 167, 211–277.
- Chambers, D.; Wisely, N. Cardiopulmonary exercise testing—A beginner’s guide to the nine-panel plot. BJA Educ. 2019, 19, 158.
- Guazzi, M.; Bandera, F.; Ozemek, C.; Systrom, D.; Arena, R. Cardiopulmonary Exercise Testing: What Is its Value? J. Am. Coll. Cardiol. 2017, 70, 1618–1636.
- Glaab, T.; Taube, C. Practical guide to cardiopulmonary exercise testing in adults. Respir. Res. 2022, 23, 1–12.
- Guazzi, M.; Adams, V.; Conraads, V.; Halle, M.; Mezzani, A.; Vanhees, L.; Arena, R.; Fletcher, G.F.; Forman, D.E.; Kitzman, D.W.; et al. Clinical recommendations for cardiopulmonary exercise testing data assessment in specific patient populations. Circulation 2012, 126, 2261–2274.
- Shen, Y.; Zhang, X.; Ma, W.; Song, H.; Gong, Z.; Wang, Q.; Che, L.; Xu, W.; Jiang, J.; Xu, J.; et al. V ˙ E/ V ˙ CO2 slope and its prognostic value in patients with chronic heart failure. Exp. Ther. Med. 2015, 9, 1407–1412.
- Jayasimhan, D.; Welch, R.; Ellyett, K.; Pasley, T.; Kolbe, J. The Ventilatory Equivalent for Carbon Dioxide Slope Independently Predicts Perioperative Outcomes in Patients Undergoing Heart Transplantation. J. Heart Lung Transplant. 2022, 41, S428–S429.
- Kakutani, N.; Fukushima, A.; Yokota, T.; Katayama, T.; Nambu, H.; Shirakawa, R.; Maekawa, S.; Abe, T.; Takada, S.; Furihata, T.; et al. Impact of high respiratory exchange ratio during submaximal exercise on adverse clinical outcome in heart failure. Circ. J. 2018, 82, 2753–2760.
- Reddy, H.K.; Weber, K.T.; Janicki, J.S.; McElroy, P.A. Hemodynamic, ventilatory and metabolic effects of light isometric exercise in patients with chronic heart failure. J. Am. Coll. Cardiol. 1988, 12, 353–358.
- Battaglini, D.; Al-Husinat, L.; Normando, A.G.; Leme, A.P.; Franchini, K.; Morales, M.; Pelosi, P.; Rocco, P.R. Personalized medicine using omics approaches in acute respiratory distress syndrome to identify biological phenotypes. Respir. Res. 2022, 23, 318.
- Neder, J.; Nery, L.; Castelo, A.; Andreoni, S.; Lerario, M.; Sachs, A.; Silva, A.; Whipp, B. Prediction of metabolic and cardiopulmonary responses to maximum cycle ergometry: A randomised study. Eur. Respir. J. 1999, 14, 1304–1313.
- Balady, G.J.; Arena, R.; Sietsema, K.; Myers, J.; Coke, L.; Fletcher, G.F.; Forman, D.; Franklin, B.; Guazzi, M.; Gulati, M.; et al. Clinician’s Guide to cardiopulmonary exercise testing in adults: A scientific statement from the American Heart Association. Circulation 2010, 122, 191–225.
- Task Force of the Italian Working Group on Cardiac Rehabilitation Prevention; Working Group on Cardiac Rehabilitation and Exercise Physiology of the European Society of Cardiology; Piepoli, M.F.; Corrà, U.; Agostoni, P.G.; Belardinelli, R.; Cohen-Solal, A.; Hambrecht, R.; Vanhees, L. Statement on cardiopulmonary exercise testing in chronic heart failure due to left ventricular dysfunction: Recommendations for performance and interpretation. Part I: Definition of cardiopulmonary exercise testing parameters for appropriate use in chronic heart failure. Eur. J. Cardiovasc. Prev. Rehabil. 2006, 13, 150–164.
- Neuberg, G.W.; Miller, A.B.; O’Connor, C.M.; Belkin, R.N.; Carson, P.E.; Cropp, A.B.; Frid, D.J.; Nye, R.G.; Pressler, M.L.; Wertheimer, J.H.; et al. Diuretic resistance predicts mortality in patients with advanced heart failure. Am. Heart J. 2002, 144, 31–38.
- Abidov, A.; Rozanski, A.; Hachamovitch, R.; Hayes, S.W.; Aboul-Enein, F.; Cohen, I.; Friedman, J.D.; Germano, G.; Berman, D.S. Prognostic significance of dyspnea in patients referred for cardiac stress testing. N. Engl. J. Med. 2005, 353, 1889–1898.
- Mancini, D.M.; Eisen, H.; Kussmaul, W.; Mull, R.; Edmunds, L.H., Jr.; Wilson, J.R. Value of peak exercise oxygen consumption for optimal timing of cardiac transplantation in ambulatory patients with heart failure. Circulation 1991, 83, 778–786.
- Arena, R.; Guazzi, M.; Cahalin, L.P.; Myers, J. Revisiting cardiopulmonary exercise testing applications in heart failure: Aligning evidence with clinical practice. Exerc. Sport Sci. Rev. 2014, 42, 153–160.
- Malhotra, R.; Bakken, K.; D’elia, E.; Lewis, G.D. Cardiopulmonary Exercise Testing in Heart Failure. JACC Heart Fail. 2016, 4, 607–616.
- Lewis, G.D.; Zlotoff, D.A. Cardiopulmonary Exercise Testing-Based Risk Stratification in the Modern Era of Advanced Heart Failure Management. JACC Heart Fail. 2021, 9, 237–240.
- Lala, A.; Shah, K.B.; Lanfear, D.E.; Thibodeau, J.T.; Palardy, M.; Ambardekar, A.V.; McNamara, D.M.; Taddei-Peters, W.C.; Baldwin, J.T.; Jeffries, N.; et al. Predictive Value of Cardiopulmonary Exercise Testing Parameters in Ambulatory Advanced Heart Failure. JACC Heart Fail. 2021, 9, 226–236.
- Nadruz, W.; West, E.; Sengeløv, M.; Santos, M.; Groarke, J.D.; Forman, D.E.; Claggett, B.; Skali, H.; Shah, A.M. Prognostic Value of Cardiopulmonary Exercise Testing in Heart Failure with Reduced, Midrange, and Preserved Ejection Fraction. J. Am. Heart Assoc. 2017, 6, e006000.
- Ho, J.E.; Zern, E.K.; Wooster, L.; Bailey, C.S.; Cunningham, T.; Eisman, A.S.; Hardin, K.M.; Zampierollo, G.A.; Jarolim, P.; Pappagianopoulos, P.P.; et al. Differential Clinical Profiles, Exercise Responses, and Outcomes Associated With Existing HFpEF Definitions. Circulation 2019, 140, 353–365.
- Campodonico, J.; Contini, M.; Alimento, M.; Mapelli, M.; Salvioni, E.; Mattavelli, I.; Bonomi, A.; Agostoni, P. Physiology of exercise and heart failure treatments: Cardiopulmonary exercise testing as a tool for choosing the optimal therapeutic strategy. Eur. J. Prev. Cardiol. 2023, 30 (Suppl. 2), ii54–ii62.
- Contini, M. Cardiopulmonary Exercise Test as a Tool to Choose Therapy in Heart Failure. Ann. Am. Thorac. Soc. 2017, 14 (Suppl. 1), S67–S73.
- Krüger, S.; Graf, J.; Kunz, D.; Stickel, T.; Hanrath, P.; Janssens, U. brain natriuretic peptide levels predict functional capacity in patients with chronic heart failure. J. Am. Coll. Cardiol. 2002, 40, 718–722.
- Gargiulo, P.; Marzano, F.; Salvatore, M.; Basile, C.; Buonocore, D.; Parlati, A.L.M.; Nardi, E.; Asile, G.; Abbate, V.; Colella, A. MicroRNAs: Diagnostic, prognostic and therapeutic role in heart failure—A review. ESC Heart Fail. 2023, 10, 753–761.
- Scrutinio, D.; Guida, P.; Passantino, A. Prognostic Value of 6-Minute Walk Test in Advanced Heart Failure With Reduced Ejection Fraction. Am. J. Cardiol. 2023, 199, 37–43.
- Masoumian Hosseini, M.; Masoumian Hosseini, S.T.; Qayumi, K.; Hosseinzadeh, S.; Sajadi Tabar, S.S. Smartwatches in healthcare medicine: Assistance and monitoring; a scoping review. BMC Med. Inform. Decis. Mak. 2023, 23, 248.
- Michard, F. Toward Smart Monitoring with Phones, Watches, and Wearable Sensors. Anesthesiol. Clin. 2021, 39, 555–564.
More