Your browser does not fully support modern features. Please upgrade for a smoother experience.
Please note this is a comparison between Version 1 by Tin Lai and Version 2 by Catherine Yang.
Artificial intelligence (AI) have facilitated its widespread adoption in primary medical services, addressing the demand–supply imbalance in healthcare. Vision Transformers (ViT) have emerged as state-of-the-art computer vision models, benefiting from self-attention modules. However, compared to traditional machine learning approaches, deep learning models are complex and are often treated as a “black box” that can cause uncertainty regarding how they operate. Explainable artificial intelligence (XAI) refers to methods that explain and interpret machine learning models’ inner workings and how they come to decisions, which is especially important in the medical domain to guide healthcare decision-making processes.
- explainable AI (XAI)
- multi-head attention
- vision transformer
- interpretability in artificial intelligence
1. Introduction
Artificial intelligence (AI) has made significant strides in various domains in recent years, revolutionizing industries and shaping how we approach complex problems. One of AI’s most remarkable applications is in medical imaging [1], where it has brought about unprecedented advancements in automated image analysis, diagnosis, and decision making. Medical images are one of the most common clinical diagnostic methods [2]. These images vary in properties based on the medical diagnosis and specific anatomical locations, like the skin [3][4][5][6][3,4,5,6], chest [3][7][8][9][10][3,7,8,9,10], brain [11][12][11,12], liver [13], and others. Deep learning algorithms have found numerous critical applications in the healthcare domain, ranging from detecting diabetes [14], uses in genomics [15], and applications in mental health support [16]. Among the latest breakthroughs in computer vision models, Vision Transformers (ViT) [17] have emerged by leveraging self-attention mechanisms to achieve state-of-the-art performance in various visual tasks.
As medical professionals increasingly rely on AI-powered systems to aid in diagnosis and treatment planning [18], the need for interpretability and transparency in AI models becomes paramount [19]. Deep learning models, including ViTs, often exhibit highly complex and intricate internal representations, making it challenging for experts to comprehend their decision-making process. The opaque nature of these models raises concerns about their reliability and safety, especially in critical applications such as medical diagnostics, where accurate and trustworthy results are of the utmost importance [20]. Explainable artificial intelligence (XAI) is a burgeoning field that seeks to bridge the gap between the black box nature of AI algorithms and the need for understandable and interpretable decision-making processes [21]. XAI addresses a fundamental challenge: How can we make AI’s decision-making process more transparent and comprehensible to both experts and non-experts? While complex models might achieve impressive accuracy, their inability to provide human-readable explanations hinders their adoption in critical applications such as healthcare, finance, and legal domains. This limitation not only undermines users’ trust but also poses ethical and regulatory concerns. The integration of XAI can also lead to improved collaboration between AI systems and human experts, as well as the identification of novel patterns and insights that might have been overlooked otherwise.
In the realm of XAI, several techniques contribute to enhancing the transparency and trustworthiness of complex machine learning models. Local interpretable model-agnostic explanations (LIMEs) offer insights into any model’s predictions by approximating its behavior with interpretable surrogate models [22]. LIME is model-agnostic, which means it is applicable to most AI models without relying on any specific model architecture. Gradient-based saliency methods, like Grad-CAM, illuminate the model-specific regions of input data that contribute most to predictions, fostering an understanding of where the model focuses its attention [23]. Furthermore, in medical domain, decision understanding is often achieved through interactive dashboards that visualize model outcomes and insights, allowing end users to assess predictions, contributing factors, and uncertainties for informed decision making. These concepts collectively illuminate the intricate inner workings of machine learning models, promoting transparency and user confidence.
2. Explainability Methods in XAI
The importance of interpretability in machine learning models is widely acknowledged, but defining what constitutes interpretability remains a challenge [24][44]. Various definitions have been proposed, emphasizing openness, accuracy, reliability, and understandability [24][25][44,45]. However, these definitions often overlook the user’s perspective, and their needs are not adequately addressed in the produced explanations [26][46]. This is especially relevant in interpretable machine learning systems, where the audience’s understanding and trust in the models are crucial. Interpretability becomes even more critical in medical imaging as it influences clinicians’ decision making and patients’ acceptance of the model’s predictions. Interpretable machine learning systems offer valuable insights into their reasoning, helping users, such as clinicians, comprehend and verify predictions, ensuring fairness and unbiased outcomes for diverse populations. As deep learning algorithms find numerous applications in healthcare, the demand for interpretable models grows, necessitating the establishment of uniform criteria for interpretable ML in this vital domain. The following summarizes explainability methods that are commonly used in the XAI field.2.1. Gradient-Weighted Class Activation Mapping (Grad-CAM) Method
Grad-CAM is a gradient-based interpretability technique introduced by Selvaraju et al. [23] that aims to generate a localization map of the significant regions in an image that contribute the most to the decision made by a neural network. Leveraging the spatial information retained in convolutional layers, Grad-CAM utilizes the gradients propagated to the last convolutional layer to attribute importance values to each network neuron with respect to the final decision. An appealing advantage of Grad-CAM over similar methods is its applicability without requiring re-training or architectural changes, making it readily adaptable to various CNN-based models. Moreover, combined with guided back-propagation through element-wise multiplication, known as Guided Grad-CAM, it enables the generation of high-resolution and class-discriminative visualizations [23].2.1.1. Saliency Maps
Saliency Maps, introduced by Simonyan et al. [27][47], is a gradient-based visualization technique that sheds light on the contribution of individual pixels in an image to its final classification made by a neural network. This method involves a backward pass through the network to calculate the gradients of the loss function with respect to the input’s pixels [28][48]. Doing so reveals the impact of each pixel during the back-propagation step, providing insights into how much each pixel affects the final classification, particularly concerning a specific class of interest. The results from Saliency Maps can be interpreted as another image, either the same size as the input image or easily projectable onto it, highlighting the most important pixels that attribute the image to a specific class [27][47].2.1.2. Concept Activation Vectors (CAVs)
Concept Activation Vectors (CAVs) [29][49] represents an interpretability technique that offers global explanations for neural networks based on user-defined concepts [28][48]. To leverage CAVs, two datasets need to be gathered: one containing instances relevant to the desired concept and the other comprising unrelated images serving as a random reference. For a specific instance, a binary classifier is trained on these two datasets to classify between instances related to the concept of interest and unrelated ones. The CAV is then derived as the coefficient vector of this binary classifier. Testing with CAVs (TCAVs) allows averaging the concept-based contributions from the relevant dataset and comparing them to the contributions from the random dataset regarding the class of interest. Consequently, CAVs establish connections between high-level user-defined concepts and classes, both positively and negatively. This approach is particularly useful in the medical field, where medical specialists can conveniently relate the defined concepts with existing classes without delving into the intricacies of neural networks [29][49].2.1.3. Deep Learning Important Features (DeepLift)
Deep Learning Important Features, commonly known as DeepLift [30][50], is an explainability method capable of determining contribution scores by comparing the difference in neuron activation to a reference behavior. By employing back-propagation, DeepLift quantifies the contribution of each input feature when decomposing the output prediction. By comparing the output difference between the original input and a reference input, DeepLift can assess how much an input deviates from the reference. One of the significant advantages of DeepLift is its ability to overcome issues related to gradient zeroing or discontinuities, making it less susceptible to misleading biases and capable of recognizing dependencies that other methods may overlook. However, carefully considering the reference input and output is essential for achieving meaningful results using DeepLift [30][50].2.1.4. Layer-Wise Relevance Propagation (LRP)
Layer-wise Relevance Propagation (LRP) [31][51] is an explainability technique that provides transparent insights into complex neural network models, even with different input modalities like text, images, and videos. LRP propagates the prediction backward through the model, ensuring that the neurons’ received relevance is equally distributed among the lower layers. The proper set of parameters and LRP rules make achieving high-quality explanations for intricate models feasible.2.1.5. Guided Back-Propagation
Guided back-propagation [32][52] is an explanation method that combines ReLU and deconvolution, wherein at least one of these is applied with masked negative values. By introducing a guidance signal from the higher layer to the typical back-propagation process, guided back-propagation prevents the backward flow of negative gradients, corresponding to the neurons that decrease visualized activation of the higher layer unit. This technique is particularly effective without switching, allowing visualization of a neural network’s intermediate and last layers.3. Vision Transformer for Medical Images
ViTs have proven to be effective in solving a wide range of vision problems, thanks to their capability to capture long-range relationships in data. Unlike CNNs, which rely on the inductive bias of locality within their convolutional layers, vanilla ViTs directly learn these relationships from the data. However, the success of ViTs has also brought challenges in interpreting their decision-making process, mainly due to their long-range reasoning capabilities.3.1. Black Box Methods
TransMed [33][53] is a pioneering work that introduces the use of Vision Transformers (ViTs) for medical image classification. Their architecture, TransMed, combines the strengths of convolutional neural networks (CNNs) for extracting low-level features and ViTs for encoding global context. TransMed focuses on classifying parotid tumors in multi-modal MRI medical images and employs a novel image fusion strategy to effectively capture mutual information from different modalities, yielding competitive results on their privately collected parotid tumor classification dataset. The authors of Lu et al. [34][54] propose a two-stage framework for glioma sub-type classification in brain images. The framework performs contrastive pre-training and then uses a transformer-based sparse attention module for feature aggregation. Their approach demonstrates its effectiveness through ablation studies on the TCGA-NSCLC [35][55] dataset. The authors of Gheflati and Rivaz [36][56] systematically evaluated pure and hybrid pre-trained ViT models for breast cancer classification. Their experiments on two breast ultrasound datasets show that ViT-based models outperform CNNs in classifying images into benign, malignant, and normal categories. Several other works employ hybrid Transformer–CNN architectures for medical image classification in different organs. For instance, Khan and Lee [37][57] propose Gene-Transformer to predict lung cancer subtypes, showcasing its superiority over CNN baselines on the TCGA-NSCLC [35][55] dataset. The authors of Chen et al. [38][58] presents a multi-scale GasHis–Transformer for diagnosing gastric cancer in the stomach, demonstrating strong generalization ability across other histopathological imaging datasets. The authoers of Jiang et al. [39][59] propose a hybrid model combining convolutional and transformer layers for diagnosing acute lymphocytic leukemia, utilizing a symmetric cross-entropy loss function.3.2. Interpretable Vision Transformer
Interpretable vision models aim to reveal the most influential features contributing to a model’s decision. We can visualize the most influential region contributing to ViT’s predictions with methods such as saliency-based techniques and Grad-CAM. Thanks to their interpretability, these models are particularly valuable in building trust among physicians and patients, making them suitable for practical implementation in clinical settings. Table 1 provides a high-level overview of existing state-of-the-art interoperability methods that are specifically designed for transformer models. A naïve method that only visualizes the last attentive block will often be uninformative. In addition, some interoperability methods might be class-agnostic, which means the visualization remains the same for the prediction of all classes (e.g., rollout [40][60]). In contrast, some correlation methods can illustrate different interpretation results for different target classification results (e.g., transformer attribution [41][61]). ViT-based methods can be used for COVID-19 diagnosis [42][62], where the low-level CXR features can be extracted from a pre-trained self-supervised backbone network. SimCLR [43][63] is a popular backbone using contrastive-learning-based model training methods. The backbone network extracts abnormal CXR feature embeddings from the CheXpert dataset [44][64]. The ViT model then uses these embeddings for high-level COVID-19 diagnosis. Extensive experiments on three CXR test datasets from different hospitals show their approach’s superiority over CNN-based models. They also validate the generalization ability of their method and use saliency map visualizations [41][61] for interpretability. Similarly, COVID-ViT [45][65] is another ViT-based model for classifying COVID from non-COVID images in the MIA-COVID19 challenge [46][66]. Their experiments on 3D CT lung images demonstrate the ViT-based approach’s superiority over the DenseNet baseline [47][67] in terms of F1 score. In another work, Mondal et al. [10] introduce xViTCOS for COVID-19 screening from lungs CT and X-ray images (see Figure 12). The xViTCOS model is first pre-trained on ImageNet to learn generic image representations, which is then further fine-tuned on a large chest radiographic dataset. Additionally, xViTCOS employs an explainability-driven saliency-based approach [41][61] with clinically interpretable visualizations to highlight the critical factors in the predictions. The model is experimentally evaluated on the COVID CT-2A dataset [48][68] for chest X-ray, which is effective in identifying abnormal cases.Table 1. Summary table on interoperability approaches for transformer models. Class-specific refers to whether the approach can attribute different attentive scores that are specific to the predicted class (in multi-class predictions). Metrics used to evaluate each methods are pixel accuracy, mean average precision (mAP), mean F1 score (mF1), and mean intersection over union (mIoU).
| Interoperability Method | Class Specific? |
Metrics | Highlights and Summary | |||
|---|---|---|---|---|---|---|
| Pixel Acc. | mAP | mF1 | mIoU | |||
| Raw Attention | 67.87 | 80.24 | 29.44 | 46.37 | Raw attention only consider the attention map of the last block of the transformer architecture | |
| Rollout [40][60] | 73.54 | 84.76 | 43.68 | 55.42 | Rollout assume a linear Combination of tokens and quantify the influence of skip connections with identity mateix | |
| GradCAM [23] | ✓ | 65.91 | 71.60 | 19.42 | 41.30 | Provides a class-specific explanation by adding weights to gradient based feature map |
| Partial LRP [49][69] | 76.31 | 84.67 | 38.82 | 57.95 | Considers the information flow within the network by identifying the most important heads in each encoder layer through relevance propagation | |
| Transformer Attribution [41][61] | ✓ | 76.30 | 85.28 | 41.85 | 58.34 | Combines relevancy and attention-map gradient by regarding the gradient as a weight to the relevance for certain prediction task |
| Generic Attribution [50][70] | ✓ | 79.68 | 85.99 | 40.10 | 61.92 | Generic attribution extends the usage of Transformer attribution to co-attention and self-attention based models with a generic relevancy update rule |
| Token-wise Approx. [51][71] | ✓ | 82.15 | 88.04 | 45.72 | 66.32 | Uses head-wise and token-wise approximations to visualize tokens interaction in the pooled vector with noise-decreasing strategy |
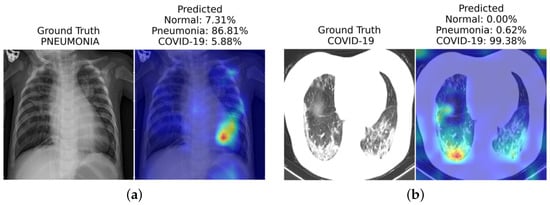
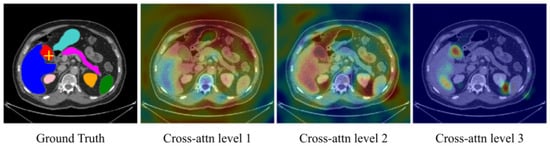
Figure 23. Cross-attention maps with U-Transformer [55][75] for the yellow-crossed pixel (left image). The attention maps at each level highlight the different regions contributing to the segmentation. “Cross-attention Level 1” is an earlier layer focusing on a wide image region. In contrast, we can see that “Cross-attention Level 3”, which is closer to the model output, corresponds to high-resolution feature maps and focuses on more specific regions that explain its predictions.
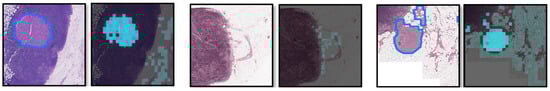
Figure 34. Visualization of the probability derivation output from [58][78] lung cancer region detection. Each pair of images contains (left) ground truth with the tumor regions delineated by blue lines and (right) the probability derivation output. Brighter cyan colors indicate higher probabilities of being tumors for the corresponding locations. We can see that most high cyan region localizes the positive detection regions.