Your browser does not fully support modern features. Please upgrade for a smoother experience.
Please note this is a comparison between Version 1 by Lukas Fahle and Version 5 by Jessie Wu.
Convergence and rockmass failure are significant hazards to personnel and physical assets in underground tunnels, caverns, and mines. Mobile Laser Scanning Systems (MLS) can deliver large volumes of point cloud data at a high frequency and on a large scale.
- mobile laser scanning
- geotechnical monitoring
- octree data structures
- change detection
- statistical inference
1. Introduction
During the excavation and operation of underground openings, such as caverns, tunnels, and mining drifts, the redistribution in their surrounding stress field tends to result in the closure, or so-called convergence, of these openings [1]. Geometric changes in the perimeter of the opening can also result in structural damage and rockmass instabilities. In underground cavern construction and operation, rockmass stability and deformation have been identified as key risks [2][3][4][5][2,3,4,5]. During tunnel excavations, wall deformation monitoring is critical for applications, including subsidence prevention, the New Austrian Tunneling Method (NATM), and observational excavation methods [6]. Deformations can also help predict more severe failures or be used for back analysis and support design refinements [7]. Convergence and rockmass failures, such as fall of ground, are also significant hazards to both personnel and physical assets in underground mines [8][9][10][11][12][13][8,9,10,11,12,13].
In cavern engineering, tunneling, mining, geotechnical monitoring, and ground control measures are implemented to detect and prevent convergence and fall of ground, thus ensuring safety, operational reliability, and economic viability. In large, complex, and dynamically changing underground openings, such as mines, ground fall and convergence hazards are commonly detected through visual inspections by trained mine personnel. In situ convergence monitoring instrumentation, such as extensometers, provides only local, not mine-wide data. Visual inspections or locally installed sensors do not offer mine-wide, accurate, and timely information about ground fall hazards. Additionally, in-person inspections, installation, and maintenance of spot sensors expose personnel to the same hazards they must monitor [14]. Similar limitations and risks apply to visual and spot monitoring in cavern and tunneling domains.
As an alternative, lidar-based Simultaneous Localization and Mapping (SLAM) Mobile Laser Scanning Systems (MLS) can enable frequent, large-scale geotechnical monitoring due to significantly higher data acquisition efficiency than traditional inspections [15][16][17][18][19][20][15,16,17,18,19,20]. MLS can also offer safety benefits by removing operators from hazardous areas, as they can be integrated into autonomous robotic platforms such as quadruped robots or mining equipment [21]. Fahle et al. [22] showed that multi-epoch MLS data could detect geotechnical hazards while achieving data quality with uncertainty on the millimeter-to-centimeter level. MLS in underground mines has potential beyond geotechnical monitoring applications, including mapping and monitoring ground support performance [23], mine ventilation surveying [24], rock fragmentation analysis [25], and the control of autonomous vehicle applications [26].
Without ground surveyed control points, static and mobile laser scanning suffer from drift error, reducing site-level accuracy [22][27][22,27]. SLAM-specific techniques, including loop-closure and SLAM-based scan registration, significantly improve site-level accuracy. The main limitations of current MLS data for large-wide monitoring remain the low target-level precision in unprocessed point clouds compared to static lidar and the need for time-consuming manual processing and analysis. The target-level precision of MLS data is primarily limited by using compact, automotive-grade MLS lidar sensors. The poor usability of MLS data results from the high data volume, in combination with legacy workflows and algorithms. As a result, there is currently no unified and automated method of organizing, processing, and analyzing MLS data for geotechnical change monitoring, impeding practical adoptions in underground mines.
2. Traditional Deformation Analysis and Change Detection
Point cloud change detection and deformation analysis aim to classify and measure geometric differences between two co-registered scan epochs of the same scene [28]. Several studies have investigated deformation analysis methods in circular concrete-lined rail and highway tunnels. They primarily analyze static terrestrial laser scanning (TLS) data using mathematically parameterized geometric shapes like ellipses and rectellipses fitted to 2D cross-sections of point cloud data [7][29][30][31][7,29,30,31]. These global shape-fitting approaches do not perform optimally in mining environments for two main reasons: irregular drift shapes require relatively complex geometric models for parameterization, and irrelevant changes in the drift floor due to the addition or removal of material limit the amount of usable data [31]. These approaches are also not designed to identify discrete, localized failures such as roof fall and rib spalling [32]. While shape-fitting approaches have received attention in research, cloud-to-cloud (C2C) and cloud-to-mesh (C2M) have been some of the first to be employed for change detection in mining operations [33]. C2C provides fast computations but does not account for the directionality of change and is sensitive to point spacing and noise [34][35][34,35]. C2M distances, while providing directionally signed results, require computationally expensive meshing. C2M accuracy is also impacted by the quality of the mesh interpolation relative to the original surface [34]. Multi-scale model-to-model cloud comparison (M3C2) is a local averaging-based change detection method and does not require meshing as it operates directly on the point clouds. It calculates distances along a local normal vector estimated based on each point’s neighborhood of a specified size. M3C2 then projects search cylinders along the normal vectors and calculates the locally averaged change between the two input clouds [36]. M3C2 is the current state-of-the-art in geomorphic point cloud-based change analysis, especially for low-frequency TLS-based rock slope monitoring [37][38][39][40][41][42][43][44][45][46][37,38,39,40,41,42,43,44,45,46]. M3C2 and related methods have only seen limited use in the context of underground applications [31][47][48][31,47,48].
M3C2 change results can be used to identify statistically significant changes by estimating a “Level of Detection” [36], which is often underestimated on natural surfaces and, thereby, causes false negatives [35][44][49][50][35,44,49,50]. Winiwarter et al. [41] supplemented the M3C2 calculation with error propagation and covariance information. Their so-called M3C2-EP method demonstrates a lower level of detection than the original M3C2 implementation when tested on synthetic and field TLS data. Computational performance was not reported in the study. As M3C2-EP utilizes M3C2 with additional steps, its runtime is likely similar to, or higher than, M3C2. The M3C2-EP method requires additional metadata, such as sensor accuracy, alignment information, and scan positions. While M3C2 and its variants are more robust to noise than C2C and C2M, few studies have used it for mine-scale MLS-based change detection. Besides requiring extensive tuning for various data-sensor, application, and environment-dependent parameters, M3C2 and its variants’ main limitations for large-scale, complex, and mine-wide applications are their computational cost and resulting unsuitability for real-time processing.
3. Challenges in Large-Scale Mobile Laser Scanning SystemsS Data Analysis
MLS point cloud data for monitoring are high in volume, frequency, and variety and can be defined as big data. These properties present challenges for conventional data processing methodologies [51], such as the ones for change detection summarized in Table 1. ReseaOurchers' literature review presented studies that described their limitations regarding noise robustness and computational efficiency. In addition, researcherswe believe that their lack of topological structure and their natively non-classification-based change detection approach further limit their adoption for geotechnical monitoring.
C2C, C2M, and M3C2 results do not inherit 3D topological structures, such as information about spatially adjacent points. Instead, they output unstructured point cloud lists, similar to the input data format. The lack of topology makes the automation of 4D spatiotemporal analysis for underground convergence or rockfall challenging. Often time-consuming and error-prone visual interpretation is necessary to uncover regionally connected, time-dependent trends within the data. Additionally, the lack of topological structure makes traditional methods less compatible with advanced applications for autonomous mobile platforms that require topological information to perceive and navigate their environment [26]. Shape-fitting methods can provide some basic abstraction, e.g., by outputting results as individual cross-sections [7]. Spatial clustering can be a post-processing method that provides additional topological context and has been used for rockfall detection [44][52][44,52].
Current point cloud deformation and change detection analysis commonly evaluate change based on a calculated distance between point clouds from different epochs. This distance is often displayed as a continuous variable for individual points using a color scale and legend. While this is sufficient for low-frequency visual analysis of small scenes, it creates challenges for high-frequency, mine-scale monitoring. Some of these are exemplified and illustrated in Figure 1. Due to sensor noise, most points show 0.05 m of change, which likely marks the limit of detection. While filtering these points is trivial, other scenarios are more challenging to solve for easier interpretation. For example, in Figure 1A, points with distances larger than 0.2 m have been colored in grey to help identify missing data between two scan epochs. In Figure 1B, the transition from missing data to available data results in points incorrectly showing up to 20 cm changes. In Figure 1C, where partial coverage between two scans exists, distinguishing real changes from missing data is challenging. Viewing angle ambiguity is another challenge in visual interpretation, especially for large-scale and dense data. In Figure 1D, changes in the drift floor are only visible when data are viewed at an oblique angle and might be false positives, as Walton et al. [31] discussed. A high number of potential false positives in the dataset can obscure true positives in the mine drift roof in Figure 1E.
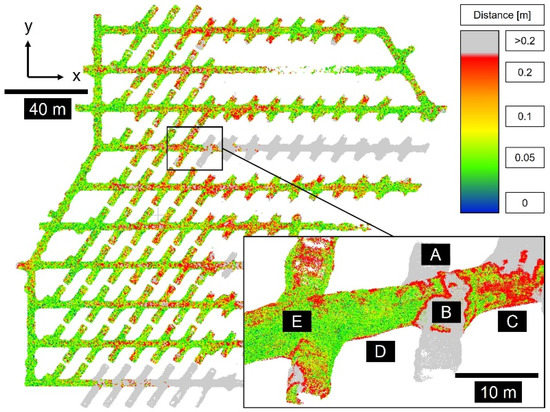
Figure 1. Example of color-coded lidar data of mine-wide changes by absolute distances. (A): Missing data, (B): Transition from missing data to available data, (C): Partial coverage between two scans, (D): Changes in drift floor, (E): Potential false positives in drift roof.
Visual interpretations are subjective, time-consuming, and error-prone and require manual steps to utilize results in business intelligence or automation workflows. For example, many mines utilize so-called Trigger Action Response Plans (TARPs) to manage geotechnical risks [53]. A TARP requires clearly defined alert levels based on real-time monitoring inputs or triggers, e.g., for a specific convergence rate. A classification-based change detection framework could incorporate mine-site-specific triggers and help eliminate delays and errors in the visual interpretation of monitoring data. A more automated, less subjective classification-based approach is desirable to improve the detection and differentiation of geotechnically relevant and significant changes.
Finally, a robust monitoring program must achieve a sufficient limit of detection. Critical convergence magnitudes with a potential negative impact on safety and productivity can be classified from 1–10%, i.e., 0.05 to 0.5 m of wall-to-wall convergence in a 5 m-wide drift [54]. Additionally, rockfall as small as 0.1 m in diameter has been shown to cause fatal injuries in underground mines [55]. For mine-wide monitoring of geotechnical hazards, rwesearchers can assume that a practical limit of detection for convergence should at least be 0.05 m wall-to-wall change and 0.1 m edge-length for rockfall events.
4. Octree-Based Deformation Analysis and Change Detection
Several studies have undertaken underground deformation analysis using static lidar sensors. The previous section showed that MLS-based underground mine scale deformation and change detection provide opportunities to improve traditional approaches. As a core technology in robotic mapping [56], SLAM-based MLS [57], and point cloud data processing [34], voxel-based octree data structures could help solve the challenges traditional change detection methods face with mine-scale MLS data. An octree is a hierarchical data structure that divides 3D space into nodes [58][59][58,59]. Nodes are commonly represented by cubical volumes referred to as voxels. Each voxel can be recursively divided into eight smaller sub-sections until a minimum voxel size or tree depth is reached. The minimum voxel size lmin 𝑙𝑚𝑖𝑛���� determines the octree’s level of detail or resolution, with lower values representing higher resolutions. In robotic and laser-scanning applications, octree resolution is usually determined by available system memory, lidar sensor resolution, and application-specific requirements [56][60][56,60]. Additionally, lower resolutions of an octree can always be generated by performing cuts at any depth of the octree, making them multi-resolution. Lower octree resolution generally increases the speed of computational operations, such as tree-based searches [56]. In practice, 𝑙𝑚𝑖𝑛���� can, therefore, be selected as small as memory availability allows but is usually limited by lidar data resolution and processing speed requirements.
In applications that utilize point cloud data from laser scanners, a voxel is usually initialized by integrating a laser-scan measurement with an x, y, and z location. In this basic form, a voxel encodes a simple Boolean property to describe the occupancy state of its space. Octrees can encode additional information, such as three-dimensional ellipsoids or surfel representations. These can be particularly interesting when processing low-precision MLS data, as they can encode statistical descriptors such as the mean, variance, and covariance of the points in each voxel. These statistics describe sampled surfaces in more detail than a Boolean occupancy property (Figure 2). Voxel and surfels have been used to improve SLAM performance with examples in indoor [61][62][61,62] and larger urban environments [63][64][63,64]. Zlot and Bosse [65] demonstrated the efficiency of ellipsoid-supplemented voxels for large-scale underground mine mapping but did not investigate multi-temporal applications such as ground movement monitoring.
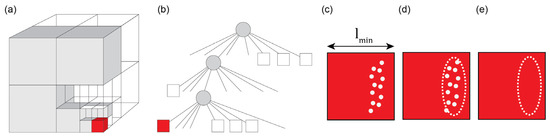
Figure 2. Schematic of a volumetric (a) and tree (b) representation of an octree structure storing Boolean occupancy free (white) and occupied (grey). Example of an occupied voxel of size lmin storing MLS points of a surface (c), a graphical representation of the covariance of the points (d), and the data maintained in ouresearchers' octree (e).
Shortcomings of voxel-based representations include their susceptibility to discretization artifacts created when large, open scenes are not sufficiently observed and a loss in accuracy compared to the original point cloud data [66][67][66,67]. Underground mine environments present fewer discretization challenges due to their confined nature, high MLS sampling rates, and high point cloud density. The loss of accuracy remains a concern, especially in safety-critical monitoring applications. Gehrung et al. [68] address this in urban datasets by supplementing voxels with a local spatial data representation in the form of a three-dimensional Gaussian kernel. In a later version of their method, they detected the appearance and disappearance of objects like pedestrians and cars using a voxel edge length of 0.5 m [69]. Wellhausen et al. [70] presented a voxel-based change detection pipeline using distance computations, thresholding, clustering, and classification. Their approach detected objects larger than 0.5 m in real-time using a voxel edge length of 0.75 m. Gehrung et al.’s [69] and Wellhausen et al.’s [70] implementations of voxel-based change detection showed promising results in urban scenarios and for relatively high magnitudes of changes.
Previous voxel-based change detection work focused on relatively large and discrete changes in urban environments and often used high-accuracy lidar sensors. In contrast to these methods, ouresearchers' proposed approach for underground geotechnical monitoring must handle noisy MLS data and provide a low detection limit, preferably below the MLS sensor-specific range accuracy. Researchers'Our approach must also accurately detect appearing objects characterized by high-magnitude changes in relatively small regions, such as the ones caused by rockfalls and low-magnitude, incremental deformation over larger regions associated with rockmass convergence. Unlike conventional change detection techniques employed in underground applications, researchers'our method needs to produce a robust binary change classification with user-definable risk tolerance and absolute magnitudes of changes. Lastly, researcherswe aim to develop a framework that can be utilized for various underground mining applications that require a highly efficient and customizable data storage and processing platform.