Your browser does not fully support modern features. Please upgrade for a smoother experience.
Please note this is a comparison between Version 1 by Jasjit Suri and Version 2 by Camila Xu.
The ability of UNet-based deep learning models as shown before is very powerful in the imaging domain and can handle image noise, structure, scale, size, resolution, and further, the variability in the shapes.
- coronary artery disease
- intravascular ultrasound
- deep learning
1. Introduction
One of the world’s greatest contributors to mortality and morbidity is cardiovascular disease (CVD), which accounts for about 18 million deaths per year [1]. The primary two causes of CVD-related fatalities are coronary artery disease (CAD) and acute coronary syndrome (ACS) [2]. Generally speaking, CAD entails the shrinking of arteries as a result of the buildup of atherosclerotic plaque within their walls, resulting in coronary artery obstruction [3]. Aiming to enhance the diagnosis and treatment of heart disorders as well as lowering the fatality rate from CVD, significant advancements have been made in cardiovascular research and therapy in recent decades [4]. It is now possible to carry out a comprehensive qualitative and quantitative assessment of heart morphological structures as well as operations with the use of contemporary medical imaging techniques, including intravascular ultrasound (IVUS) [5][6][7][8][9][5,6,7,8,9], computed tomography (CT) [10], magnetic resonance imaging (MRI) [11][12][13][11,12,13], and ultrasound (US) [14][15][14,15], which assist identification, disease monitoring, surgical planning, and evaluation. An example of the coronary artery is shown in Figure 1a, while the IVUS acquisition device for the coronary vascular system is shown in Figure 1b.
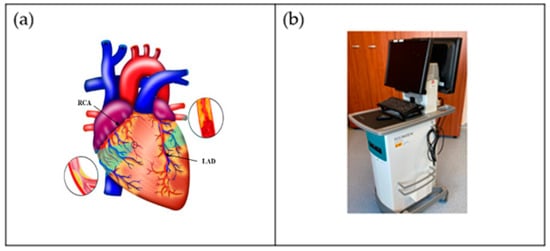
Figure 1. (a) Coronary arteries of the heart showing LAD (left anterior descending coronary artery) and RCA (right coronary artery) (Courtesy of AtheroPoint™, Roseville, CA, USA). (b) IVUS acquisition device (Courtesy of Dr. Alberto Boi and Luca Saba, University of Cagliari, Cagliari, Italy).
The diagnosis of CAD is frequently made by coronary CT angiography (CCTA), which enables non-invasive measurement of the arterial lumen’s diameter and plaque localization [16][17][18][19][20][16,17,18,19,20]. However, radiologists presently manually assess the location and severity of the plaque(s) leading to the stenosis in CCTA pictures, which, in addition to being costly and time-consuming, is also susceptible to mistake and inaccuracy [21]. In order to develop computerized and accurate coronary artery stenosis as well as a plaque identification method, it is crucial that coronary arteries in CCTA pictures must be automatically segmented. The following factors, however, make automatic coronary artery segmentation for CCTA pictures particularly complicated. To begin with, coronary circulation has a complicated pattern, with several arteries of different thicknesses [22]. For perfect segmentation, some of the branches are even too thin. Additionally, individual differences in the structure of the coronary artery tree may be relevant. Second, other vascular organs that seem like the coronary arteries adjacent to the heart can be mistaken for them because of their similar appearance [23]. Third, the coronary arteries only make up a tiny fraction of the entire heart’s cells, and the methods for segmentation must consider this imbalance [24]. Additionally, several variables, including heart rate, the data reconstruction method, the quantity of the injected contrast agent, and radiation exposure, affect the quality of the pictures obtained during CT angiography [25]. Coronary artery segmentation, therefore, is more challenging due to low-resolution image quality.
Figure 1b shows a popular imaging method for the assessment and control of CVD, intravascular ultrasound (IVUS) [5][26][5,26]. In conjunction with positional data, IVUS images are segmented into interior and exterior regions as lumen and media regions, respectively. Arteries’ representation in 3D heavily depends on arterial vessel walls for various purposes such as surgical planning. The arteries’ segmentation is helpful for plaque identification in clinical practices. IVUS-guided percutaneous coronary intervention (PCI) is a more advanced and superior technique in comparison to standard angiography-guided PCI, minimizing death risks in patients [6]. IVUS segmentation for lumen and vessel cross-sectional based on 3D vessel reconstruction is precise and quick for accurate and real-time segmentation during PCI [27]. However, IVUS segmentation requires recent, accurate, and faster techniques, typically at 30 Hz and 100 Hz frame rates. To record an IVUS sequence, a catheter-borne ultrasound transducer is inserted into the coronary artery and then returned via arteries at a speed of roughly 1 mm/s [5]. Raw radio frequency (RF) information from the probe is typically not used for analysis. However, amplified and filtered gray-scale B-mode Euclidean ultrasound pictures showing the coronary cross-section provide a typical output format for downstream evaluation (see Figure 2) The arrows in Figure 2 depict a typical example of five (1–5) frames with calcified plaques. Six patients’ IVUS videos’ worth of frames were collected, and they were placed in a 6 × 5 matrix. The symbol I (1,1)-I (6,5) is used to represent this.
IVUS segmentation is one of the most challenging tasks in medical images. It consists of lumen–intima (LI) and media–adventitia (MA) border detection. This challenge is due to the presence of the artifacts, namely shadows, bifurcation, and echogenic plaques, and the fact that public expert-labeled ground-truth databases only contain a small number of captures [28]. Even though artificial intelligence (AI) has shown promising signs toward higher accuracy and learning strategy, it has been observed that these AI-based black boxes lack clinical validation and the ability to perform well in clinical settings, and they are unable to explain the outcomes [29][30][31][32][33][34][35][29,30,31,32,33,34,35]. The clinical validation requires that the outcome from the AI system must have a behavior leading to correct coronary artery disease risk assessment. For example, should an AI system perform accurately on a test patient who has a high risk, then the syntax score of this patient should be high [36]. Other ways to show the clinical validation include by estimating the relationships or correlations between two quantities such as computed tomography (CT) coronary artery score vs. AI outcome of the risk [37]. Such consistent behavior needs to be exhibited by AI systems. Other than the clinical validation, there are attributes such as imbalanced classes in the datasets that can introduce AI bias [38]. Such causes can lead to bias in AI modules or system designs.
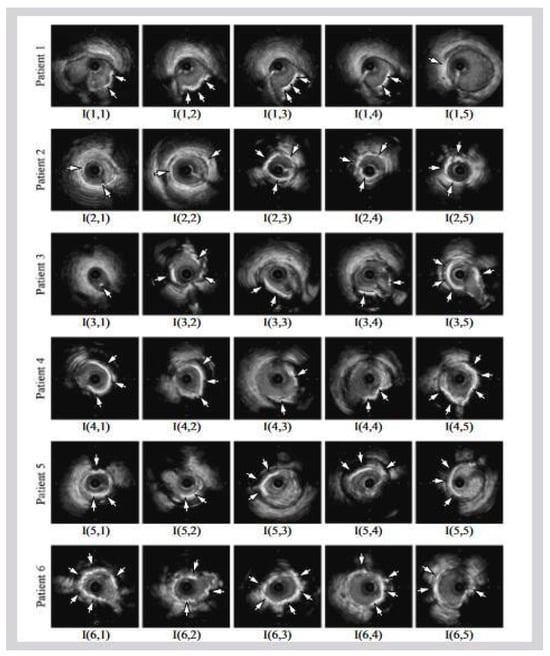
Figure 2. Six patients’ calcified plaques can be seen in sample frames I (1,1) through I (6,5) from the overall intravascular ultrasonography (IVUS) films [39][43].
2. Characteristics of UNet and Conventional DL Systems for CAD
2.1. A Special Note on Limitations of Conventional Models and Benefits of AI-Based Solutions
The conventional models adopted in image processing have existed for the last 50 years [40][41][42][43][44][130,131,132,133,134]. These methods were considered as generation I and II, where the methods were considered as local in nature and never used the cohort’s knowledge for the benefit for prediction on the test datasets. These methods had some inherent drawbacks, such as inability to provide an automated solution towards segmentation of the organs in complex medical images [40][45][46][130,135,136]. These methods were local in nature, and the noise would overwhelming and distract the computer vision algorithms [47][137]. Thus, the system was ad hoc in nature and could not be automated for every new incoming test image [48][138]. Due to these inherent challenges, the performance in these systems dropped considerately and affected the accuracy, sensitivity, specificity, Mathew coefficient, recall, precision, area under the curve, and p-value significance. Further, the statistical tests for evaluating the reliability and stability also did not perform well, which included the t-test, paired t-test, Bonferroni tests, Freedman test, Wilcoxon test, Poisson test, etc. [49][50][51][139,140,141]. The effect of such challenges lacked explainability and interpretations [52][53][41,142]. As a result, time and again, these computer vision methods started losing interest, and over time, inventions based on knowledge derived by the cohorts started to take shape.
With the invention of fundamental neural networks [54][143], these fundamental drawbacks started to disappear. The rapid rise of these methods has nearly dominated the field of image processing, which were then characterized into machine learning and deep learning approaches [55][144]. The most powerful paradigm was the addition of addition of intermediate layers between the input and output layers [56][145]. Deep learning solutions offer the following benefits over the conventional models: automated feature extraction, the power of the integration of knowledge from cohorts for better segmentation and classification solutions, the ability to adjust the depth of layers, the ability to parallelize these neural networks to improve the performance and optimize these deep layers, and the ability to reduce the noise present in the images using dropout layers.
2.2. A Special Note on Quality Control for AI Systems
The size of the cohort, the balancing of the class in the cohort, missing values in the cohort, scaled values of the risk factors, normalization of the factors if any, and augmentation of the raw datasets are all factors that are part of the quality control system during AI design. If the quality control is not conducted in a proper way, then the AI system may lack generalization. In other words, the training system will not be generalized. The cohort size plays a major role. If the cohort size is small, it can also cause overfitting. Thus, dropout layers help in improving the generalization. To further improve the generalization requires hyper-parameter tuning [56][57][145,150].
Table 1 tabulates the general characteristics of the DL system, described by using 26 attributes categorized into 5 clusters, namely demographic (rows A1–A3), architectural details of the deep learning model (rows A4–A10), performance evaluation (rows A11–A20), parameter optimization (rows A21–A25), and clinical evaluation (row A26). The cohort size used in different studies was very limited. The demographic factors considered by most of the studies were cohort size, smoking, and hypertension.
Table 1.
Characteristics of UNet and conventional systems for CAD.
| A1 | A2 | A3 | A4 | A5 | A6 | A7 | A8 | A9 | A10 | A11 | A12 | A13 | ||
|---|---|---|---|---|---|---|---|---|---|---|---|---|---|---|
| SN | Studies | TP | SM | HT | AU | L | EC | DC | SC | LF | PL | DSC | PV | JI |
| 1 | He et al. [58][44] | 2 | - | - | U | 5 | 3 | 3 | √ | √ | √ | √ | - | √ |
| 2 | Jin et al. [59][95] | 5 | - | - | C | - | - | - | - | - | - | - | √ | - |
| 3 | Ibtehaz et al. [60][45] | 1 | - | - | U | 5 | 5 | 5 | √- | √ | √ | - | - | √ |
| 4 | Balakrishna et al. [61][46] | 1 | - | - | U | 5 | 5 | 5 | √ | - | √ | √ | - | √ |
| 5 | Kim et al. [62][48] | 1 | - | - | U | 5 | 5 | 5 | √ | √ | √ | √ | - | √ |
| 6 | Li et al. [63][47] | 1 | - | - | U | 5 | 4 | 4 | √ | √ | √ | √ | - | - |
| 7 | Chen et al. [64][49] | 1 | - | - | U | 5 | 3 | 3 | √ | √ | √ | √ | - | - |
| 8 | Tong et al. [65][50] | 1 | - | - | U | 5 | 3 | 3 | √ | √ | √ | √ | - | - |
| 9 | Morris et al. [66][51] | 1 | - | - | U | 5 | 4 | 4 | √ | √ | √ | √ | - | - |
| 10 | Zhou et al. [67][52] | 1 | - | - | U | 5 | 5 | 5 | √ | √ | √ | √ | - | - |
| 11 | Milletari et al. [68][53] | 1 | - | - | U | 5 | 5 | 5 | √ | √ | - | √ | - | - |
| 12 | Szarski et al. [69][54] | 1 | - | - | U | 5 | 5 | 5 | √ | √ | √ | - | - | √ |
| 13 | Vercio et al. [70][65] | 0 | - | - | C | - | - | - | - | - | - | - | - | √ |
| 14 | Yang et al. [71][55] | 1 | - | - | U | 5 | 4 | 4 | √ | -√ | √ | - | - | √ |
| 15 | Shen et al. [72][56] | 5 | - | - | U | 5 | 4 | 4 | √ | √ | - | √ | - | √ |
| 16 | Javorszky et al. [73][57] | 5 | - | - | U | 5 | 4 | 4 | √ | √ | √ | - | √ | - |
| 17 | Momin et al. [74][58] | 5 | - | - | U | 5 | 3 | 3 | - | - | √ | √ | √ | - |
| 18 | Guo et al. [75][99] | 5 | √ | √ | U | 5 | 4 | 4 | √ | √ | √ | √ | √ | - |
| 19 | Huang et al. [76][67] | 5 | - | - | U | 5 | 5 | 5 | √ | √ | √ | √ | - | √ |
| 20 | Jun et al. [77][100] | 0 | - | - | U | 5 | 5 | 5 | - | √ | √ | √ | - | - |
| 21 | Shi et al. [78][64] | 0 | - | - | U | 5 | 5 | 5 | √ | √ | √ | - | - | - |
| 22 | Thuy et al. [79][68] | 0 | - | - | U | 5 | 4 | 4 | √ | √ | √ | √ | - | - |
| 23 | Hwang et al. [80][69] | 0 | - | - | U | 5 | 5 | 5 | - | - | - | - | - | - |
| 24 | Cheung et al. [81][60] | 5 | - | - | U | 5 | 5 | 5 | √ | - | √ | √ | - | - |
| 25 | Dong et al. [82][61] | 3 | - | - | U | 5 | 8 | 8 | √ | √ | - | - | - | √ |
| 26 | Pan et al. [83][70] | 0 | - | - | U | 5 | 4 | 4 | √ | √ | √ | √ | - | √ |
| 27 | Song et al. [24] | 5 | - | - | U | 5 | 4 | 4 | √ | √ | √ | √ | - | - |
| 28 | Shinohara et al. [84][62] | 3 | - | - | U | 5 | 5 | 5 | √ | - | √ | √ | √ | √ |
| 29 | Yang et al. [71][55] | 0 | - | - | U | 5 | 5 | 5 | √ | √ | √ | - | - | √ |
| 30 | Xia et al. [85][71] | 0 | - | - | U | 5 | 5 | 5 | √ | √ | √ | - | - | √ |
| 31 | Azad et al. [86][72] | 4 | - | - | U | 5 | 4 | 4 | √ | - | √ | - | - | - |
| 32 | Ronneberger et al. [87][73] | 0 | - | - | U | 5 | 4 | 4 | √ | √ | √ | - | - | - |
| 33 | Bajaj et al. [88][74] | 1 | - | √ | C | - | - | - | - | √ | - | - | √ | - |
| 34 | Cho et al. [89][75] | 5 | - | - | C | - | - | - | - | √ | - | - | √ | - |
| 35 | Araki et al. [26] | 2 | - | - | C | - | - | - | - | - | - | √ | √ | √ |
| 36 | Bajaj et al. [90][76] | 2 | - | - | C | - | - | - | - | √ | - | - | - | - |
| 37 | Fedewa et al. [91][77] | 0 | - | - | C | - | - | - | - | - | - | - | - | - |
| 38 | Masuda et al. [92][78] | 5 | - | - | C | - | - | - | - | √ | - | - | - | - |
| 39 | Min et al. [93][79] | 1 | - | √ | C | - | - | - | - | √ | - | - | √ | - |
| 40 | Nishi et al. [94][80] | 2 | - | - | C | - | - | - | - | √ | √ | √ | √ | - |
| 41 | Shin et al. [95][111] | 2 | - | - | C | - | - | - | - | - | - | - | √ | - |
| 42 | Olender et al. [96][81] | 1 | - | - | C | - | - | - | - | √ | - | - | √ | - |
| 43 | Zhao et al. [97][82] | 2 | - | - | C | - | - | - | - | - | - | - | √ | - |
| 44 | Bargsten et al. [98][83] | 1 | - | - | C | - | - | - | - | √ | - | √ | - | - |
| 45 | Samuel et al. [99][96] | 3 | - | √ | C | - | - | - | - | √ | √ | - | - | - |
| 46 | Faraji et al. [28] | 1 | - | - | C | - | - | - | - | - | - | - | - | √ |
| 47 | Tayel et al. [100][84] | 1 | - | - | C | - | - | - | - | - | - | - | - | - |
| 48 | Cui et al. [101][85] | 1 | - | - | C | - | - | - | - | - | - | - | - | √ |
| 49 | Harms et al. [102][86] | 5 | - | - | C | - | - | - | - | - | - | √ | √ | - |
| 50 | Mishra et al. [103][87] | 0 | - | - | C | - | - | - | - | √ | √ | √ | - | - |
| 51 | Lin et al. [104][97] | 5 | - | - | C | - | - | - | - | - | - | √ | √ | - |
| 52 | Du et al. [105][98] | 0 | - | - | C | - | - | - | - | √ | - | √ | - | √ |
| 53 | Hwang et al. [80][69] | 2 | - | - | C | - | - | - | - | - | - | - | - | - |
| 54 | Jodas et al. [106][88] | 0 | - | - | C | - | - | - | - | - | - | √ | - | √ |
| 55 | Eslamizadeh et al. [107][89] | 0 | - | - | C | - | - | - | - | - | - | - | - | - |
| 56 | Sofian et al. [108][90] | 1 | - | - | C | - | - | - | - | - | - | - | - | √ |
| 57 | Cao et al. [109][91] | 3 | - | - | C | - | - | - | - | - | - | √ | √ | √ |
| 58 | Taki et al. [110][92] | 1 | - | - | C | - | - | - | - | - | - | - | - | - |
| 59 | Unal et al. [111][93] | 0 | - | - | C | - | - | - | - | - | - | - | - | - |
| 60 | Zhu et al. [112][94] | 0 | - | - | C | - | - | - | - | - | - | - | - | - |
| A14 | A15 | A16 | A17 | A18 | A19 | A20 | A21 | A22 | A23 | A24 | A25 | A26 | ||
| SN | Studies | HD | Val | LR | BS | EPO | OPT | DA | Acc. | Pres. | RS | SN | SP | CE |
| 1 | He et al. [58][44] | √ | - | - | - | - | - | - | - | - | - | √ | √ | S |
| 2 | Jin et al. [59][95] | - | - | - | - | - | - | - | √ | √ | √ | √ | √ | M |
| 3 | Ibtehaz et al. [60][45] | - | - | - | - | √ | - | √ | √ | - | - | - | - | M |
| 4 | Balakrishna et al. [61][46] | - | - | √ | √ | √ | - | √ | √ | - | - | - | - | S |
| 5 | Kim et al. [62][48] | √ | √ | √ | √ | √ | - | - | - | - | - | - | - | S |
| 6 | Li et al. [63][47] | - | - | √ | √ | √ | √ | - | - | √ | - | √ | √ | S |
| 7 | Chen et al. [64][49] | - | - | - | - | - | - | √ | - | - | - | - | - | S |
| 8 | Tong et al. [65][50] | - | - | - | √ | √ | - | √ | - | - | - | - | - | S |
| 9 | Morris et al. [66][51] | - | - | √ | √ | √ | - | √ | - | - | - | - | - | S |
| 10 | Zhou et al. [67][52] | - | - | - | - | - | - | - | - | - | - | √ | √ | S |
| 11 | Milletari et al. [68][53] | √ | - | √ | √ | √ | - | √ | - | - | - | - | - | S |
| 12 | Szarski et al. [69][54] | √ | - | √ | √ | √ | √ | √ | - | - | - | - | - | S |
| 13 | Vercio et al. [70][65] | √ | - | - | - | - | - | - | - | - | - | - | - | S |
| 14 | Yang et al. [71][55] | √ | - | √ | √ | √ | √ | √ | - | - | - | - | - | S |
| 15 | Shen et al. [72][56] | - | - | √ | √ | √ | √ | - | - | - | - | - | - | S |
| 16 | Javorszky et al. [73][57] | - | - | - | - | - | √ | - | - | - | - | - | - | S |
| 17 | Momin et al. [74][58] | √ | - | √ | √ | √ | √ | √ | - | - | - | - | - | M |
| 18 | Guo et al. [75][99] | √ | √ | - | - | - | - | √ | - | - | - | - | - | S |
| 19 | Huang et al. [76][67] | - | - | √ | √ | √ | √ | √ | - | - | - | - | √ | S |
| 20 | Jun et al. [77][100] | - | - | √ | √ | √ | √ | √ | - | - | - | - | - | S |
| 21 | Shi et al. [78][64] | - | - | √ | - | √ | - | - | - | - | - | - | - | S |
| 22 | Thuy et al. [79][68] | - | - | √ | - | - | - | √ | - | - | - | - | - | S |
| 23 | Hwang et al. [80][69] | - | - | √ | √ | √ | - | - | - | - | - | - | - | S |
| 24 | Cheung et al. [81][60] | - | - | √ | - | √ | √ | - | - | - | - | - | - | S |
| 25 | Dong et al. [82][61] | - | - | √ | √ | - | √ | √ | - | - | - | - | - | S |
| 26 | Pan et al. [83][70] | - | - | - | - | - | - | - | - | - | - | - | - | S |
| 27 | Song et al. [24] | - | - | √ | √ | √ | √ | - | - | √ | √ | - | - | S |
| 28 | Shinohara et al. [84][62] | - | - | √ | √ | - | √ | √ | √ | √ | √ | - | - | S |
| 29 | Yang et al. [71][55] | √ | √ | √ | √ | √ | √ | √ | - | - | - | - | - | S |
| 30 | Xia et al. [85][71] | - | - | √ | √ | √ | √ | √ | - | - | - | - | - | S |
| 31 | Azad et al. [86][72] | - | - | - | - | √ | - | - | √ | - | - | √ | √ | S |
| 32 | Ronneberger et al. [87][73] | - | - | - | √ | - | - | √ | - | - | - | - | - | S |
| 33 | Bajaj et al. [88][74] | - | - | √ | √ | √ | - | - | √ | √ | - | - | - | S |
| 34 | Cho et al. [89][75] | - | √ | √ | - | √ | √ | √ | √ | - | - | √ | √ | S |
| 35 | Araki et al. [26] | - | - | - | - | - | - | - | - | - | √ | - | - | S |
| 36 | Bajaj et al. [90][76] | - | - | √ | √ | √ | - | √ | - | - | - | - | - | S |
| 37 | Fedewa et al. [91][77] | - | - | - | - | - | - | - | - | - | - | - | - | S |
| 38 | Masuda et al. [92][78] | - | - | √ | - | - | - | √ | √ | - | - | - | - | S |
| 39 | Min et al. [93][79] | - | √ | √ | - | - | - | √ | √ | √ | - | √ | √ | S |
| 40 | Nishi et al. [94][80] | - | - | √ | √ | √ | √ | - | - | - | - | - | - | S |
| 41 | Shin et al. [95][111] | - | - | - | - | - | - | - | - | - | - | - | - | S |
| 42 | Olender et al. [96][81] | - | - | √ | √ | √ | - | - | √ | √ | - | - | - | S |
| 43 | Zhao et al. [97][82] | - | √ | - | - | - | - | √ | √ | √ | √ | - | - | S |
| 44 | Bargsten et al. [98][83] | - | √ | √ | √ | √ | √ | - | - | - | - | - | - | S |
| 45 | Samuel et al. [99][96] | - | - | √ | √ | √ | - | √ | √ | - | - | √ | √ | M |
| 46 | Faraji et al. [28] | √ | - | - | - | - | - | - | - | - | - | - | - | S |
| 47 | Tayel et al. [100][84] | - | - | - | - | - | - | - | √ | - | - | - | - | S |
| 48 | Cui et al. [101][85] | - | - | - | - | - | - | - | - | - | - | - | - | S |
| 49 | Harms et al. [102][86] | √ | √ | √ | √ | √ | √ | - | - | - | - | - | - | S |
| 50 | Mishra et al. [103][87] | - | √ | √ | √ | √ | - | √ | - | - | - | - | - | S |
| 51 | Lin et al. [104][97] | - | - | - | - | - | - | - | - | - | - | √ | √ | M |
| 52 | Du et al. [105][98] | √ | - | - | √ | √ | √ | √ | - | - | - | - | - | M |
| 53 | Hwang et al. [80][69] | - | √ | - | - | - | - | - | - | - | - | √ | √ | S |
| 54 | Jodas et al. [106][88] | √ | - | - | - | - | - | - | - | - | - | - | - | S |
| 55 | Eslamizadeh et al. [107][89] | - | - | - | - | - | - | - | √ | - | - | - | - | S |
| 56 | Sofian et al. [108][90] | √ | - | - | - | - | - | - | - | - | - | - | - | S |
| 57 | Cao et al. [109][91] | - | - | - | - | - | - | - | - | - | - | - | - | S |
| 58 | Taki et al. [110][92] | - | - | - | - | - | - | - | - | - | - | - | - | S |
| 59 | Unal et al. [111][93] | - | - | - | - | - | - | - | - | - | - | - | - | S |
| 60 | Zhu et al. [112][94] | √ | - | - | - | - | - | - | - | - | - | - | - | S |
TP, total patients; SM, smoking; HT, hypertension; AU, architecture used; L, layers; EC, encoder; DC, decoder; SC, skip connection; LF, loss function; Pool, pooling; DSC, Dice similarity coefficient; SN, sensitivity; SP, specificity; JI, Jaccard index; HD, Hausdorff distance; Acc, accuracy; PV, p-value; Pres, precision; RS, recall score; Val, validation; LR, learning rate; BS, batch size; Epo, epochs; OPT, optimization; DA, data augmentation; CE, clinical evaluation; U, UNet; C, conventional; S, single center; M, multicenter; √ implies that a particular attribute (column) was implemented in that study (row).
The architectural details included in the AI-based system describe whether the given architecture is a conventional architecture or UNet architecture. The performance evaluation parameters used were DSC, sensitivity, specificity, Jaccard index, Hausdorff distance, p-value, accuracy, precision, and recall score. The parameter optimization in the DL system included learning rate, batch size, epochs, optimization, and data augmentation. The clinical evaluation considered single-center or multi-center data.
Standardized data augmentation was conducted on these images [113][114][115][116][40,148,151,152]. Data augmentation plays a crucial role in improving the generalization of machine learning models, including those used for coronary artery wall segmentation in intravascular ultrasound (IVUS) scans. These techniques help increase the diversity of the training data, making the model more robust to variations in the input data. Some specific data augmentation techniques commonly used in coronary artery wall segmentation for IVUS scans are as follows: (1) rotation from −50 to 100, (2) random flipping, (3) rotation to 2700, and (4) skewing [115][151].