Your browser does not fully support modern features. Please upgrade for a smoother experience.
Please note this is a comparison between Version 1 by Matthew Haworth and Version 2 by Fanny Huang.
Plant physiological status reflects the interaction between the plant genome and the prevailing growth conditions. Accurate characterization of plant physiology is, therefore, fundamental to effective plant phenotyping studies; particularly those focused on identifying traits associated with improved yield, lower input requirements, and climate resilience. Leaf gas exchange is a core component of plant physiological research. The exchange of gases between a part of the leaf, the whole leaf, or the entire plant with the atmosphere underpins photosynthetic CO2 uptake and transpiration.
- plant phenotyping
- photosynthesis
- gas exchange
1. Introduction
Plant physiology is central to photosynthetic performance, growth, and resilience to abiotic stress [1][2][1,2]. Physiology represents the functional link between the environment and plant genome [3][4][3,4]. Characterization of plant physiology is fundamental to the utility of genome-wide association studies [5][6][7][8][5,6,7,8]. Analysis of plant physiological status is, therefore, an essential component of plant phenotyping, where the characteristics of a specific genotype are quantified under designated environmental conditions [9][10][9,10]. Traditional approaches to plant physiological analyses are often time-consuming and orientated towards a leaf- or organ-level measurement, precluding rapid screening and measurements over a wider canopy level suited to field-based phenotyping. However, given the importance of plant phenomics and precision digital agriculture to future food and bioenergy security [11][12][11,12], a number of advances in phenotyping approaches and technologies may reduce this ‘physiological bottleneck’ and facilitate wide-scale rapid analysis of plant physiological status [13][14][13,14]. The capability to infer physiological status over wide spatial scales at high temporal resolution is crucial for digital agriculture applications to optimize yield outputs and minimize resource inputs [15].
2. Leaf Gas Exchange
Leaf gas exchange is a core component of plant physiological research [16][17][16,17]. The exchange of gases between a part of the leaf, the whole leaf, or the entire plant with the atmosphere underpins photosynthetic CO2 uptake and transpiration [18][19][18,19]. The expansion in the availability of commercial plant photosynthetic gas exchange systems has led to their increased use in quantifying rates of photosynthesis, biochemical/diffusive limits to CO2 uptake, and stomatal physiological behaviour in regulating photosynthesis [20][21][20,21]. However, these plant photosynthesis systems are relatively complex and prone to mechanical or user error, e.g., [22]. This has impaired their utilization in wide-scale phenotyping studies.
Plant photosynthetic leaf gas exchange systems utilize infra-red gas analyzers to quantify fluxes of CO2 and water vapour. A leaf, or a portion of a leaf, is placed in an enclosed leaf cuvette where the concentrations of [CO2] and [H2O] in the air entering and then exiting the cuvette after passing over the leaf are measured. The delta values of [CO2] and [H2O] are then used to calculate parameters such as photosynthesis (PN), stomatal conductance (Gs), and the internal sub-stomatal concentration of CO2 within the leaf (Ci), as shown in [23] and the citations contained within. The external concentration of [CO2] outside the leaf (Ca), photosynthetic photon flux density (PPFD), temperature, relative humidity, leaf-to-air vapour pressure deficit, and velocity of air flow can be controlled within the leaf cuvette. This enables rapid manipulation of cuvette conditions to quantify responses to specific factors influencing photosynthesis and the exchange of gases between the leaf and the external atmosphere. Many plant photosynthesis systems also include the capacity to simultaneously measure chlorophyll fluorescence (ChlF) parameters alongside leaf gas exchange.
2.1. Instantaneous Point Measurements
Instantaneous point measurements give a ‘snap shot’ of leaf photosynthetic status. Point measurements are the simplest and most rapid type of leaf gas exchange measurement to perform, and are, therefore, the most widely used in plant phenotyping studies. Despite the relative simplicity of instantaneous point measurements, these measurements can be time-consuming. If set controlled conditions of PPFD, temperature, Ca, and leaf-to-air vapour pressure deficit are utilized within the leaf cuvette, each leaf requires a period of time to adjust to those cuvette conditions, precluding the ability to take large numbers of measurements at the same time/conditions in phenotyping trials of multiple genotypes. Less time-consuming instantaneous point measurements of leaf gas exchange parameters can be performed without using controlled cuvette conditions. Such measurements where PPFD and temperature track ‘ambient’ conditions do not require the same adjustment period for the leaf, but variations in ambient conditions, diminishes comparability between measurements, and may render any phenotypic or treatment effect indiscernible [24][25][24,25]. A significant disadvantage of these instantaneous point measurements of leaf gas exchange is that they only reflect photosynthetic status at a single point in time over a comparatively small area of leaf (~1.75 to 6 cm2). Moreover, leaf gas exchange measurements tend to be comparatively variable between individual plants (and sometimes between leaves of the same plant). A more comprehensive insight into leaf physiological processes that are relevant to phenotyping can be observed in the more detailed leaf gas exchange measurements outlined below; however, these measurements are more complex and time-consuming than instantaneous measurements, further reducing their applicability for high-throughput phenotyping.
2.2. Biochemical Efficiency of Photosynthesis
The rate of photosynthesis is determined by biochemical and diffusive constraints on the uptake and assimilation of CO2 [23][26][23,26]. The biochemical efficiency of photosynthesis is a key parameter in determining plant growth rate and crop yield [27][28][29][30][31][32][33][27,28,29,30,31,32,33], and, therefore, of primary importance to plant phenotyping applications. Leaf level rates of photosynthesis in many staple crops such as rice are relatively low [34]. Identification of genotypes with higher leaf level photosynthetic capacities has the potential to positively affect future crop yields [30][35][36][30,35,36], and identification of genotypes that retain biochemical assimilation during abiotic stress such as water deficit or drought can contribute to more climate-resilient agriculture [27][37][27,37]. However, analysis of the biochemical efficiency of leaf level photosynthesis is highly time-consuming, and it is not possible to rapidly and accurately assess large volumes of genotypes at sufficient levels of replication [38][39][38,39].
The most commonly used method to gauge plant photosynthetic capacity in vivo involves the use of photosynthetic leaf gas exchange systems to perform photosynthetic response curves, where the PN is measured relative to increasing steps in the concentration of [CO2] (commonly known as A–Ci curves where, instead of PN, A stands for the assimilation rate of CO2) (Figure 1).
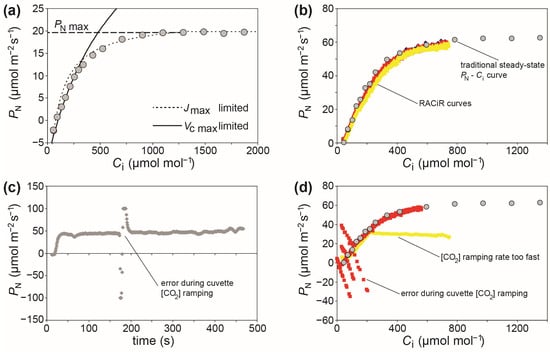
Figure 1. (a) PN–Ci response curve (Olea europaea L.) showing the stage of the curve limited by the rate of electron transport required for ribulose-1,5-bisphosphate (RuBP) regeneration (Jmax), the part of the curve limited by the carboxylation capacity of ribulose-1,5-bisphosphate carboxylase/oxygenase (RubisCO) (Vcmax), and the maximum rate of photosynthesis at PARsat and high [CO2] (PNmax), grey circles indicate steady state measurements of photosynthetic gas exchange taken at each [CO2] level; (b) RACiR curves (red, yellow, and blue symbols) overlain with a traditional PN–Ci steady state response curve (Phragmites australis (Cav.) Trin. ex Steud.); (c) example of an error during [CO2] ramping that can affect post-processing of a RACiR curve, and; (d) the results of the [CO2] ramping error outlined in (c) on the corrected RACiR curve (red symbols) of a P. australis leaf, alongside a RACiR error caused by the use of an excessively fast [CO2] ramping rate (yellow symbols).
Figure 1a shows a typical PN–Ci curve characteristic of a C3 plant Michaelis–Menten enzymatic reaction. Photosynthesis is limited by the availability of CO2 at the initial part of the curve, and this represents the maximum rate of carboxylation of ribulose-1,5-bisphosphate carboxylase/oxygenase (RubisCO) (Vcmax). At higher levels of [CO2], PN is no longer limited by substrate availability, but the regeneration of ribulose-1,5-bisphosphate (RuBP) (Jmax). The parameters Vcmax and Jmax are critical components of crop and climate models [19][40][41][19,40,41], and would likely be integrated into digital agriculture applications [42][43][42,43]; thus, demonstrating their importance to phenotyping of plant physiology [30]. More detailed reviews of PN–Ci curves can be found in Sharkey et al. [21], Centritto et al. [44], Ethier and Livingston [45], and Duursma [20]. The parameters derived from these PN–Ci curves are fundamental to the characterization of the biochemical efficiency of PN, but these measurements are time-consuming (each curve taking ~40–120 min), prone to error, and require expensive equipment operated by staff trained in leaf gas exchange. This makes traditional steady state photosynthetic response curves unsuited to high-throughput phenotyping systems [38][39][46][38,39,46].
Given the importance of the biochemical efficiency of photosynthetic CO2 assimilation to crop productivity [24][30][24,30], attempts have been made to adapt these measures for use in phenomic applications. Newer plant photosynthetic gas exchange systems are able to continuously ‘ramp’ [CO2] in the leaf cuvette and dynamically measure the concurrent effect on PN. These response curves are known as RACiR curves, standing for “Rapid A-Ci Response” [46]. The RACiR curves can be performed in ~5–15 min, significantly increasing the capability to perform detailed physiological analysis of photosynthetic capacity [31][46][47][48][49][31,46,47,48,49]. However, a number of limitations constrain the potential widespread application of RACiR curves: (1) RACiR curve measurements require set-up time to perform empty cuvette measurements to determine the lag in the system between the reference and sample IRGAs [46]; (2) RACiR curves require a degree of prior knowledge of the plant species under analysis (for example, if there is a wide range of Gs values of plant varieties in a phenotyping study, this may require adjustment of the [CO2] ramping speed between varieties) [50][51][50,51]; (3) preparation of the RACiR curves involves more extensive processing of data after measurements than traditional PN–Ci curves, and this reduces the opportunity to identify and correct any errors during measurements (Figure 1b), and; (4) variations associated with photosystem I electron transport dynamics [52]. To minimize some of these limitations by eliminating data post-processing, a recent modification of the method known as the single-step CO2 response (SSCO2R) has been proposed. This involves equalizing the pathways (or air volume) travelled by the reference and analysis sample air flows to the respective IRGAs during the CO2 ramping process [53].
The parameters Vcmax and Jmax are highly significant to models of photosynthesis [26][54][26,54], stomatal behaviour [55][56][57][55,56,57], crop yield [58][59][58,59], and climate modelling [19], but the application of Vcmax and Jmax is constrained by the length of time and the complexities outlined above in performing sufficient numbers of reliable PN–Ci curves. To speed up data collection, Vcmax has also been calculated from single-point measurements of light-saturated photosynthesis (PN sat) [60][61][60,61]. This ‘one-point method’ assumes that in the light-saturated state, the leaves are limited by CO2 availability, allowing calculation of Vcmax from the C3 photosynthesis model [26][62][26,62]. Accurate prediction of Vcmax from a single-point measurement of leaf gas exchange requires the PN of the leaf to be limited by CO2 availability, knowledge/estimation of respiration in the light, and for the leaf to be fully acclimated to saturating PPFD. In cases where these conditions are not met, estimates of Vcmax may be rendered inaccurate [63][64][63,64]. This uncertainty leaves the more time-consuming PN–Ci curves as the benchmark methodology for the determination of Vcmax and Jmax.
2.3. Light-Use Efficiency and Photoprotection
The conversion of light energy to sugars underpins plant growth, and is central to crop yield [65]. However, excess light can induce photo-oxidative stress through the production of reactive oxygen species [66]. During episodes of abiotic stress, such as drought, when the capacity to utilize energy for photochemistry declines, a greater proportion of the absorbed light energy must be dissipated as heat or re-emitted at a longer, less energetic wavelength as ChlF [67][68][67,68]. It is, therefore, important for crop phenotyping efforts to enhance productivity and climate resilience to characterize the physiology of light harvesting and photoprotection.
Photosynthetic light capture and use can be analyzed a number of ways using leaf gas exchange, often in combination with ChlF [69]. The most common approach is to measure PN at decreasing/increasing steps of PPFD using the LED lights within the plant photosynthesis system leaf cuvette. This enables calculation of the maximum quantum efficiency (ΦCO2), the light saturation point (PPFD above which PN no longer increases: PN sat), identification of levels of PPFD where photoinhibition may occur [38][70][38,70], and respiration in both the light (Rlight) and the dark (Rdark) [71]. These physiological parameters are useful in identifying crop varieties with greater quantum efficiencies that are more likely to correlate to yield [72].
Light response curves incur many of the same impediments for high-throughput phenotyping as PN–Ci curves. Despite their utility in the accurate characterization of light harvesting and protective physiologies, light response curves using leaf gas exchange are likely to be unsuitable for phenotyping in comparison to the leaf-level sensor and remote-sensing-based approaches outlined below. Nevertheless, light response curves derived from leaf gas exchange may still be required to ‘support’ data and observations derived from more rapid approaches suited to high-throughput phenotyping.
Photosynthetic Response to Variable Growth Conditions
Plant responses to variations in radiation are becoming increasingly important to efforts to improve crop productivity [65][73][74][65,73,74]. Under normal growing conditions in the field, the light environment experienced by leaves can be highly variable (passing clouds, temporary shading from other leaves in the canopy, changes in leaf orientation as the canopy moves due to wind, etc.) Small increases in the efficiency of plants to use this heterogeneous light would translate into improved yields when scaled over whole canopies and an entire growing season [74][75][74,75]. The mechanisms involved in the transitions between photochemical and protective energy dissipation may be evident in canopy-level measurement of sun-induced fluorescence [76]. This improved efficiency in photosynthetic light harvesting is related to the physiological processes involved in the transitions between light capture and energy dissipation, and also physiological stomatal behaviour through stomatal control of PN [77][78][77,78].
Stomatal physiological regulation plays a central role in plant carbon and water efficiencies [79][80][79,80]. Analysis of Gs values over time to changes in factors such as PPFD, [CO2], chemical signals of drought, or leaf-to air vapour pressure deficit enables quantification of stomatal physiological responsiveness [81][82][83][84][81,82,83,84]. These ‘stomatal kinetics’ are performed by placing a leaf within a cuvette and monitoring Gs over time while cuvette conditions are adjusted [38]. Stomatal kinetic responses can be used to show physiological differences between varieties that may translate into enhanced productivity [85][86][85,86], resilience to stresses such as drought [83][87][83,87], or fumigation with atmospheric pollutants [88]. However, measurement of stomatal kinetics using leaf gas exchange is particularly time-consuming given the requirement for the leaf to completely adjust to cuvette conditions prior to recording the full extent of any response to a change in cuvette conditions and the inherent variability in many Gs measurements requiring high numbers of replicates for statistical robustness [38].