Bioenergy is one of the alternatives to secure energy demand, despite increasing debate on the sustainability of using bioenergy as a renewable source. As the source is disseminated over a large area and affected by seasonality, the potential benefit is highly dependent on other cost and benefit trade-offs along the supply chain. This review paper aims to assess operational management research methods used in biofuel supply chain planning, including both upstream production and international downstream trading. There have been considerable operational management studies done on upstream processes in biofuel production based on different strategic and tactical decision making of a single or multiple feedstocks, considering economic and environmental factor. However, the environmental consideration is often limited to carbon emission where the other environmental impact such as land-use change, biodiversity loss, irrigation and fertilisation are often being overlooked. Biofuel supply chain and trading at international level remain as an apparent research potential where only limited numbers of global energy models explicitly simulate international bioenergy trade. The leading biofuel producing countries in Southeast Asia: Malaysia, Indonesia and Thailand, are selected as a case study to investigate further on how the supply chain management model could be applied considering the existing biofuel support policies. This study is expected to contribute to the selection of operational management research methods used for decision making under robust policy context, followed by several recommendations.
- biofuel
- bioenergy
- supply chain
- Malaysia
- Indonesia
- Thailand
- interdisciplinary
- integrated assessment
1. Introduction
The biofuel supply chain consists of biomass production, pre-treatment, storage and biofuel conversion. Each operation either takes place at the biomass production sites, or at another facility that is being connected to the biomass production site through different transportation mode. Figure 1 shows the flow chart of the biofuel supply chain. The biofuel supply chain is distinguished into two segments: upstream and downstream, with the segment bioenergy conversion placed interchangeably between the two, depending on whether biomass feedstock or the final product biofuel is traded. In this section, methods used in biofuel supply chain planning will be presented based on two categories: the upstream supply chain decision-making model and the downstream trade model. It is noted that not all bioenergy produced is traded; in some cases, bioenergy is utilised locally. To distinguish between supply chain management model used in this study downstream generally refers to traded bioenergy with some publications considering local consumption too.
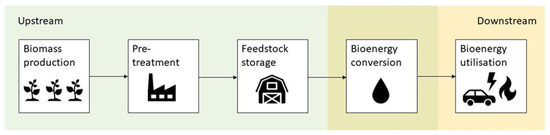
Figure 1. An example of a biofuel supply chain.
2. Methods Used in Biofuels Upstream Supply Chain Planning
The biofuel supply chain planning and management are influenced by various factors, among which are included biomass availability, choice of biomass cultivation type, harvesting, transport mode of the biomass, pre-treatment facility, biomass conversion technology type, conversion facility location and capacity, product storage facility, product distribution, routing and inventory. There are many decisions, of major and minor, to be made across the whole supply chain planning starting from crop selection to final product as covered in a review conducted by De Meyer et al.[1] [12] and Atashbar et al.[2] [13], in this case, biofuel consumption. There are three primary decision-making levels in supply chain planning and management: strategic, tactical and operational level (Figure 2). The strategic decision-making level refers to a decision where long-term investment is involved[1] [12], for instance, location, capacity and type of storage, pre-processing, conversion facility, transportation mode (investment in ownership of the vehicle), crop selection. Tactical decision-making level refers to medium-term decision decisions, usually monthly or weekly and are within the constraint of a strategic decision[1] [12]. Some examples of tactical decisions are harvest planning, inventory planning, transport routing and shipment capacity. Operational decision-making level usually refers to a decision over a short time frame, ranging from hourly to weekly that is within the limit of a tactical decision[1] [12]. For instance, inventory planning and transport scheduling that ensures undisrupted and efficient operations of plants and processes at another facility through the supply chain.
Under each decision-making level, three main approaches are applied in solving the supply chain problem: mathematical programming, heuristic approaches, multicriteria decision analysis. Mathematical programming refers to mathematical models that represent real-world problems. The model is solved by optimising the objective function. For instance:
- To maximise profit or to minimise the overall cost for an economic purpose.
- To minimise greenhouse gas (GHG) emission for environmental purpose.
- To maximise job creation for social purpose, while satisfying the limit of the constraints formulated in the model.
While the mathematical programming method aims to identify the optimal solution by solving the equations simultaneously, the heuristic approach looks for an optimal point to a defined problem through a stepwise approach. According to a review conducted by De Meyer[1] [12], three different heuristics algorithms are observed: genetic algorithm, particle swarm optimisation and binary honeybee foraging for upstream biomass planning and management optimisation. Multicriteria decision analysis is also one of the methods used for decision making in supply chain generally. According to Roy[3] [14], multicriteria decision analysis is defined as ‘a decision aid and a mathematical tool allowing the comparison of different alternatives or scenarios according to many criteria, often conflicting, in order to guide the decision-maker towards a judicious choice.
Thirty-two scientific publications could be found between 2014–2019 reviews the methods used for decision making at strategic and tactical levels under respective problem statement of the biofuel supply chain, with some exceptions for publications before 2014 for its method development related to recent publications. It shows a summary of recent scientific publications on decision making of biofuel supply chain (Table 13) It is observed that most biofuel supply chain planning and management problems are formulated as a Mixed Integer Linear Programming (MILP) problem, covering 21 papers out of 32 articles. Aguayo et al.[4] [15] present a MILP model to address a static and dynamic corn-stover harvest scheduling problem in cellulosic ethanol production by minimising system cost. Ahn et al.[5] [16] developed a mathematical programming model for strategic planning and design of microalgae biomass-to-biodiesel supply chain which minimise the total cost of the supply chain by taking resource constraints, demand constraints and technology into accounts. The model is then applied in a case study of the biodiesel market in South Korea.
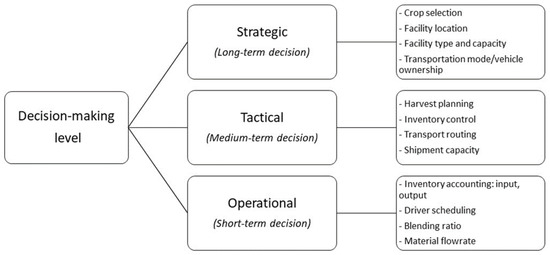
Figure 2. Decision-making levels of biofuel supply chain.
Čuček et al.[6] [17] presented a multi-period MILP model for regional bioenergy supply network optimisation with sources of biomass from first, second and third generations of biofuels. The model enables strategic decision on raw material sourcing, conversion technology selection by maximising economic performance. Foo et al.[7] [18] developed a linear programming (LP) model to identify optimal feedstock allocation of a direct biomass source-sink allocation. The model is extended to a MILP model for pragmatic decision planning in biomass supply chain logistics, where a minimum threshold quantity is met in an optimal network. Miret et al.[8] [19] developed a multi-period MILP model that proposes optimal bioethanol supply chain design with the account to facility location, process selection and inventory policy. This study compared the economic, environment and social aspect of bioethanol production from first and second-generation biomass. Ng and Maravelias[9] [20] presented a multi-period MILP model for biofuel supply chain design, taking a case study in Wisconsin. Ng et al.[10] [21] developed a MILP model which maximises biomass utilisation of rubber seed oil to produce biodiesel that considers centralised and decentralised rubber seed processing facilities. Rabbani et al.[11] [22] developed a MILP model that selects optimal biomass pre-processing plant, biofuel plant and biofuel storage warehouse. Santibañez et al.[12] [23] presented a multi-objective, multi-period MILP model that seeks to optimise the biorefinery supply chain in fulfilling ethanol and biodiesel demands in Mexico with consideration of economic, environmental and social criteria.
Other than MILP, some problems have been formulated as a mixed-integer non-linear programming (MINLP) model and then linearised to form the MILP model. López et al.[13] [24] developed an MINLP optimisation model for biorefinery system design while taking the interactions of the biorefinery system with the surrounding watershed into account. The non-linear term came from the exponent to represent the economy of scale of biorefinery plant. The model is then solved as MILP by fixing the exponent as one. How et al.[14] [25] developed a MINLP model that solves biomass supply chain synthesis problem by maximising overall profit and minimising CO2 emission through introduced CO2 penalty. Santibañez et al.[15] [26] developed an MINLP model to identify the optimal configuration of a distributed biorefineries system, where the model can decide utilised raw materials, processing technologies, processing facilities and manufactured products.
It is observed that most supply chain optimisation problems are solely focused on optimising the economic benefits. Environmental, energetic and social factors deserve more attention in optimisation as these factors weight significantly when it comes to strategic decision making; this is especially true for the biofuel policymaker. To address this limitation, some authors used Pareto optimisation approach to obtain an optimal solution under the multi-objective situation. Liu et al.[16] [27] present a multi-objective MILP model of biofuel conversion pathways with accounts to economic, energy and environmental criteria. Economic criteria are measured by total annual profit, energetic criteria are measured by fossil energy input per MJ biofuel, while environmental criteria are measured by GHG emissions per MJ biofuel. Pareto optimal surfaced is obtained to study the trade-offs between the three criteria. Miret et al.[8] [19] applied the same approach through the epsilon-constraint method to study the multi-objective bioethanol supply chain model with a case study in France. Orjuela et al.[17] [28] developed a multi-objective LP model that analyses biodiesel supply chain taking into consideration of economic, environment and social aspect, where the social aspect is taken from the perspective of food security concern. The epsilon-constraint method is then used to study the trade-off between multiple criteria. Osmani and Zhang[18] [29] used an augmented epsilon-constraint method to solve multiple objective models with more than two objectives. Pareto optimal solution is also obtained in Santibañez et al.[12] [23] multi-objective study.
It is undeniable that in the biofuel supply chain, which has a complex upstream supply chain, there are many uncertainties that could affect the performance of the supply chain, among which are included crop yield, potential disruption situations like pest attacks, floods or droughts, and biofuel price uncertainties. In order to address these uncertainties, a number of publications are found to have taken these factors into account. Azadeh et al.[19] [30] present a stochastic multi-period MILP model that maximise the profit of a biofuel supply chain with prices of biofuels assumed to be stochastic. A case study is then conducted for the biofuel supply chain in Iran. Bairamzadeh et al.[20] [31] proposes a hybrid robust MILP model for bioethanol supply chain design and planning with considerations of different types of uncertainties which included randomness, epistemic and deep uncertainties. Ghelichi et al.[21] [32] developed a two-stage multi-period stochastic MILP model for biodiesel supply chain design with Jatropha curcas as feedstock, under consideration of feedstock supply and product demand uncertainties. Maheshwari et al.[22] [33] developed biofuel supply chain resiliency optimisation model that consider no disruption and disruption scenarios during the flood, drought, pest attack, equipment failure, each weighted by their probability of occurrence. Mohseni and Pishvaee[23] [34] present a robust supply chain optimisation model that manages complexities in strategic and tactical planning of microalgae-based biofuel production. The supply chain is designed based on batch and continuous production system. Optimal scale for the batch system is determined by a trade-off between the cost of biofuel production, transportation and risk mitigation. Osmani and Zhang[18] [29] presents a multi-objective, multi-period optimisation model of a second-generation biofuel supply chain under switchgrass yield, bioethanol demand and bioethanol sale price uncertainties. Santibañez et al.[24] [35] presented a stochastic multi-period optimisation model that identifies optimal biorefinery supply chain planning under raw material price uncertainty considering environmental and economic aspects. A multi-scale multi-period MILP model is developed by Sharifzadeh et al.[25] [36] to identify the optimal supply chain design of biofuel production using fast pyrolysis under consumer demands and biomass availability uncertainty.
Some authors integrated graphical approaches with mathematical programming in solving a biomass supply chain problem. Fan et al.[26] [37] developed a novel graphical decision-making tool that allows the selection of transportation mode with lower environmental burden and energy consumption. Lam et al.[27] [38] proposed a two-level graphical strategy for optimal regional-level biomass energy supply chain networks synthesis that minimises total carbon emissions footprint followed by optimal biomass supply chain network synthesis within the region. The graphical approach was then applied to a case study at the Central European region.
Some authors integrated GIS functions to characterise the related biofuel supply chain when formulating the problem, especially in determining facility location. Harahap et al.[28] [39] present a policy analysis using a spatially-explicit MILP model to optimise the overall palm oil supply chain – not just solely on palm oil biofuel supply chain in Sumatra, Indonesia. Hoo et al.[29] [40] presented a spatial-economic optimisation MILP model to identify biomethane production plants with the aid of GIS network analysis. Zhang et al.[30] [41] developed a GIS integrated optimisation model in designing a bioethanol feedstock supply chain, which allows the selection of facility location by minimising total system cost. The model is then applied on a case study in the northern part of Michigan’s Lower Peninsula, in the US.
Other than mathematical programming, a heuristic approach is also used by some authors to solve complex biofuel supply chain models. Note that the heuristic approach looks for satisfactory solutions, not necessarily an optimal solution and often presents reduced runtimes in solving models[1] [12]. Asadi et al.[31] [42] developed a multi-objective metaheuristic algorithm for algae biofuel supply chain design with an integrated formulation of inventory, routing and location decision under demand uncertainties. Marufuzzaman et al.[32] [43] developed a two-staged (strategic level decision making followed by tactical decision making) stochastic model that assists the design and management of biodiesel supply chain by taking feedstock and technology uncertainties into account. The problem is then solved using an algorithm that combines Lagrangian relaxation and L-shaped solution methods. Poudel et al.[33] [44] present a hybrid decomposition algorithm in solving an optimisation problem when studying the impact of disruption and congestion at the facility of a biofuel supply chain. While for multicriteria decision analysis, Nana et al. present a spatial explicit biodiesel supply chain optimisation model that was solved using an analytical hierarchy process (AHP). How and Lam[34] [45] proposed a multi-objective optimisation (MOO) solution of biomass supply chain management (SBSCM) through AHP that integrates both economic and environmental factors. Among which the environmental factors included abiotic depletion potential (ADP), acidification potential (AP), aquatic toxicity potential (ATP), global warming potential (GWP), land footprint, nutrification potential (NP), ozone depletion potential (ODP), photochemical ozone creation potential (POCP), terrestrial toxicity potential (TTP), water footprint. A general method is also observed in Ng and Maravelias[35] [46] study on the biofuel supply chain. The authors applied a systematic method to compare and investigate the economic performance and energy efficiency of the biofuel supply chain under various configurations and transportation modes. The author introduced hybrid configurations that can potentially improve economic performance and energy efficiency of different supply chain configuration. The findings of the result form the basis for larger-scale biofuel supply chain optimisation model in a future study.
Table 13.
Recent scientific publications on state-of-art of decision making for the biofuel supply chain.
| Source | Decision Level | Obj. | Decision Variables | Method | Case Study |
|---|---|---|---|---|---|
| Aguayo et al. [15] | T | EC | Tactical: - minimum number of balers required - harvest and routing decision |
MP - MILP | USA |
| Ahn et al. [16] | S + T | EC | Strategic: - refineries facility location and capacity Tactical: - feedstock sourcing location and amount |
MP - MILP | South Korea |
| Asadi et al. [42] | S + T | EC + EN | Strategic: - number and location of distribution facility - allocation of extraction sites to these facilities Tactical: - minimum inventory level - routing of extraction sites |
H - algorithm | Iran |
| Azadeh et al. [30] | S | EC | Strategic: - facility locations and capacities- technology and material flows |
MP - MILP | Iran |
| Bairamzadeh et al. [31] | S + T | EC | Strategic: - facilities location & capacity - technology type Tactical: - biomass allocation - inventory levels - production amounts - transportation among network |
MP - MILP | Iran |
| Fan et al. [37] | T | EC + EN | Tactical: - transportation mode selection |
MP - LP + P-graph | Rotterdam to Antwerp, Netherlands and Genova, Italy |
| Foo et al. [18] | T | EN | Tactical: - plant capacity - feedstock capacity |
MP - LP + MILP | Malaysia |
| Čuček et al. [17] | S | EC | Strategic: - raw materials sourcing - conversion technologies - intermediate & final product flows |
MP - MILP | EU |
| Ghelichi et al. [32] | S + T | EC | Strategic: - numbers, locations and capacities of cultivation and facility Tactical: - transportation mode allocation - number of purchased and rented trucks |
MP - MILP | Iran |
| Harahap et al. [39] | S | EC | Strategic: - technology selection for biomass conversion |
MP - MILP + GIS | Sumatra, Indonesia |
| Hoo et al. [40] | S + T | EC | Strategic: - facility location - biomethane plant size Tactical: - transportation mode |
MP – MILP + GIS | Johor, Malaysia |
| How and Lam [45] | T | EC + EN | Tactical: - biomass allocation - biomass transportation mode |
MP - MILP | Johor, Malaysia |
| How et al. [25] | S + T | EC | Strategic: - processing hub selection Tactical: - biomass allocation - transportation mode selection |
MP - MINLP | Johor, Malaysia |
| Lam et la. [38] | S | EN | Strategic: - biomass supply chain network design |
MP - LP + P-graph | Central European region |
| Liu et al. [27] | S | EC + EN + SO | Strategic: - optimal conversion pathway - biomass type, locations - facility locations - network topology structure |
MP - MILP | China |
| López et al. [24] | S | EC + EN | Strategic: - feedstocks type - location of cultivation sites - location of biomass facilities - biomass conversion technologies |
MP - MINLP | Central-west part of Mexico |
| Maheshwari et al. [33] | S | EC | Strategic: - locations and capacities of pre-processing facility & biorefinery plant - biomass and intermediate product flows |
MP - MILP | Southern Illinois, USA |
| Marufuzzaman et al. [43] | S + T | EC + EN | Strategic: - transportation mode - facility location Tactical: - inventory control |
H - algorithm | Mississippi, USA |
| Miret et al. [19] | S + T | EC + EN + SO | Strategic: - facilities location - process selection Tactical: - inventory |
MP - MILP | France |
| Mohseni and Pishvaee [34] | S + T | EC | Strategic: - optimal production scale Tactical: - intermediate product and product flows - amount of fertiliser needed |
MP - MILP | Iran |
| Nana et al. [47] | S | EC + EN | Strategic: - facility location & capacity |
MCDA - AHP + GIS | Jiangsu, China |
| Ng and Maravelias [20] | S + T | EC | Strategic: - biomass selection and allocation - technology selection - regional depots and biorefineries locations and capacity Tactical: - production, inventory and shipment |
MP - MILP | South Central, South of Wisconsin, USA |
| Ng and Maravelias [46] | - | EC + ENE | - | General method | NA |
| Ng et al. [21] | T + O | EC | Tactical + operational: - optimal blending ratio |
MP - MILP | Malaysia |
| Orjuela et al. [28] | S | EC + EN + SO | Strategic: - strategy/solution selection |
MP - LP | Columbia |
| Osmani and Zhang [29] | S | EC + EN + SO | Strategic: - land allocation for switchgrass cultivation - locations and capacities of facility - conversion technology |
MP - MILP | Midwestern USA |
| Poudel et al. [44] | S + T | EC | Strategic: - facility location Tactical:- production & storage - routing plan |
MP - MINLP; H - algorithm | Mississippi and Alabama, USA |
| Rabbani et al. [22] | S | EC | Tactical: - whether to purchase or rent the warehouses and plants - selection of pre-processing centre - selection of biofuel plants - selection of warehouses to store biofuels |
MP - MILP | NA |
| Santibañez et al. [23] | T | EC + EN + SO | Tactical: - feedstock produced - feedstock transported - feedstock arrived/accumulated - product arrived/accumulated |
MP - MILP | Mexico |
| Santibañez et al. [26] | T | EC | Strategic: - processing facility and technology Tactical: - material flow - inventory level |
MP - MINLP | Mexico |
| Santibañez et al. [35] | S + T | EC + EN | Strategic: - facility location technology type Tactical: - raw materials and products - market |
MP - MILP | Mexico |
| Sharifzadeh et al. [36] | S + T + O | EC | Strategic: - number, type, location and size of processing plants and mobile pyrolyser Tactical + operational: - materials flowrates |
MP - MILP | London, Liverpool, UK |
| Zhang et al. [41] | S + T | EC | Strategic: - facility location Tactical: - inventory level |
MP - MILP + GIS | Northern part of Michigan’s Lower Peninsula, USA |
| Source | Decision Level | Obj. | Decision Variables | Method | Case Study |
| Aguayo et al.[4] | T | EC | Tactical: - minimum number of balers required - harvest and routing decision |
MP - MILP | USA |
| Ahn et al.[5] | S + T | EC | Strategic: - refineries facility location and capacity Tactical: - feedstock sourcing location and amount |
MP - MILP | South Korea |
| Asadi et al.[36] | S + T | EC + EN | Strategic: - number and location of distribution facility - allocation of extraction sites to these facilities Tactical: - minimum inventory level - routing of extraction sites |
H - algorithm | Iran |
| Azadeh et al.[19] | S | EC | Strategic: - facility locations and capacities- technology and material flows |
MP - MILP | Iran |
| Bairamzadeh et al.[20] | S + T | EC | Strategic: - facilities location & capacity - technology type Tactical: - biomass allocation - inventory levels - production amounts - transportation among network |
MP - MILP | Iran |
| Fan et al.[26] | T | EC + EN | Tactical: - transportation mode selection |
MP - LP + P-graph | Rotterdam to Antwerp, Netherlands and Genova, Italy |
| Foo et al.[7] | T | EN | Tactical: - plant capacity - feedstock capacity |
MP - LP + MILP | Malaysia |
| Čuček et al.[6] | S | EC | Strategic: - raw materials sourcing - conversion technologies - intermediate & final product flows |
MP - MILP | EU |
| Ghelichi et al.[21] | S + T | EC | Strategic: - numbers, locations and capacities of cultivation and facility Tactical: - transportation mode allocation - number of purchased and rented trucks |
MP - MILP | Iran |
| Harahap et al.[28] | S | EC | Strategic: - technology selection for biomass conversion |
MP - MILP + GIS | Sumatra, Indonesia |
| Hoo et al.[29] | S + T | EC | Strategic: - facility location - biomethane plant size Tactical: - transportation mode |
MP – MILP + GIS | Johor, Malaysia |
| How and Lam[34] | T | EC + EN | Tactical: - biomass allocation - biomass transportation mode |
MP - MILP | Johor, Malaysia |
| How et al.[14] | S + T | EC | Strategic: - processing hub selection Tactical: - biomass allocation - transportation mode selection |
MP - MINLP | Johor, Malaysia |
| Lam et la.[27] | S | EN | Strategic: - biomass supply chain network design |
MP - LP + P-graph | Central European region |
| Liu et al.[16] | S | EC + EN + SO | Strategic: - optimal conversion pathway - biomass type, locations - facility locations - network topology structure |
MP - MILP | China |
| López et al.[13] | S | EC + EN | Strategic: - feedstocks type - location of cultivation sites - location of biomass facilities - biomass conversion technologies |
MP - MINLP | Central-west part of Mexico |
| Maheshwari et al.[22] | S | EC | Strategic: - locations and capacities of pre-processing facility & biorefinery plant - biomass and intermediate product flows |
MP - MILP | Southern Illinois, USA |
| Marufuzzaman et al.[32] | S + T | EC + EN | Strategic: - transportation mode - facility location Tactical: - inventory control |
H - algorithm | Mississippi, USA |
| Miret et al.[8] | S + T | EC + EN + SO | Strategic: - facilities location - process selection Tactical: - inventory |
MP - MILP | France |
| Mohseni and Pishvaee[23] | S + T | EC | Strategic: - optimal production scale Tactical: - intermediate product and product flows - amount of fertiliser needed |
MP - MILP | Iran |
| Nana et al.[36] | S | EC + EN | Strategic: - facility location & capacity |
MCDA - AHP + GIS | Jiangsu, China |
| Ng and Maravelias[9] | S + T | EC | Strategic: - biomass selection and allocation - technology selection - regional depots and biorefineries locations and capacity Tactical: - production, inventory and shipment |
MP - MILP | South Central, South of Wisconsin, USA |
| Ng and Maravelias[35] | - | EC + ENE | - | General method | NA |
| Ng et al.[10] | T + O | EC | Tactical + operational: - optimal blending ratio |
MP - MILP | Malaysia |
| Orjuela et al.[17] | S | EC + EN + SO | Strategic: - strategy/solution selection |
MP - LP | Columbia |
| Osmani and Zhang[18] | S | EC + EN + SO | Strategic: - land allocation for switchgrass cultivation - locations and capacities of facility - conversion technology |
MP - MILP | Midwestern USA |
| Poudel et al.[33] | S + T | EC | Strategic: - facility location Tactical:- production & storage - routing plan |
MP - MINLP; H - algorithm | Mississippi and Alabama, USA |
| Rabbani et al.[11] | S | EC | Tactical: - whether to purchase or rent the warehouses and plants - selection of pre-processing centre - selection of biofuel plants - selection of warehouses to store biofuels |
MP - MILP | NA |
| Santibañez et al.[12] | T | EC + EN + SO | Tactical: - feedstock produced - feedstock transported - feedstock arrived/accumulated - product arrived/accumulated |
MP - MILP | Mexico |
| Santibañez et al.[15] | T | EC | Strategic: - processing facility and technology Tactical: - material flow - inventory level |
MP - MINLP | Mexico |
| Santibañez et al.[24] | S + T | EC + EN | Strategic: - facility location technology type Tactical: - raw materials and products - market |
MP - MILP | Mexico |
| Sharifzadeh et al.[25] | S + T + O | EC | Strategic: - number, type, location and size of processing plants and mobile pyrolyser Tactical + operational: - materials flowrates |
MP - MILP | London, Liverpool, UK |
| Zhang et al.[30] | S + T | EC | Strategic: - facility location Tactical: - inventory level |
MP - MILP + GIS | Northern part of Michigan’s Lower Peninsula, USA |
S—Strategic; T—Tactical; O—Operational; EC—Economic; EN—Environment; SO—Social; MP—Mathematical programming; H—Heuristic; MCDA—Multicriteria Decision Analysis
It is observed that there is increasing research and publications on operational biofuel supply chain methods in China and Iran, especially for second-generation and third-generation biofuel production. Waste cooking oil as a feedstock for biofuel production is found in China biofuel supply chain planning (Table 24). Waste cooking oil can be converted into biofuel through hydro-processed esters and fatty acids (HEFA) conversion process. Advanced biofuel produced from waste cooking oil through HEFA process is also considered as Carbon Offsetting and Reduction Scheme for International Aviation (CORSIA)-eligible fuels, which it can be used as sustainable aviation fuel for aircraft. A number of supply chain planning involving microalgae are also found in recent literature. While crop selection in different continents varies geographically, seasonality also affects feedstock supply, as indicated in the most multi-period mathematical models. This is especially true for the northern hemisphere. Despite being primary world producers of biofuel[37] [1], there are minimal scientific publications on supply chain planning from countries in Southeast Asia region found in the literature, except for[27] [38] who have done extensive operational supply chain research on biomass in Malaysia. However, publication solely focusing on biofuel supply chain with case study characterising biofuel production in this region is missing.
Table 24. Feedstock categorisation.
| Agricultural Residues | Industrial Wastewater | Energy Crops | Microalgae | ||||||||||||||||||||||||
|---|---|---|---|---|---|---|---|---|---|---|---|---|---|---|---|---|---|---|---|---|---|---|---|---|---|---|---|
| CS | MR | WS | RS | CR | BS | WR | PR | SR | MSW | WS | WCO | C | W | S | PO | RO | RSO | SF | J | SG | WB | SGS | M | SFR | GS | MA | |
| [15] | x | ||||||||||||||||||||||||||
| [16] | x | ||||||||||||||||||||||||||
| [42] | x | ||||||||||||||||||||||||||
| [30] | x | x | x | x | x | x | |||||||||||||||||||||
| [31] | x | x | x | x | |||||||||||||||||||||||
| [17] | x | x | x | x | x | ||||||||||||||||||||||
| [37] | NS | ||||||||||||||||||||||||||
| [18] | x | ||||||||||||||||||||||||||
| [32] | x | ||||||||||||||||||||||||||
| [39] | x | x | |||||||||||||||||||||||||
| [40] | x | x | x | ||||||||||||||||||||||||
| [45] | x | ||||||||||||||||||||||||||
| [25] | x | x | x | ||||||||||||||||||||||||
| [38] | x | x | x | x | |||||||||||||||||||||||
| [27] | x | x | x | x | |||||||||||||||||||||||
| [24] | x | x | x | x | x | ||||||||||||||||||||||
| [33] | x | x | x | ||||||||||||||||||||||||
| [43] | x | ||||||||||||||||||||||||||
| [19] | x | x | x | ||||||||||||||||||||||||
| [34] | x | ||||||||||||||||||||||||||
| [47] | x | ||||||||||||||||||||||||||
| [20] | x | x | |||||||||||||||||||||||||
| [46] | x | ||||||||||||||||||||||||||
| [21] | x | x | |||||||||||||||||||||||||
| [28] | x | ||||||||||||||||||||||||||
| [29] | x | x | |||||||||||||||||||||||||
| [44] | x | x | |||||||||||||||||||||||||
| [22] | x | ||||||||||||||||||||||||||
| [23] | x | x | x | x | x | x | x | x | |||||||||||||||||||
| [26] | x | x | x | x | x | x | x | x | |||||||||||||||||||
| [35] | x | x | x | x | x | x | x | x | |||||||||||||||||||
| [36] | x | x | |||||||||||||||||||||||||
| [41] | x | ||||||||||||||||||||||||||
| Agricultural Residues | Industrial Wastewater | Energy Crops | Microalgae | ||||||||||||||||||||||||
| CS | MR | WS | RS | CR | BS | WR | PR | SR | MSW | WS | WCO | C | W | S | PO | RO | RSO | SF | J | SG | WB | SGS | M | SFR | GS | MA | |
| [4] | x | ||||||||||||||||||||||||||
| [5] | x | ||||||||||||||||||||||||||
| [31] | x | ||||||||||||||||||||||||||
| [19] | x | x | x | x | x | x | |||||||||||||||||||||
| [20] | x | x | x | x | |||||||||||||||||||||||
| [6] | x | x | x | x | x | ||||||||||||||||||||||
| [26] | NS | ||||||||||||||||||||||||||
| [7] | x | ||||||||||||||||||||||||||
| [21] | x | ||||||||||||||||||||||||||
| [28] | x | x | |||||||||||||||||||||||||
| [29] | x | x | x | ||||||||||||||||||||||||
| [34] | x | ||||||||||||||||||||||||||
| [14] | x | x | x | ||||||||||||||||||||||||
| [27] | x | x | x | x | |||||||||||||||||||||||
| [16] | x | x | x | x | |||||||||||||||||||||||
| [13] | x | x | x | x | x | ||||||||||||||||||||||
| [22] | x | x | x | ||||||||||||||||||||||||
| [32] | x | ||||||||||||||||||||||||||
| [8] | x | x | x | ||||||||||||||||||||||||
| [23] | x | ||||||||||||||||||||||||||
| [36] | x | ||||||||||||||||||||||||||
| [9] | x | x | |||||||||||||||||||||||||
| [35] | x | ||||||||||||||||||||||||||
| [10] | x | x | |||||||||||||||||||||||||
| [17] | x | ||||||||||||||||||||||||||
| [18] | x | x | |||||||||||||||||||||||||
| [33] | x | x | |||||||||||||||||||||||||
| [11] | x | ||||||||||||||||||||||||||
| [12] | x | x | x | x | x | x | x | x | |||||||||||||||||||
| [15] | x | x | x | x | x | x | x | x | |||||||||||||||||||
| [24] | x | x | x | x | x | x | x | x | |||||||||||||||||||
| [25] | x | x | |||||||||||||||||||||||||
| [30] | x | ||||||||||||||||||||||||||
CS—corn stover; MR—mill residues; WS—wheat straw; RS—rice straw; CR—cotton residues; BS—barley straw; WR—wood residues; PR—palm residues; SR —sugarcane residues; MSW—municipal solid waste; WS—wastewater sludge; WCO—waste cooking oil; C—corn; W—wheat; S—sugarcane; PO—palm oil; RO—rapeseed oil; RSO—rubber seed oil; SF—sunflower; J—Jatropha; SG—sorghum; WB—woody biomass; SGS—switchgrass; M—Miscanthus; SFR—safflower; MA—microalgae; NF—not specified
3. Methods Used in Biofuel Downstream Supply Chain Planning
Bioenergy plays an essential role in promoting clean energy and securing the future energy supply. This rationale leads to increase global trade of biomass or energy carriers from biomass which has been reported by Schlamadinger et al.[38] [48]. Welfle[39] [49] highlighted that the bioenergy strategies of many countries highly depends on future imported resources to balance the demands. Biomass is unevenly distributed in the view of demand and resources availability. Developed countries and the energy policies drive the increasing reliance on bioenergy pathways to meet the energy demand. Some of the countries are facing insufficient biomass stock to meet the demand, but there are also countries with the potential supply that significantly exceeds the demand. An international biomass supply chain is vital to promote natural symbiosis. Junginger et al.[40] [50] provide a comprehensive discussion on international bioenergy trade, including the drivers and barriers as well as developments in liquid biofuel trade. Europe is one of the prime markets for the trade of biomass for energy generation, with wood pellet as the main substrate (see Figure 3). Lamers et al.[41] [51] show that Brazil is the leading exporter of bioethanol while the United States, Argentina, Indonesia and Malaysia are the major exporters of biodiesel. Based on the forecast by IEA[37] [1], biofuel output is anticipated to reach 1.9 x 10¹¹ L (+ 24%) by 2024, owing to better market prospects in Brazil, the United States and China. Asia is expected to lead to biofuel production growth.
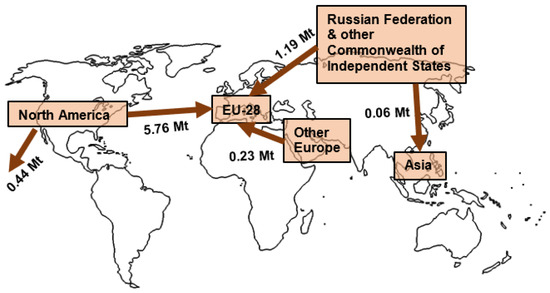
Figure 3. Wood pellet trade flows, adapted from World Bioenergy Association[42].
Wood pellet trade flows, adapted from World Bioenergy Association [52].
Downstream biofuel supply chain planning and management are subjected to a higher level of uncertainty, especially when it involves international trading. The objective function is generally the same as the upstream assessment, where economic and/or environmental aspect is optimised. Physical trade of biomass is not always the optimal solution due to international logistics, which increase the cost and environmental footprints. Laurijssena and Faaij[43] [53], however, suggest that trading biomass is preferential than trading GHG emission credits. Other than the transporting distance, which is the main supply chain issue, the international trade (macro perspective) is affected by incentive-policy (e.g., the EU’s Renewable Energy Directive) context and trade tariffs (both import and export tariffs)[44] [54]. The reliability of the assessment results is relying on the accurateness of projection/ prediction as well as the assumptions. The assessment model is usually supported by a range of scenarios representing the optimistic and pessimistic situation. Welfle[39] [49] applied the biomass resource model to evaluate the biomass potential in Brazil. The trading possibility is determined by the availability of the resource, considering the remaining land area, the potential of resource collection, competing for a market of biomass utilisation as well as the conversion pathway. Deng et al.[45] [55] conducted similar research to identify the potential of trading (import and export) based on resource availability but covering a more extensive range of feedstock and countries. The yield gradient, land-use change and technology development are varying to identify the biofuel potential. The estimation potential for the global scale ranges from 40 to 190 EJ final energy in 2070 where Brazil and Russia are recognised as the prominent exporters, while India and Nigeria are substantial importers. The forecasts mainly identifying the biomass potential rather than the biomass allocation, which considering the detailed costing, travel distance and available market. Lamers et al.[46] [56] assess the potential import streams and supply costs under different sustainability constraints based on a bottom-up global trade model. Figure 4 shows the modelling framework which combining the biomass transport model and biomass allocation model. This modelling considered temporal and logistical determinants without neglecting the market development and time aspects (e.g., delay), where the biomass allocation is suggested.
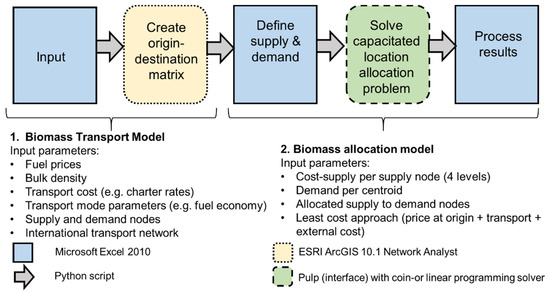
Figure 4. The integrated modelling framework for international biomass (to energy) trade adapted from by Lamers et al.[46] [56].
The review by Diesenreiter and Kranzl[47] [57] suggested that no customised models are available for incorporating global import/export potentials and international trade. The evaluated approaches in the review study are divided into basic modelling approaches for analysing the macroeconomic effect of international trade, computable general equilibrium models and geographic information system. A similar conclusion has been drawn by Solberg et al.[48] [58] in a study for IEA bioenergy task 40 where none of the existing models is capable of performing good analyses of international trade of biomass and bioenergy products. Figure 5 summarises the assessed models in both studies in identifying the weakness and strengths. There is a common characteristic where all the presented models are customised more to the case of the EU. Green-X model[49] [59], which allows the consideration of different energy policy instruments is also for the application of the European level. The gravity model of trade[50] [60] is among the standard model in predicting bilateral trade flows according to the economic sizes and distance between two units despite the argument on the identified results[51] [61]. Röttgers et al.[52] [62] analyse the effect the EU imposes on the trade of the biofuel commodities and identify the drives (e.g., trade regulation or bioenergy regulation) of biofuel trade. The assessment suggests that EU trade integration has no enabling effect on canola oil trade where the import from outside of the EU is preferable. The result warrants a closer look at the political measures and its effectiveness, especially the green investment subsidy. However, other factors such as economies of scale, resource scarcity and value chain structure have to be taken into account as well for a conclusive picture.
Rentizelas et al.[53] [63] stressed the need for a decision support tool to facilitate the supply chain design rather than assessing the supply chain of specific origin and destination location. A multicriteria tool based on data envelopment analysis which considers the environmental impact and cost is conducted to identify the efficiency of alternative pathways (Up to 56 pathways between Brazil and the UK) of international biomass supply chains are developed. Three models for bioenergy trade analysis, include TIMER (dynamic energy system model), GFPM (spatial partial equilibrium model based on price endogenous linear programming) and POLES (dynamic partial equilibrium model), have been reviewed by Matzenberger et al.[54] [64]. It was concluded that further integration of international bioenergy trade, emerging barriers and drivers into the existing models is essential for a more realistic answer regarding the future role of the bioenergy system.
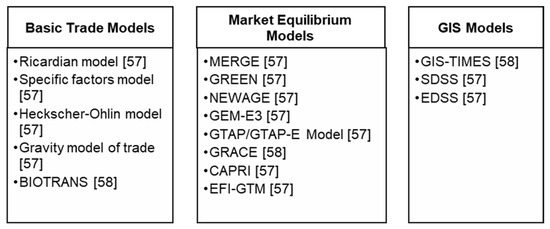
Figure 5. Model for international trade of biomass for energy. Please refer to Diesenreiter and Kranzl[47] [57] and Solberg et al.[48] [58] for the detailed discussion on each approach.
Maximising the economic performance is the common objective function in most of the models. However, the trade-offs between economic and environmental performance as well as the other factors have to be also considered. Total footprints-based multi-criteria optimisation is proposed by Čuček et al.[55] [65] to consider the economic performance, environmental footprint as well as the social footprint in determining an optimal regional biomass energy supply chain. Jonkman et al.[56] [66] propose a decision support tools with the advantages that it can take into account the goals of individual actors of the supply chain than only optimising the economic and environmental performance. This is a significant development and beneficial for supply chain with the involvement of different countries. The multicriteria approach is potential to adapted for global supply chain problem, although it is demonstrated through a case study in the Netherlands. Lee et al.[57] [67] proposed a global supply chain optimisation framework supported by two-stage stochastic linear programming model (TRMISP) to identify the supply chain design (Southeast Asia to Europe and North America) under the price and demand uncertainty. This is important as uncertainties are one of the main challenges in modelling and optimisation of the international supply chain. Transfer pricing, currency exchange and taxation rates have to consider in the global supply chain planning. The studies which include one or more of the factors include de Matta and Miller[58] [68] (Transfer price- generalised Benders decomposition approach), and Gonela et al.[59] [69] (Tax-credit- stochastic mixed-integer linear programming model). Razm et al.[60] [70] proposed a multi-objective mathematical model with the aids of GIS to design a global sustainable bioenergy supply network. This is a comparatively comprehensive model which considered all the crucial components at the international level.
The methodological challenges such as uncertainties of international statistics, inconsistent data on trade volumes and final use of traded products[61] [71] persist despite advancing. It is expected to enhance the development of IoT and big data in the near future. Fingerman et al.[62] [72] assessed the opportunities and risks for sustainable biomass export, particularly to Europe from the South-Eastern of United States. The long-term strategies assessment by Pelkmans et al.[63] [73] for European bioenergy markets considered North America, South America, East Europe, Africa and Southeast Asia as the potential sourcing regions. It is concluded that policies should be stable and consistent within a long-term vision. Macro perspective assessments specifically done for Asia countries are generally lesser, especially compared to EU and South America. It deserves more research attention by adapted to the localised condition and forecast towards a close to the optimal global solution. Different approaches can be fitted for solving the problem related to international biofuel trade by integrating to the existing energy models. However, the considered variables are not consistent for a robust solution, and data availability for modelling is still one of the critical issues.