A time series is a succession of data ordered chronologically in defined time intervals. The data may be evenly spaced, such as the record of daily solar generation from a photovoltaic plant, or it may be different, such as the number of annual earthquakes in a defined area. This type of representation offers many advantages because its analysis allows us to discover underlying relationships in the data, which can be from various time series or within the data itself. These can be used to extrapolate behavior in the past, during periods of data loss, and in the future.
1. Introduction
Managing the energy produced to support industries and various human activities is highly relevant nowadays. Companies in the electricity markets of each country analyze the generation, transmission, and distribution of energy to meet the energy needs of various sectors and industries. Electrical markets emerge to economically analyze everything related to energy generation, transmission, and distribution. The demand for electric energy is crucial in determining the amount of energy needed to meet the requirements of an individual or a group of consumers.
Electric power has been one of the most significant driving forces for humanity since the late 18th century (see
[1]). Currently, every industry relies on electricity, creating a significant need to effectively manage the energy generated in order to sustain and advance all human activities that depend on its use. Electrical markets emerge to economically analyze all aspects of energy generation, transmission, and distribution (see
[2]). One purpose of electrical markets is to satisfy all the energy needs of each sector and industry
[3]. An essential variable for understanding this behavior is the demand for electric energy
[4]. This information indicates the amount of energy required for an entity or a series of consumers to meet their needs
[5].
Since human activities are influenced by various external factors, the demand for energy is not exempt from these influences. Analyzing and understanding energy demand is essential for the development of the energy sector
[6][7][6,7]. That is highly relevant for the field of energy generation
[8], where this last activity is still carried out for most non-renewable resources. Oil (32.89%), coal (29.16%), and natural gas (23.40%) are the three most used energy sources in the world
[9]. This characteristic shows the necessity of developing models that enable demand forecasting. By doing so, it would facilitate improved management of energy generation and consumption.
When analyzing the electricity demand as a time series and observing its evolution over time, the researchers can discover interesting patterns and behaviors
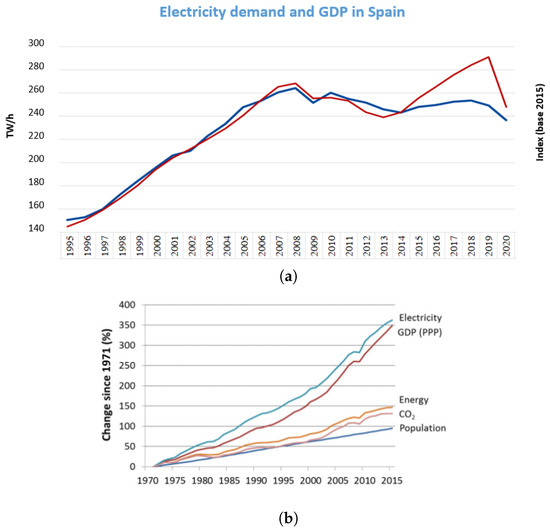
[10]. The growth over the years can be attributed to the development of industries, population, technology, and economic development (see
Figure 1). On the other hand, if the demand is analyzed with values recorded per hour, an increase is observed during the day and a reduction is observed at night. This indicates a close relationship between this variable and the development of work and daily activities
[11]. However, when analyzing the demand during this recent period, some records do not adhere to this pattern on multiple occasions and even exceed the maximum values recorded in previous days. As previously mentioned, the demand depends to a large extent on the development of human activities, which are influenced by a wide range of factors. These factors often exhibit stochastic behaviors, such as electrical system failures, events with high attendance, the economic evolution of the industry, and climate changes, among others. Hence, the demand often exhibits random behavior, making it challenging to analyze when developing forecast models
[12].
Figure 1. Increase in energy demand, population, electric consumption and CO
2 2 from 1970 to 2015. (
a) The increase in energy demand and Spanish GDP, an economic value, shows how demand increases as the economy grows
[13]. (
b) Evolution of population, electricity consumption, and CO
22 emissions in the last decades
[14].
Due to these characteristics and the significance of demand, numerous systems have been developed to forecast this variable using various techniques, including supervised machine learning, deep learning, and autoregressive systems
[15][16][17][15,16,17]. Among all the regression models, the utilization of fuzzy series has shown superior performance in this field
[18][19][18,19]. Besides their diversity, these models facilitate the smooth integration of information from related variables. This is because their training process thoroughly analyzes the relationships between the processed variables
[20].
2. Time Series
2.1. Fuzzy Logic and Fuzzy Time Series
Fuzzy logic is a form of paraconsistent logic (a logic system that handles contradictions in a weakened manner) that does not categorize all statements as completely true or false. This is the primary distinction from classical logic (see refs.
[21][22][23,24]). Fuzzy logic allows for an interesting approach to decision problems because, in the real world, it is impossible to abstract everything into a binary system
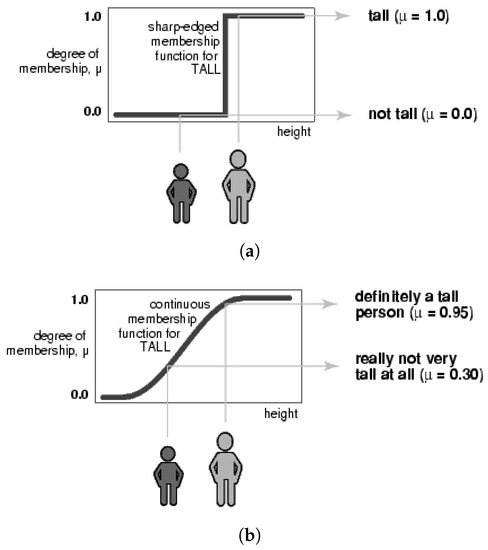
[23][25]. For example, let’s consider a dataset that records the heights of people in order to determine who is tall or short (see
Figure 23). The researchers can use the value of 1.70 m as the dividing point: individuals with a height equal to or greater than 1.70 m are considered tall, while those with a height lower than 1.70 m are considered short. With standard logic, it is assumed that all the data will fall into one of these categories; however, would it be accurate to classify someone with a height of 1.69 m as small or 1.71 m as tall?
Figure 23. Differences between the association of the height to the sets of tall and short through classical logic (a) and fuzzy logic (b), the x-axis in both examples corresponds to the height. In contrast, the y-axis corresponds to the membership degree.
Fuzzy logic allows for the establishment of a degree of membership among the defined sets. This means that variables can belong to more than one set
[24][26]. Fuzzy logic operates on fuzzy sets, which have values in a range of [0, 1] instead of binary terms. These values are determined by the membership function of a set for each element that belongs to the universe of discourse
[25][27]. Thus, a fuzzy set
A is characterized by its membership function in Equation (
1).
As its name indicates, a fuzzy time series corresponds to a time series that utilizes fuzzy logic to transform each value of the series into elements that belong to fuzzy sets
[26][28]. A time series in the fuzzy domain further enhances the analysis of the series by applying fuzzy set relationship analysis to the original data
[27][29].
2.2. Universe of Discourse
In fuzzy time series, the universe of discourse represents the range of values that certain time series elements can take, which in turn represents a specific phenomenon
[28][30]. For example, if there is a time series with values
𝑌∈ℝ, the universe of discourse
U would be defined as
𝑈=[min(𝑌)−𝑚,max(𝑌)+𝑚], where
m represents a margin that allows for the inclusion