Your browser does not fully support modern features. Please upgrade for a smoother experience.
Please note this is a comparison between Version 1 by Andrzej Budziak and Version 2 by Camila Xu.
Laves phases crystallize in simple structures and are very common intermetallic phases that can form from combinations of elements throughout the periodic table, giving a huge number of known examples. A special feature of AB2 or AB5 phases is the ability to absorb hydrogen.
- metal hydrides
- Laves phases
- hydrogen storage
- X-ray diffraction
1. Introduction
1.1. Laves Phases
One of the most widespread and most studied groups of solids is the metallic phases. These phases are divided into simple phases (metallic elements), solid solutions and intermetallic phases. Solid solutions include substitution and interstitial solutions. Interstitial solutions are formed when relatively small atoms of a solute element do not occupy atomic positions, but positions in the interstitial voids of the solvent. A characteristic feature of solid solutions is that they retain the crystallographic structure of the solvent. Intermetallic phases assume crystal structures different from those of the individual components of the phase. In general, intermetallic phases are described by the formula AnBm and are divided into the following types according to the adopted classification [1][2][3][1,2,3]:
-
Phases with a dense filling of space (Laves phases), which are classified according to the size of atoms/ions;
-
Electronic phases, which are classified according to the electron concentration, i.e., the ratio of the number of valence electrons to the number of atoms in the unit cell;
-
Phases with mixed, metallic-ionic and metallic-covalent bonds.
The most important properties of the Laves phases include the following:
-
They are metal alloys with the general stoichiometric formula AB2;
-
The main factor influencing their formation is the ratio of the radii of the component atoms, and rA/rB is equal, theoretically, to 1.225. In fact, this ratio for the Laves phases is within the range of 1.05–1.68 Å. Here, A refers to larger atoms (e.g., rare earths), and B refers to smaller atoms (e.g., Cu, Zn, Fe, Mn, Cr, etc.);
-
They do not create secondary solutions;
-
They exhibit an almost purely metallic type of bonding;
-
They are phases with the densest space filling;
-
They crystallize in one of three homothetic types, C14, C15 and C36, as determined by the value of the electron concentration [4].
The RMn2 intermetallic compounds crystallize either in the hexagonal C14 type for R = Pr, Nd, Sm, Ho, Er, Tm and Lu or in the cubic C15 type for R = Y, Sm, Gd, Tb, Dy and Ho [5][6][7][8][9][10][11][12][13][14][5,6,7,8,9,10,11,12,13,14]. Other elements (A: La, Ce, Eu and Yb) do not form stable intermetallic compounds with Mn [15].
1.2. Structural and Magnetic Properties of RMn
2
Compounds
The RMn2 compounds have been widely studied because of their very interesting structural and magnetic properties. Changes of the unit cells for RMn2 as a function of the temperature are presented in Figure 1a [16]. For the (Tb, Gd, Sm, Nd, Pr, Y)Mn2 compounds, the first-order phase transition is observed, and temperature dilatometer and X-ray diffraction measurements revealed significant increases in the volume of unit cells of these alloys at temperatures below 105 K. The magnetic ordering was also observed below the temperatures of the structural changes [17][18][19][17,18,19]. The largest, an almost 5% change in volume, was recorded for YMn2. This significant magneto-volume effect is related to the appearance of a well-localized magnetic moment in the Mn sublattice (~2.7μB) below the magnetic ordering temperature [20]. The (Er, Ho, Dy)Mn2 compounds do not show changes in the volume cell; they undergo a second-order phase transition in the temperature range of 15–35 K [14][21][14,21].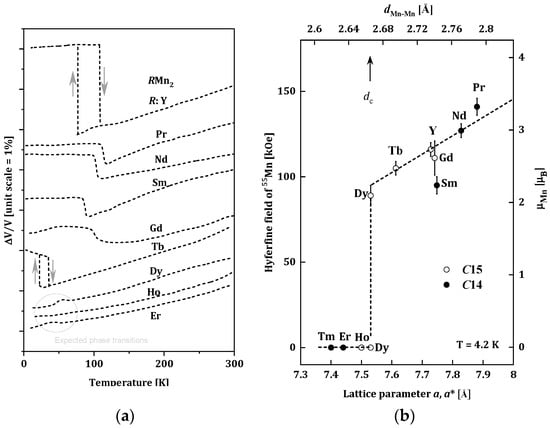
Figure 1. (a) Changes of the unit cells for RMn2 as a function of the temperature for RMn2 [16]; (b) Relation between the 55Mn hyperfine field Hself and the lattice parameter of RMn2 at 4.2 K. The transferred hyperfine fields from rare-earth moments are subtracted from the observed ones. The effective lattice parameter of C14 compounds (closed circles) is given by aeff = (3a2c)1/3. The scale for the estimated Mn moment from Hself is given on the right-hand side [22].
-
dMn-Mn < dc, (LuMn2, ErMn2, TmMn2), where the Mn subnet is non-magnetic, and the Er and Tm sublattices are ferromagnetic [24];
-
dMn-Mn > dc, (NdMn2, PrMn2), where the dominant Mn magnetic sublattice is stable and enforces antiferromagnetic ordering in the sublattice of R-atoms with the R-Mn type interaction [25];
-
Between 3d–3d magnetic moments (Mn–Mn),
-
Between 3d–4f moments (Mn–R),
1.3. Hydrogen in Metals
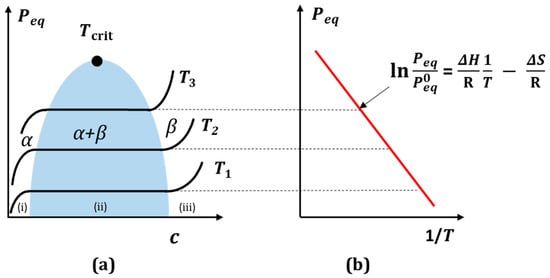
Rare earth (R) metals react with hydrogen forming stable di- and trihydrides. The RH2 dihydrides are very stable, with reported formation enthalpies of about −200 kJ/molH2; thus, they decompose in a vacuum, releasing hydrogen and forming individual RE metals at very high temperatures only [36]. On the other hand, manganese, which is also the main building block of the discussed RMn2Hx structures, behaves differently under the influence of hydrogen in comparison to RHx. At ambient pressure conditions and room temperature, the subhydride Mn2H is the only stable compound. With increasing pressure, MnH is stabilized, and then hydrogen-rich hydrides appear at higher pressure [37]. A simplified scheme of hydrogen penetration into the crystal structure of the metal (intermetallic compound) can be divided into three stages (Figure 2): (a) Physisorption: gaseous hydrogen molecules interact with electrons on the metal surface using weak attractive van der Waals forces; (b) Chemical adsorption: hydrogen molecules dissociate, overcoming the surface energy barrier, and form a metallic hydrogen bond; (c) Absorption: in this step, the chemisorbed hydrogen atom can jump to the subsurface layer to finally diffuse through the crystalline structure of the metallic host [38].
Figure 2. Simplified mechanism of hydrogen absorption in metal. (a) Physical adsorption: hydrogen molecules adhere to the metal surface, forming several layers; (b) Chemical adsorption: dissociated hydrogen molecules of the layer in direct contact with the metal form chemical bonds with it; (c) Absorption: hydrogen atoms diffuse into the parent metal lattice.
2. RMn2Hx Hydrides
2.1. Localization of Hydrogen
The physical properties of rare earth hydrides with manganese RMn2Hx largely coincide with the properties of metal hydrides (MHx). Also, alloys of RMn2 compounds absorb hydrogen very easily. At close to atmospheric hydrogen pressure and temperatures above 100 °C, it is possible to achieve a hydrogen concentration of ~4.5 H/f.u. [47][48]. As noted in metal hydrides, hydrogen occupies the interatomic sites of the elements that comprise the RMn2 unit cell. There are three types of tetrahedral sites in RMn2 compounds: A2B2, AB3 and B4, where A and B represent atoms of R and Mn, respectively, surrounding the site (Figure 4). The largest and at the same time most willingly filled by hydrogen site (below x ≈ 3.5 H/f.u.) is the A2B2 type. For x ≳ 3.5 H/f.u., there is also a tendency to fill smaller sites, such as AB3 sites [48][49][50][51][49,50,51,52]. However, no B4 site filling was observed. The same types of sites occur in both C14 and C15 types of Laves phases. When filling the sites, hydrogen occupies crystallographic positions (Table 1).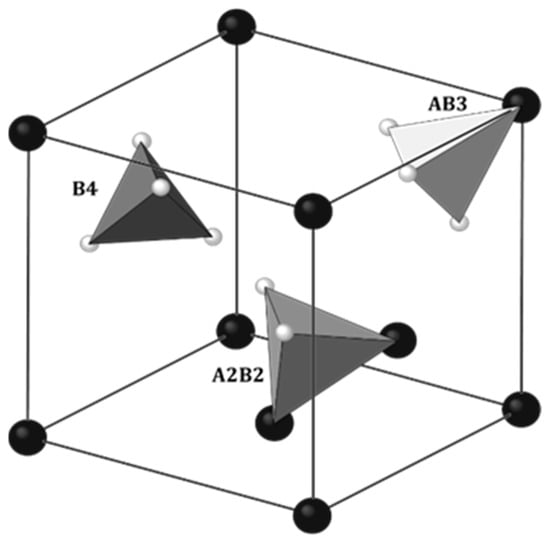
Figure 4. Three crystallographic positions accessible for hydrogen in C15 Laves phase: 96g (inside of A2B2 tetrahedra), 32e (inside of AB3 tetrahedra) and 8b (inside of B4 tetrahedra). The Fd3𝑚3¯� space group. Some atoms were removed for clarity. Big, dark balls: R; small, bright balls: Mn. Based on [50][51].
Table 1.
Hydrogen positions in C14 and C15 phases.
| Laves Phase | Positions of Hydrogen | Number of Sites/f.u. | ||
|---|---|---|---|---|
| A2B2 | AB3 | A2B2 | AB3 | |
| C14 | 24l, 12k, 6h1, 6h2 | 12k, 4f | 12 | 4 |
| C15 | 96g | 32e | ||
2.2. Sample Preparation and Dependence of ΔV/V versus Hydrogen Content
In the discussed hydrides, the sample preparation was similar and usually involved the following scenario. The host materials (RMn2) were prepared from high purity elements using the standard induction melting technique under argon atmosphere. Next, materials were usually annealed to obtain a single-phase compound. The RMn2 samples were saturated with hydrogen using a standard volumetric method (Sievert) to obtain RMn2Hx hydrides in the typical range of x: 0 < x < 4.3–4.5 [7][8][9][54][61][62][63][64][65][66][7,8,9,55,62,63,64,65,66,67]. The first test after hydrogen saturation was XRD measurements at 300 K. As a representative example, the HoMn2Hx_C15 diffractogram is presented in Figure 5a. The most visible effect of hydrogen absorption by the sample is the shift of the diffraction lines towards smaller angles (in 2 theta), which means an increase in the distance between atoms in the cell, and consequently an increase in the unit volume of the cell with x.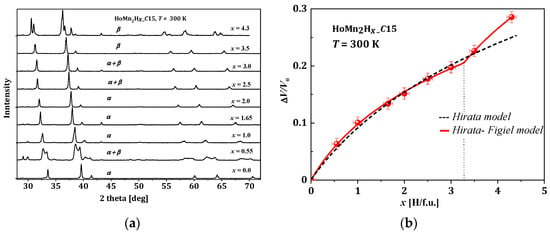


Table 2.
Fitted parameters for the Hirata-Figiel model.
| Sample | B0 | b | Xc | P |
|---|---|---|---|---|
| YMn2Hx (300 K) * | 9.24 | 9.63 | 3.25 | 0.77 |
| DyMn2Hx (300 K) * | 7.03 | 9.08 | 3.20 | 0.61 |
| GdMn2Hx (300 K) * | 9.43 | 10.01 | 3.06 | 0.52 |
| TbMn2Hx (300 K) * | 7.78 | 9.36 | 3.15 | 0.56 |
| HoMn2Hx (300 K) * | 6.93 | 8.90 | 3.33 | 0.88 |
| HoMn2Hx_C14, (300 K) ** | 4.7(6) | 13(1) | 3.48(3) | 0.9(1) |
| HoMn2Hx_C14, (75 K) ** | 6.1(2) | 9 (1) | 3.41(3) | 0.8(1) |
| HoMn2Hx_C15, (300 K) *** | 6.0(5) | 10(1) | 3.2(1) | 0.6(1) |
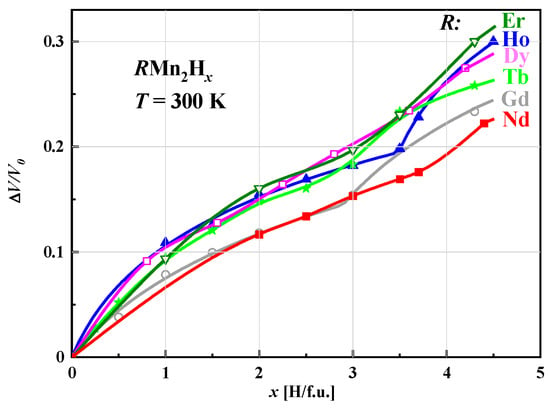
Figure 6.
Comparison of relative volume change in unit cells for
R
Mn
2
H
