Carbon dioxide (CO2) and other greenhouse gases are the main causes of global climate change. This phenomenon impacts natural and human systems around the world through the rising global average surface temperature, extreme weather, changes in precipitation patterns, rising sea levels, and ocean acidification. However, this concept is alien to most people in developing countries. They are also unaware of the connection between energy efficiency and climate change. This dearth of knowledge makes them opt for highly inefficient appliances. Internet of Things (IoT)-based visualisation platforms for tracking household carbon footprints (CFs) have been seen as a good concept for combating this global phenomenon; however, there are potential challenges and ethical restrictions that must be addressed when implementing platforms for tracking household CFs.
- carbon footprints
- climate change
- Internet of Things (IoT)
- visualisation platform
- energy efficiency
1. Introduction
2. IoT-Based Visualisation Platforms for Tracking Household Carbon Footprints
2.1. Carbon Footprint Tracking and Reduction
2.1.1. Carbon Footprint Calculators
2.1.2. Energy Efficiency
2.1.3. Renewable Energy (RE)
By switching to renewable energy sources, for instance, biomass, solar, and wind, people can lessen their CO2 emissions. Additionally, governments and utilities may offer incentives for installing renewable energy systems, and some businesses are beginning to adopt renewable energy as part of their sustainability efforts. Zheng et al. [17][13] explored how China’s renewable energy development can help cut carbon emissions. China, the top emitter of CO2 worldwide, is under intense pressure to reduce emissions. Therefore, the study targeted the assessment of how renewable energy (RE) growth contributes to emission reductions. The authors used inter-provincial panel data from 2008 to 2017 to analyse this association using a quantile regression model and path analysis. The results highlight three key points related to renewable energy and carbon emissions: inhibitory, varying, and indirect effects. The development of RE has had a positive outcome in reducing CO2 releases. Studies show that for each 1% rise in RE, there is a corresponding reduction in carbon intensity of 0.028% to 0.043%. The impact varies with the carbon intensity level, but indirect effects are prominent. Energy intensity and per capita gross domestic product (GDP) show the link between RE development and emission reductions. These findings have implications for policymakers in China. They emphasise the importance of considering different carbon emission levels, which can be used to design effective strategies for promoting renewable energy and achieving emission reduction targets [17][13].2.1.4. Sustainable Transportation
A significant source of carbon emissions is the transportation sector. Thus, encouraging sustainable transportation (ST), such as walking, biking, public transit, and electric vehicles, can significantly reduce carbon emissions. Governments and businesses can promote ST through infrastructure investments, incentives, and education campaigns. Lopez and Crozet [19][14] focused on the issue of transport’s contribution to CO2 releases and environmental effects. The paper evaluated possible solutions to meaningfully lessen CO2 discharges in the French transport sector. This approach involves creating scenarios by backcasting using long-term transportation problem models. In this study, the author considered three scenarios and analysed the impact of technological advances and various public policies on CO2 emission reduction. The document also provides valuable information on infrastructure investment needs and potential changes in transport budgets (financial and temporary) in each scenario. The three scenarios presented are as follows:- i.
-
Pegasus scenario: This scenario promotes adopting strict technology standards to reduce emissions.
- ii.
-
Chronos scenario: This scenario focuses on promoting green multimodalities, which involve integrating different modes of transport in an environmentally friendly manner.
- iii.
-
Hestia scenario: This scenario emphasises decoupling transport growth from the overall gross domestic product (GDP) growth.
2.1.5. Waste Reduction
Reducing waste helps reduce the CFs linked to the production, transportation, and disposal of goods. Strategies for waste reduction include recycling, composting, and reducing the use of single-use products. Many municipalities offer recycling and composting programmes, and businesses can implement waste reduction strategies through sustainable supply chain management. Elgaaied-Gambier et al. [21][15] focused on reducing the impact of the Internet on the environment. According to the study, individuals in society are not wholly mindful of the effect of their online environmental events and tend to hold companies and authorities responsible instead of themselves. Though they wish to protect the environment, they hesitate to change their habits. The research shows that people are more likely to take responsibility for reducing their digital footprints when they understand the severity of the environmental consequences. The perceived difficulty of making behavioural changes has a smaller impact on their sense of responsibility. The study found no significant interaction between perceived severity and perceived sacrifice. In conclusion, the research highlights the importance of increasing consumer awareness and addressing their perceptions of responsibility to promote eco-friendly online behaviour [21][15].2.1.6. Carbon Offsets
For example, investing in reforestation and renewable energy programmes can aid in reducing carbon emissions. Individuals and organisations can purchase carbon offsets to offset their CFs. It is crucial to verify the transparency and legitimacy of carbon offset projects to ensure that they effectively reduce emissions. Hernandez and Vita [23][16] conducted a study to analyse household consumption’s CF in the Guadalajara Metropolitan Area (MAG) and identify socio-spatial inequalities in emissions. It is worth noting that a recent study found that domestic conspicuous consumption accounts for over 65% of worldwide GHG emissions. The study recognised a gap in emission reduction strategies implemented by governments under the Paris Agreement, as they primarily focus on production-based accounting, which overlooks the emissions associated with trade, consumption, and social inequalities. The researchers employed accounting analysis in suburban areas to address this gap, leveraging the 2018 Mexican Consumer Expenditure Survey and Environmentally Extended Multiregional Input–Output data. A new tool called a carbon tracker has been developed to track and forecast the energy and CF associated with deep-learning model training [26][17]. The tool aims to raise awareness among practitioners about the environmental impact of training deep-learning models and promote responsible computing in machine learning. The authors provide a comprehensive overview of related investigations in this area and propose the carbon tracker as a medium for tracking and predicting energy and CFs during the training of DL models. The tool’s design principles and multithreaded implementation make it easy to integrate into existing workflows. However, further research is needed to evaluate the tool’s performance across a broader range of deep-learning architectures and applications. A study on the CF of the American University of Sharjah (AUS) [27][18] highlights electricity consumption and university commute as key contributors to CO2 emissions. The research offers recommendations for reducing emissions that could serve as a baseline for other regional universities. Collecting accurate data on energy consumption, water usage, and transportation can be challenging, and assigning responsibilities for indirect emissions from commuting, procurement, and waste management is complex. Choosing an appropriate baseline timeframe and implementing emission reduction strategies can be difficult due to financial constraints, institutional resistance, and a lack of stakeholder engagement. A comprehensive sustainability assessment should consider multiple dimensions beyond carbon emissions.2.2. IoT-Based Monitoring Systems
IoT-based monitoring systems have significant potential to control carbon emissions. These systems enable organisations and individuals to track their CF (as shown in Figure 31), identify emission reduction opportunities, and make informed decisions about energy usage [28,29][19][20].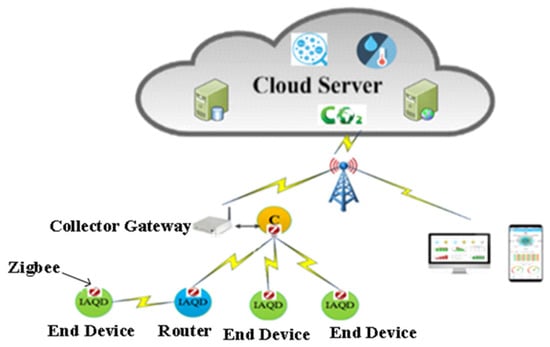 Figure 31.IoT-based monitoring system architecture.Benammar et al. [30][21] created an IoT platform that monitors real-time indoor air quality. This includes standards for various sensor technologies, wireless sensor networks (WSNs), and smart mobile devices. A nearby gateway handles and distributes data through a web server to users. The system uses Emoncms to store indoor air quality monitoring (IAQM) data for immediate and long-term monitoring. The study enables the measurement of various air quality parameters, including relative humidity, ambient temperature, CO, CO2, NO2, O3, SO2, and Cl2. The research highlights the potential of IoT-based monitoring systems in carbon emission control, particularly in indoor environments [30][21].Key advantages of IoT-based monitoring schemes are their ability to collect and analyse statistics in real time. This allows organisations to respond quickly to changes in energy use and make adjustments as needed. For instance, a smart building system can monitor energy use and automatically adjust lighting and heating based on occupancy and ambient light levels.Employing a Raspberry Pi, Sruthi et al. [33][22] implemented an IoT-based system that monitors and controls CO2 emissions from municipal transport, industries, and forest fires. The system senses CO2 levels in a city and finds the most polluted areas. In addition, a smart system will be put in place for the early detection of forest fires. The authors suggest extending their system to detect other harmful gases. They conclude that their system can help reduce global warming by monitoring and controlling CO2 emissions in real time. An outstanding benefit of IoT-based monitoring systems is their ability to provide detailed insights into energy use patterns [34][23]. By analysing data from sensors and other sources, organisations can identify areas where they can make changes to reduce their CFs. For instance, they may identify specific equipment or processes that consume more energy than necessary or times of the day when energy use is exceptionally high. Overall, IoT-based monitoring systems have the potential to be powerful tools for carbon emission control.
2.3. Visualisation Platforms for Tracking the Carbon Footprint
Several visualisation platforms can help track and visualise CF data. Some of the popular options are described below.2.3.1. Carbon Analytics
Carbon Analytics is a cloud-based platform that provides tools for tracking and analysing carbon emissions. It allows for collecting and managing energy consumption, transportation, waste, and more data. In addition, the platform offers interactive dashboards and reports that allow an organisation to easily understand its CF.2.3.2. Climate View
Climate View is a data visualisation platform representing an organisation’s CF. It allows emission tracking across different sectors and visualises the impact of various mitigation strategies. Ytreberg et al. [35][24] researched digital climate nudges. Nordic online food retailers used to encourage climate-friendly food choices. In the study, scholars categorised nudges into three categories: decision-making information, structure, and support. These nudges aim to make decision making easier for customers and decrease the amount of mental effort required. Examples of decision structure nudges include prominently displaying low-emission products and recipes. CF apps and climate labels are commonly used as decision information nudges. However, the study reveals that non-salient nudges have a limited impact, and there are difficulties in calculating product footprints. Additionally, the absence of industry norms for emission data and labelling makes it difficult for clients to compare emissions from different stores [35][24]. Heydarian and Golparvar-Fard [36][25] studied a framework for monitoring construction operations that was proposed to control productivity and the CF. An automated visual sensing technique was used to track construction equipment, increasing productivity and reducing the CF. To improve productivity and cut CF emissions, project managers were able to monitor their activities in real time using the framework and make adjustments to the construction plan and operation methods. The authors suggested that this approach could significantly impact the current construction practice and its adherence to Environmental Protection Agency (EPA) regulations on construction GHG emissions. Similarly, Zaman and Jhanjhi [37][26] created a novel platform utilising a range of sensors to offer intelligent contracts to minimise carbon emissions. This is achieved through data visualisation, industrial control, and activity mapping. The developers used a qualitative approach, including document analysis, to assess the feasibility of using blockchain technology in carbon trading. According to the authors, blockchain technology can effectively address existing issues within carbon trading systems and provide a just and effective solution. An indoor air quality monitoring and control system (IAQMC) was developed by Zhao et al. [39][27]. This groundbreaking system uses IoT technology and fuzzy inference. It includes a new Fuzzy Air Quality Index (FAQI) model for assessing IAQ and a Simple Adaptive Control Mechanism (SACM) that automatically adjusts the IAQMCS based on the real-time FACI value. The results demonstrated that the method accurately measures multiple air parameters and performs excellently in assessment precision, the average FAQI score, and overall IAQ. A Carbon, Health, and Savings System (CHSS) was proposed in [43][28]. The authors interviewed experts in various fields to gather information and opinions on designing and implementing a personal carbon-trading system. The CHSS would integrate technical know-how, markets, and encouragement to reward individuals for dropping GHG emissions. The authors propose a minimum viable product approach to implementing the CHSS in stages. The article concludes that personal carbon trading could complement existing carbon pricing policies by providing psychological framing and feedback for individual consumers.2.3.3. PowerDash
PowerDash is an energy management platform that tracks and visualises energy consumption and carbon emissions. It provides real-time data on energy use and allows goals to be set and progress to be tracked toward reducing CFs. Magtibay et al. [45][29] developed “Green Switch,” an IoT-based energy-monitoring system for the Mabini Building at De La Salle Lipa. The system controls room lights and power outlets, calculating the total kWh consumed. It uses NodeMCU, sensors, a Raspberry Pi 3, and the school’s network. The building administrator can evaluate consumption stats and reduce the CF. A user-friendly web app was also developed for easy access [45][29].2.3.4. Energy Elephant
Energy Elephant is an energy management platform that helps organisations track and reduce carbon emissions. It provides various tools for monitoring energy use and carbon emissions and offers customisable reports and dashboards to help visualise and understand the CF. Ramelan et al. [9] built a low-cost IoT system employing LoRa and MQTT to monitor and control building energy. The system includes energy sensors, a microcontroller, a LoRa-WiFi module, and a gateway. Nodes equipped with Arduino Uno and sensors communicate with an IoT cloud server via Dragino LoRa Gateway LG01-N. The system optimises energy consumption and uses the open-source Thingspeak platform for data visualisation and device control; the study showcases a cost-effective approach to building energy management using IoT technology. The accuracy errors for voltage, current, and power sensors were 1.24%, 2.60%, and 3.13%, respectively [9].2.4. IoT-Based Visualisation Platforms for Tracking the Household CF
IoT-based visualisation platforms for tracking household CFs are becoming increasingly popular as people become more aware of the effects of their daily activities on the environment. Energy and water usage and other environmental aspects can be tracked through these platforms thanks to the IoT devices that monitor them. One instance of an IoT-based visualisation platform is the Carbon Track system. This system uses IoT sensors to monitor the energy usage of various appliances in the household, as well as the amount of water consumed and the temperature and humidity levels inside the home. The data collected by the sensors are transmitted to a cloud-based platform, processed and analysed, and then presented to the user in a simple and intuitive dashboard. Ming et al. [46][30] worked on IoT-based and cloud-based technologies for real-time CO2 monitoring. The approach in thise paper is considered a highly effective solution for monitoring environmental CO2 levels. It is seamlessly integrated with IoT and cloud computing technologies. The techniques mentioned earlier can provide readily available and up-to-date data visualisation, which can greatly enhance the efficiency of analysis and the deployment of counter-measures for smart homes. A monitoring system was created to collect, store, and display CO2 concentration data using a CO2 sensor labelled MQ135, a Wi-Fi module labelled ESP8266, the Firebase Cloud Storage Service, and Carbon in a mobile application (app) for visual representation. This system successfully collected, stored, and visualised 2880 data points within a 10-day timeframe with a 30 s interval [46][30]. A Vehicle Pollution Monitoring System using IoT was developed by Khatun et al. [52][31]. To monitor the vehicle’s emissions in real time, they installed a gas sensor at the exhaust, among other sensors. The data are then forwarded to the vehicle’s operator through GSM and the cloud, where they are checked against industry norms. The system’s performance has been validated and can significantly reduce and regulate emissions. In future research, the model can be used to monitor other harmful gases and be applied in various industries to reduce air pollution. Tsokov and Petrova-Antonova [54][32] proposed an IoT platform called EcoLogic for the real-time monitoring and control of vehicle carbon releases. The platform comprises hardware modules installed on vehicles and cloud-based applications for data processing, analysis, and visualisation. The authors conducted a case study to validate the feasibility of the proposed solution. They identified future research directions, such as optimising the solution to split data into subsets, implementing an analytics functionality for the prediction of possible failures in vehicles, and integrating EcoLogic with third-party systems and services. The authors concluded that EcoLogic is a complete solution for monitoring and controlling vehicles’ carbon emissions.2.5. Benefits of IoT-Based Visualisation Platforms
IoT has emerged as a promising technology for tracking and monitoring household carbon emissions. The IoT-based visualisation platform can track household CFs and recommend reducing carbon emissions. The following are its benefits:- (a)
-
Real-time monitoring: IoT-based visualisation platforms can monitor household carbon emissions. This can help individuals track their CFs and identify opportunities for reducing emissions.
- (b)
-
Energy efficiency: IoT can be used to monitor household energy consumption, which can help identify areas where energy efficiency improvements can be made. This can include using energy-efficient appliances, lighting, and HVAC systems.
- (c)
-
Behaviour change: IoT-based visualisation platforms can help encourage behaviour change by providing individuals with feedback on their carbon emissions. For example, if an individual uses more electricity than usual, the platform can alert them and provide recommendations for reducing energy consumption.
- (d)
-
Data collection: IoT-based visualisation platforms can collect data on household carbon releases. These data can be used to identify trends and patterns in carbon emissions, which can help inform policy decisions.
2.6. Challenges and Limitations of Existing IoT-Based Visualisation Platforms
IoT-based visualisation platforms for households can have comprehensive challenges and limitations, including data accuracy and reliability, high costs, limited device compatibility, privacy and security concerns, user adoption, maintenance, and support. Using IoT devices and sensors to monitor household energy consumption can produce unreliable data, leading to inaccurate CF estimates and affecting the effectiveness of visualisation platforms. These platforms can also be expensive due to the high cost of IoT equipment and may not be compatible with all household appliances and systems. Privacy and security concerns must also be addressed, and regular maintenance is required for smooth functioning. Adoption may be limited due to a lack of awareness or technical expertise. Overall, while IoT-based visualisation platforms have the potential to help households reduce their CFs, it is crucial to address these challenges and limitations to confirm their effectiveness and adoption.
References
- Microsoft. What Is IoT (Internet of Things)?|Microsoft Azure. Available online: https://azure.microsoft.com (accessed on 5 July 2023).
- WRAP. Introducing the Carbon Waste and Resources Metric (Carbon WARM); WRAP: Banbury, UK, 2021.
- Agency Environmental Protection. Carbon Footprint Calculators. Available online: www.epa.ie (accessed on 5 July 2023).
- Khoa, T.A.; Phuc, C.H.; Lam, P.D.; Nhu, L.M.B.; Trong, N.M.; Phuong, N.T.H.; Van Dung, N.; Tan-Y, N.; Nguyen, H.N.; Duc, D.N.M. Waste Management System Using IoT-Based Machine Learning in University. Wirel. Commun. Mob. Comput. 2020, 2020, 6138637.
- United Nations. United Nations Framework Convention on Climate Change; United Nations: New York, NY, USA, 1992.
- Sarrab, M.; Pulparambil, S.; Awadalla, M. Development of an IoT based real-time traffic monitoring system for city governance. Glob. Transit. 2020, 2, 230–245.
- The Carbon Trust. Footprinting and Reporting; The Carbon Trust: London, UK, 2020.
- IEA. Appliances & Equipment—Fuels & Technologies; IEA: Paris, France, 2023.
- Ramelan, A.; Adriyanto, F.; Hermanu, B.; Ibrahim, M.H.; Saputro, J.S.; Setiawan, O. IoT Based Building Energy Monitoring and Controlling System Using LoRa Modulation and MQTT Protocol. IOP Conf. Ser. Mater. Sci. Eng. 2021, 1096, 012069.
- Tu, M.; Chung, W.-H.; Chiu, C.-K.; Chung, W.; Tzeng, Y. A Novel IoT-Based Dynamic Carbon Footprint Approach to Reducing Uncertainties. In Proceedings of the 2017 4th International Conference on Industrial Engineering and Applications, Nagoya, Japan, 21–23 April 2017; pp. 249–256.
- Zen, I.S.; Al-Amin, A.Q.; Alam, M.; Doberstein, B. Magnitudes of households’ carbon footprint in Iskandar Malaysia: Policy implications for sustainable development. J. Clean. Prod. 2021, 315, 128042.
- Chagnon-Lessard, N.; Gosselin, L.; Barnabe, S.; Bello-Ochende, T.; Fendt, S.; Goers, S.; Da Silva, L.C.P.; Schweiger, B.; Simmons, R.; Vandersickel, A.; et al. Smart Campuses: Extensive Review of the Last Decade of Research and Current Challenges. IEEE Access 2021, 9, 124200–124234.
- Zheng, H.; Song, M.; Shen, Z. The evolution of renewable energy and its impact on carbon reduction in China. Energy 2021, 237, 121639.
- Lopez-Ruiz, H.G.; Crozet, Y. Sustainable Transport in France. Transp. Res. Rec. J. Transp. Res. Board 2010, 2163, 124–132.
- Elgaaied-Gambier, L.; Bertrandias, L.; Bernard, Y. Cutting the Internet’s Environmental Footprint: An Analysis of Consumers’ Self-Attribution of Responsibility. J. Interact. Mark. 2020, 50, 120–135.
- Hernández, C.; Vita, G. Carbon footprint analysis of household consumption in greater Guadalajara reveal stark socio-spatial inequalities. Ecol. Econ. 2022, 199, 107495.
- Anthony, L.F.W.; Kanding, B.; Selvan, R. Carbontracker: Tracking and Predicting the Carbon Footprint of Training Deep Learning Models. arXiv 2020, arXiv:2007.03051.
- Samara, F.; Ibrahim, S.; Yousuf, M.E.; Armour, R. Carbon Footprint at a United Arab Emirates University: GHG Protocol. Sustainability 2022, 14, 2522.
- Liu, Z.; Wang, G.; Zhao, L.; Yang, G. Multi-Points Indoor Air Quality Monitoring Based on Internet of Things. IEEE Access 2021, 9, 70479–70492.
- Bagus, I.; Purwania, G.; Kumara, I.N.S.; Sudarma, M. Application of IoT-Based System for Monitoring Energy Consumption. Int. J. Eng. Emerg. Technol. 2020, 5, 81–93.
- Benammar, M.; Abdaoui, A.; Ahmad, S.H.; Touati, F.; Kadri, A. A Modular IoT Platform for Real-Time Indoor Air Quality Monitoring. Sensors 2018, 18, 581.
- Sruthi, M.S.; Rajkumar, M.N.; Kumar, V.V. Smart IoT Based System for CO2 Monitoring and Forest Fire Detection with Effective Alert Mechanism. Researchgate.Net, Volume 3, June 2019, pp. 256–258. 2017. Available online: https://www.researchgate.net/profile/Sruthi_Ms/publication/333650806_Smart_IoT_Based_System_For_CO_2_Monitoring_and_Forest_Fire_Detection_with_Effective_Alert_Mechanism/links/5cf9fa4e4585157d1598c4e7/Smart-IoT-Based-System-For-CO-2-Monitoring-and-Forest-F (accessed on 5 July 2023).
- Xu, J.; Pan, W.; Teng, Y.; Zhang, Y.; Zhang, Q. Internet of Things (IoT)-Integrated Embodied Carbon Assessment and Monitoring of Prefabricated Buildings. IOP Conf. Ser. Earth Environ. Sci. 2022, 1101, 02203.
- Ytreberg, N.S.; Alfnes, F.; van Oort, B. Mapping of the digital climate nudges in Nordic online grocery stores. Sustain. Prod. Consum. 2023, 37, 202–212.
- Heydarian, A.; Golparvar-Fard, M. A Visual Monitoring Framework for Integrated Productivity and Carbon Footprint Control of Construction Operations. In Proceedings of the Congress on Computing in Civil Engineering, Miami, FL, USA, 19–22 June 2011.
- Zaman, N.; Jhanjhi, J. A New Platform Based on Various Sensors Offers Smart Contracts to Reduce Carbon Emissions Data Visualization, Industrial Control, and Activity. 2022. Available online: https://www.researchsquare.com/article/rs-2164843/v1.pdf (accessed on 5 July 2023).
- Zhao, L.; Zhou, H.; Chen, R.; Shen, Z. Efficient Monitoring and Adaptive Control of Indoor Air Quality Based on IoT Technology and Fuzzy Inference. Wirel. Commun. Mob. Comput. 2022, 2022, 4127079.
- Guzman, L.; Makonin, S.; Clapp, R.A. CarbonKit: A Technological Platform for Personal Carbon Tracking. 2016. Available online: https://www.researchgate.net/publication/306187365_CarbonKit_a_technological_platform_for_personal_carbon_tracking (accessed on 5 July 2023).
- Magtibay, O.B.M.; Cabrera, R.H.; Roxas, J.P.; De Vera, M.A. Green switch: An IoT based energy monitoring system for mabini building in De La Salle Lipa. Indones. J. Electr. Eng. Comput. Sci. 2021, 24, 754–761.
- Ming, F.X.; Habeeb, R.A.A.; Nasaruddin, F.H.B.M.; Bin Gani, A. Real-Time Carbon Dioxide Monitoring Based on IoT & Cloud Technologies. In Proceedings of the 2019 8th International Conference on Software and Computer Applications, Cairo, Egypt, 9–12 April 2019; pp. 517–521.
- Khatun, R.; Antor, S.A.; Ullah, A.; Hossain, A. Vehicle Fuel Activities Monitoring System Using IoT. Adv. Internet Things 2019, 9, 63–71.
- Tsokov, T.; Petrova-Antonova, D. EcoLogic: IoT Platform for Control of Carbon Emissions. In Proceedings of the 12th International Conference on Software Technologies, Madrid, Spain, 24–26 July 2017; pp. 178–185.